
Key Takeaways
-
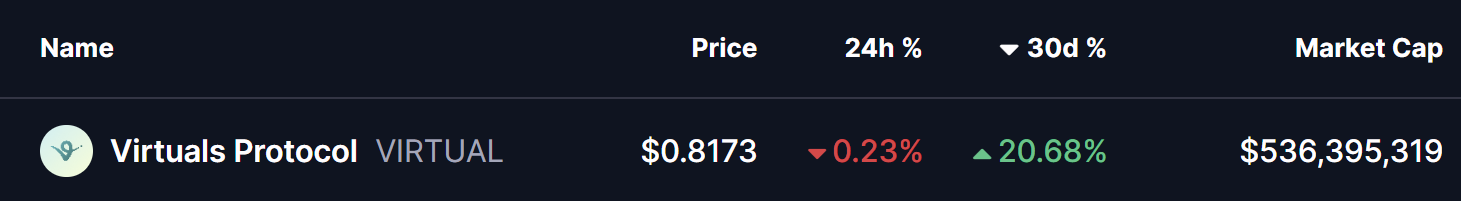
Virtuals Protocol (VIRTUAL) is holding around 20% monthly gains despite short-term market weakness.
-
The 4H chart shows a developing inverse head and shoulders pattern, a classic bullish reversal structure.
-
Price recently faced rejection near the $0.85 neckline, suggesting the right shoulder is still forming.
-
A potential dip toward the $0.78 support zone could complete the pattern and attract buyers.
-
A confirmed breakout above $0.85 may open the door for a stronger upside move, while losing $0.78 could delay the bullish setup.
Virtuals Protocol (VIRTUAL), the native token of the decentralized infrastructure and launchpad powering autonomous AI agents, has been holding up relatively well despite recent market-wide hesitation. The token is still sitting on around 20% monthly gains, although it is trading slightly in the red today in line with broader crypto sentiment.
Source: Coinmarketcap
However, when you zoom into the chart, the price action tells a more interesting story. Beneath the short-term weakness, VIRTUAL appears to be building a classic bullish reversal structure, one that could act as the base for a stronger upside move if confirmed.
Inverse Head and Shoulders Pattern Takes Shape
On the 4-hour timeframe, VIRTUAL has carved out a clear inverse head and shoulders pattern, a formation often associated with trend reversals after a prolonged pullback.
-
The left shoulder developed near the $0.80 zone, where buyers initially stepped in.
-
This was followed by a deeper decline toward $0.75, forming the head of the structure and marking the local low.
-
Price then rebounded toward the descending neckline resistance around $0.85, where it faced rejection once again.
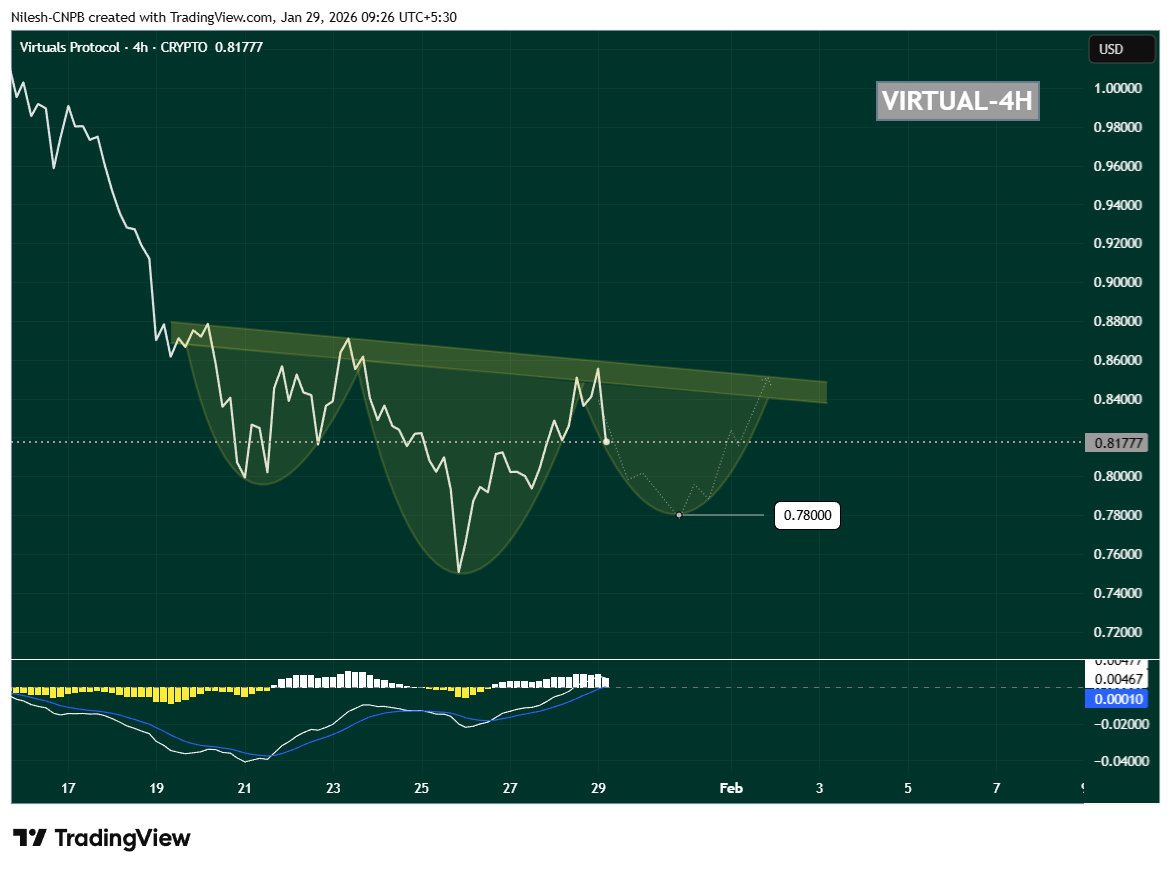
VIRTUAL 4H Chart/Coinsprobe (Source: Tradingview)
Following this rejection, VIRTUAL has started to drift lower and is currently trading near $0.8177, suggesting that the right shoulder may still be forming. This behavior fits well with the textbook structure of the pattern and keeps the bullish setup technically valid for now.
Momentum Signals Support the Setup
Momentum indicators are also worth watching closely. On the same timeframe, the MACD is cooling off and curling downward, reflecting short-term weakness rather than a full trend breakdown. In many cases, this kind of MACD reset during right-shoulder formation actually helps fuel the next impulsive move higher once buyers regain control.
As long as selling pressure remains controlled and price avoids a sharp breakdown, this momentum reset can work in favor of the bulls.
What’s Next for VIRTUAL?
If the pattern continues to play out, VIRTUAL could dip toward the $0.78 region, which aligns well with the projected right-shoulder bottom visible on the chart. This zone may act as a critical demand area where buyers look to step back in.
A strong bounce from this region, followed by renewed buying pressure, would increase the probability of a bullish breakout attempt toward the $0.85 neckline. A clean move above this resistance would confirm the inverse head and shoulders pattern and signal a potential shift back into a short-term uptrend.
On the downside, losing the $0.78 support decisively would weaken the structure and delay the bullish thesis, potentially opening the door for deeper consolidation.
For now, VIRTUAL is at a key technical crossroads. The structure remains constructive, the pattern is intact, and the chart suggests that the next major move—up or down—could arrive once this right shoulder finishes forming. Traders will be watching closely how price reacts around support in the coming sessions.
Disclaimer: The views and analysis presented in this article are for informational purposes only and reflect the author’s perspective, not financial advice. Technical patterns and indicators discussed are subject to market volatility and may or may not yield the anticipated results. Investors are advised to exercise caution, conduct independent research, and make decisions aligned with their individual risk tolerance.
About Author: Nilesh Hembade is the Founder and Lead Author of Coinsprobe, with over 5 years of experience in the cryptocurrency and blockchain industry. Since launching Coinsprobe in 2023, he has been providing daily, research-driven insights through in-depth market analysis, on-chain data, and technical research.
Disclaimer: The information on this page may come from third parties and does not represent the views or opinions of Gate. The content displayed on this page is for reference only and does not constitute any financial, investment, or legal advice. Gate does not guarantee the accuracy or completeness of the information and shall not be liable for any losses arising from the use of this information. Virtual asset investments carry high risks and are subject to significant price volatility. You may lose all of your invested principal. Please fully understand the relevant risks and make prudent decisions based on your own financial situation and risk tolerance. For details, please refer to
Disclaimer.
Related Articles
The RWA Yield Infrastructure Trade
The essay highlights challenges in direct RWA token exposure, emphasizes the potential in leverage opportunities amid settlement delays, critiques Morpho's governance token structure, and presents Fluid as a more effective token model with stablecoin links.
CoinDesk1h ago
Finam Analyst: Gold may plummet to $3,100, avoid catching the falling knife, wait for a reversal before rebuilding positions
Russian Finam analyst Dudchenko warned that gold could fall to $3,100 per ounce, advising investors to stay away from the market and wait for price reversal before entering. The gold decline is mainly driven by concerns about the Federal Reserve's interest rate policy and passive liquidations by large institutions. Despite the gold pullback, it is still expected to advance toward $5,000 in the future. The silver market is also facing similar pressure.
MarketWhisper1h ago
10x Research: Circle Stock Price Drops Approximately 20% in a Single Day, Will Re-evaluate "Long Circle Short Certain CEX" Strategy
10x Research analysis indicates that Circle is facing intensified stablecoin economic competition with a certain CEX. Circle's stock price declined due to CLARITY Act uncertainty, but the legislation could bring structural benefits. Circle supports stablecoin regulation in exchange for legitimacy, while the certain CEX prioritizes short-term profitability. Their business models are at odds; under regulation, Circle may forgo high-margin distribution in exchange for sustained "regulatory certainty" and drive institutional adoption and financial integration.
GateNews1h ago
Arthur Hayes: The Current Market Has Illusions About Future Positive Catalysts, I Won't Buy Here
BlockBeats news: On March 25th, Arthur Hayes posted on social media that the current market is filled with illusions about a positive outlook for the future. Of course, he hopes the slaughter can stop, but he will not be buying risk assets here.
BlockBeatNews1h ago
Iran Conflict Fuels Inflation Pressure! Rate Hike Expectations Soar, Bitcoin Holds Steady at 70K
Military tensions between the United States and Iran are escalating, driving oil prices up to $104 per barrel and bringing inflationary pressures back to the fore. The probability of Federal Reserve rate hikes has surged significantly, with U.S. stocks showing mixed performance, technology stocks under pressure, and energy stocks performing strongly. Bitcoin remains flat at $70,500, as markets reassess future funding costs and cash becomes the preferred choice for investors.
ChainNewsAbmedia1h ago
