
**Date: **Wed, Jan 07, 2026 | 06:20 AM GMT
The broader cryptocurrency market continues to show strong New Year momentum, with Bitcoin (BTC) up around 4% and Ethereum (ETH) gaining over 9% on a weekly basis. This improving sentiment is gradually spilling over into major altcoins — including the DePIN-focused token Akash Network (AKT).
AKT has already posted an impressive 20% weekly gain. While this short-term strength has caught traders’ attention, the more important development is unfolding on the higher-timeframe chart. Recent price action suggests a meaningful shift in market structure, hinting that AKT may be transitioning out of a prolonged corrective phase and into the early stages of a bullish continuation.
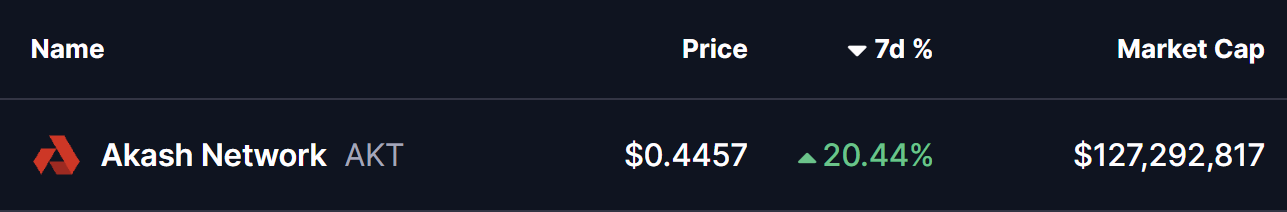
Source: Coinmarketcap
Falling Wedge and Rounding Bottom in Play
On the daily chart, AKT has been trading within a broader falling wedge — a structure that often precedes bullish reversals as selling pressure gradually weakens. Within this larger wedge, price action is also shaping a developing rounding bottom pattern, reflecting steady accumulation and seller exhaustion.
The formation began after AKT faced strong rejection near the $0.5441 resistance zone in late November. That rejection triggered a sharp sell-off, pushing price lower toward the $0.3465 region. However, bears failed to extend losses beyond this area. Instead, demand stepped in, downside momentum slowed, and price began to stabilize.
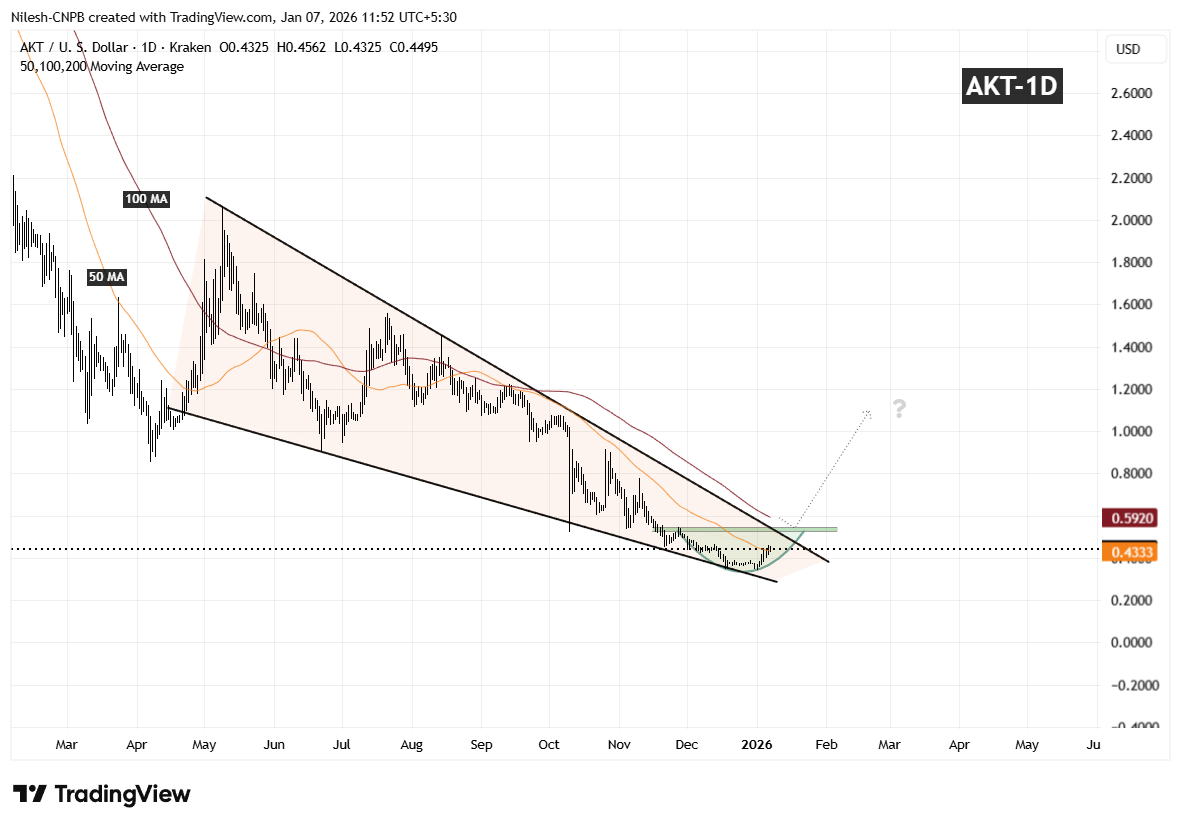
Akash Network (AKT) Daily Chart/Coinsprobe (Source: Tradingview)
Over the following weeks, volatility compressed and AKT started to curl higher in a smooth, rounded fashion — closely matching the textbook behavior of a rounding bottom. Importantly, the recent rebound has pushed price back above the 50-day moving average around $0.4333, a level that had previously acted as resistance and is now beginning to flip into support.
What’s Next for AKT?
If AKT can continue to hold above the 50-day moving average, this area may act as a solid base for further upside attempts. From here, attention shifts toward the descending resistance trendline of the falling wedge, which aligns closely with the $0.5441 resistance zone.
A clean and decisive breakout above this confluence area, followed by sustained acceptance, would confirm a broader bullish expansion phase and mark a clear trend reversal from the prior downtrend. Such a move would likely attract renewed momentum participation as the market recognizes the structural shift.
Until that breakout occurs, the pattern remains in development. Short-term consolidation or shallow pullbacks are still possible as price digests recent gains. However, as long as AKT continues to print higher lows above the established base, the broader technical structure remains constructive.
Overall, the chart suggests AKT is approaching a critical inflection point — one that could determine whether this recovery evolves into a sustained bullish trend as 2026 progresses.
Disclaimer: The views and analysis presented in this article are for informational purposes only and reflect the author’s perspective, not financial advice. Technical patterns and indicators discussed are subject to market volatility and may or may not yield the anticipated results. Investors are advised to exercise caution, conduct independent research, and make decisions aligned with their individual risk tolerance.
About Author: Nilesh Hembade is the Founder and Lead Author of Coinsprobe, with over 5 years of experience in the cryptocurrency and blockchain industry. Since launching Coinsprobe in 2023, he has been providing daily, research-driven insights through in-depth market analysis, on-chain data, and technical research.
Disclaimer: The information on this page may come from third parties and does not represent the views or opinions of Gate. The content displayed on this page is for reference only and does not constitute any financial, investment, or legal advice. Gate does not guarantee the accuracy or completeness of the information and shall not be liable for any losses arising from the use of this information. Virtual asset investments carry high risks and are subject to significant price volatility. You may lose all of your invested principal. Please fully understand the relevant risks and make prudent decisions based on your own financial situation and risk tolerance. For details, please refer to
Disclaimer.
Related Articles
Crypto Fear & Greed Index Drops to 32, Market in Panic Mode
Crypto Fear & Greed Index fell to 32 from 33, signaling continued panic; the 0-100 scale marks fear below 50 and greed above 50.
Abstract: The Crypto Fear & Greed Index dropped to 32 on April 22, signaling ongoing panic after a decline from 33 the previous day. The index operates on a 0-100 scale, with readings below 50 indicating fear and readings above 50 indicating greed.
GateNews12m ago
The Iran-U.S. talks did not take place as expected, stocks in the U.S. fell, and Bitcoin traded in a range.
U.S.-Iran talks did not go as expected, and the stock market fell; Vance postponed his visit to Pakistan, and the Strait of Hormuz blockade will continue. U.S. March retail sales rose 1.7%, beating expectations. Waller was nominated as the next Chair of the Federal Reserve, emphasizing independence; market expectations are broadly neutral. Bitcoin is still consolidating in the 74k–77k range, spot ETFs have recorded net inflows for five straight days, and ETH ETFs have also seen net inflows day after day. Sentiment is stabilizing, and the volatility spread indicates that risk appetite is declining.
ChainNewsAbmedia50m ago
BUY ALTCOINS NOW” — Altseason Index Signals Massive Pump Ahead, But Are These 4 Coins Worth the Risk?
The Altseason Index shows a compression pattern that often precedes strong market expansion.
XRP reflects stability, while Aptos and Sui show higher growth but increased volatility.
Pi remains speculative due to unclear liquidity and limited exchange presence.
The altcoin market is
CryptoNewsLand1h ago
Dogecoin Holds $0.094 as X Cashtags Drive Market Attention
Key Insights
Dogecoin holds above $0.094 despite market weakness as Bitcoin and Ethereum stabilize, reflecting resilience and sustained demand across major cryptocurrencies during the consolidation phase.
X launches smart cashtags enabling real-time crypto and stock tracking, improving marke
CryptoNewsLand5h ago
ADA Price Outlook as Cardano Lands LSE Tokenized Deal
Key Insights
Cardano tokenized a Hannover Re reinsurance product and listed it on the London Stock Exchange, expanding blockchain use in regulated institutional markets.
ADA price holds within a descending wedge as support at $0.2400 remains intact while resistance near $0.2550 and $0.2824 l
CryptoNewsLand5h ago
