
**Date: **Sat, Jan 03, 2026 | 01:26 PM GMT
As 2026 kicks off, the broader cryptocurrency market is showing renewed stability. Ethereum (ETH) has reclaimed the $3,100 level, and several major altcoins are already beginning to pick up momentum. Against this improving backdrop, Kaspa (KAS) is quietly positioning itself as a potential late mover, with its chart structure starting to flash early bullish signals.
While KAS is trading slightly in the red today and remains mostly flat on the weekly timeframe, the more important story is unfolding beneath the surface. Recent price action suggests a meaningful structural shift may be underway — one that could mark the early stages of a bullish continuation if confirmed.
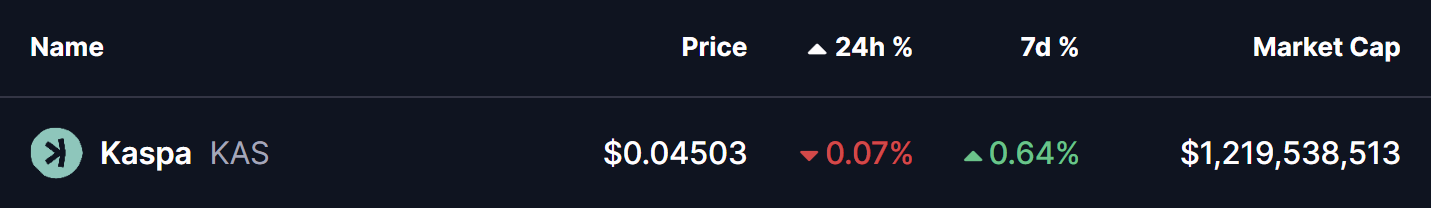
Source: Coinmarketcap
Rounding Bottom in Play
On the 4-hour timeframe, Kaspa appears to be forming a rounding bottom pattern, a classic bullish reversal structure that typically develops after a prolonged corrective phase. This pattern reflects a slow but steady transition from distribution to accumulation, as selling pressure weakens and buyers gradually regain control.
The setup began after KAS faced strong rejection near the $0.06310 neckline zone, which triggered a sharp decline through late November and December. That downside move eventually found strong demand near the $0.040 level, which has since acted as a key support area. Multiple defenses of this zone prevented further downside and helped establish a stable base for a potential trend reversal.
Since carving out that bottom, KAS has started to curve higher in a smooth, rounded fashion — closely matching the textbook structure of a developing rounding bottom. The recent stabilization above the $0.045 region further supports the idea that downside momentum is fading.
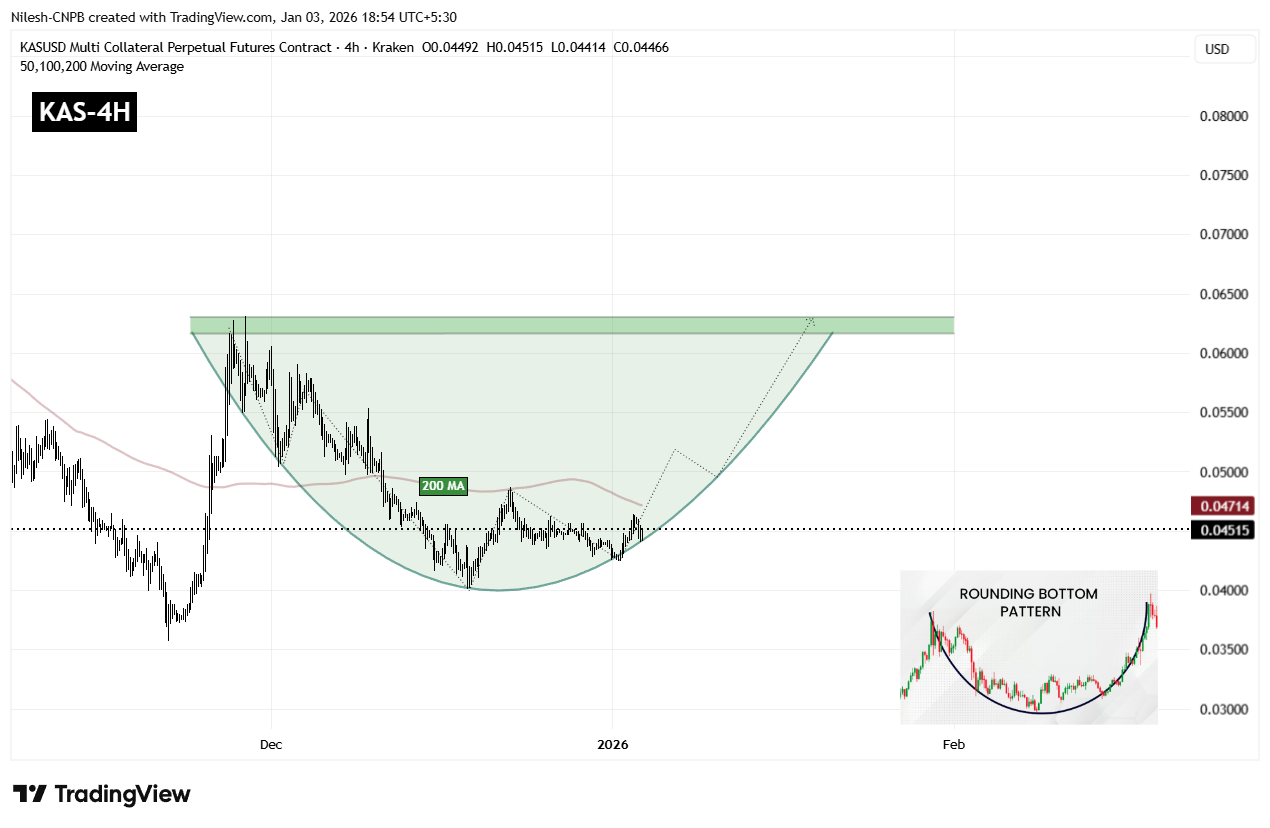
Kaspa (KAS) 4H Chart/Coinsprobe (Source: Tradingview)
A key technical level now comes into focus: the 200-period moving average, currently hovering near $0.04714. This level has acted as dynamic resistance during the recovery phase, and reclaiming it would mark an important shift in short-term market structure.
A sustained move above the 200 MA would indicate that buyers are regaining control after months of corrective price action and could act as the trigger for a stronger upside continuation.
What’s Next for KAS?
For full confirmation of the rounding bottom pattern, KAS must eventually reclaim the $0.06310 neckline resistance. A clean breakout above this zone would validate the entire reversal structure and could open the door to a broader bullish expansion phase, with momentum traders likely re-entering the market.
Until that breakout occurs, the pattern remains in development. Short-term consolidation or shallow pullbacks remain possible, especially near moving average resistance. However, as long as price continues to hold above the $0.04245 support base and maintains higher lows, the broader bottoming structure remains intact and constructive.
In the near term, all eyes remain on the 200 MA and the neckline zone. How Kaspa reacts around these levels will likely determine whether this emerging bullish setup evolves into a confirmed breakout move or requires more time to mature.
Disclaimer: The views and analysis presented in this article are for informational purposes only and reflect the author’s perspective, not financial advice. Technical patterns and indicators discussed are subject to market volatility and may or may not yield the anticipated results. Investors are advised to exercise caution, conduct independent research, and make decisions aligned with their individual risk tolerance.
About Author: Nilesh Hembade is the Founder and Lead Author of Coinsprobe, with over 5 years of experience in the cryptocurrency and blockchain industry. Since launching Coinsprobe in 2023, he has been providing daily, research-driven insights through in-depth market analysis, on-chain data, and technical research.
Disclaimer: The information on this page may come from third parties and does not represent the views or opinions of Gate. The content displayed on this page is for reference only and does not constitute any financial, investment, or legal advice. Gate does not guarantee the accuracy or completeness of the information and shall not be liable for any losses arising from the use of this information. Virtual asset investments carry high risks and are subject to significant price volatility. You may lose all of your invested principal. Please fully understand the relevant risks and make prudent decisions based on your own financial situation and risk tolerance. For details, please refer to
Disclaimer.
Related Articles
Bitcoin, ether, solana hold steady as Trump sets Tuesday night deadline for Iran deal
Bitcoin dipped to $68,589 after a brief rally fueled by ceasefire news, as geopolitical tensions persist. Other cryptocurrencies also fell. Market uncertainty continues, with Bitcoin trading within the $65,000 to $73,000 range, awaiting Trump's deadline for Iran negotiations.
CoinDesk20m ago
Bitcoin drops toward $68,000 as demand weakens and whales sell
Bitcoin BTC$68,767.57 slid toward $68,000 on Tuesday, with traditional markets closed in Hong Kong for a long weekend, as repeated failures near $70,000 left the bitcoin market vulnerable to a break lower.
The drop came after another failed push above $70,000, with prices slipping quickly once
CoinDesk54m ago
Bitcoin is hovering around the $68,000 threshold, and the risk of further downside is increasing as whales sell and demand remains weak.
Gate News: Bitcoin’s price has fallen to around $68,000. It had repeatedly failed to break through the $70,000 level, and market momentum has clearly weakened. The current price is still within the $65,000 to $73,000 trading range, but the risk of testing the lower end of the range is rising.
GateNews57m ago
Santiment Alert: BTC profit-loss ratio hits 2.95, the top signal is approaching
Based on Santiment data, Bitcoin’s profit-to-loss trade ratio has reached 2.95:1, nearing the historical alert level of 3.0, which may signal a short-term price top. A high profit-to-loss ratio also reflects optimistic market sentiment, but it can also build up selling pressure. Historical cases show that a profit-to-loss ratio near 3.0 does not necessarily lead to a pullback; the market needs to combine multiple indicators for a comprehensive analysis.
MarketWhisper1h ago
Freedom of Money surges 50%, as CZ’s new book drives a wave of same-name meme coin hype
Meme coin Freedom of Money saw a major surge of 50% on April 7, with its market value exceeding $22 million, driven by market sentiment after CZ announced that a new book is set to be released. However, the coin has no official connection to CZ or Binance, and its rally is purely a market-sentiment hype; investors should be cautious of the risks stemming from a lack of fundamental support.
MarketWhisper1h ago
The crypto market is broadly down; only the RWA sector is up slightly, at 0.42%.
On April 7, the crypto market fell broadly, with only the RWA sector up slightly by 0.42%. Major coins Bitcoin and Ethereum declined by 0.34% and 0.43%, respectively. Other sectors generally contracted, but some projects such as Creditcoin and Centrifuge rose against the trend.
GateNews2h ago
