On Friday, the strong volatility wave of Bitcoin triggered widespread selling pressure in the market, causing Litecoin (LTC) to plummet by 7.5% within just 5 hours. This downward momentum pushed LTC to a new low at $72.64 before the coin attempted to recover. At the time of recording, LTC is trading around $75.89.
In the past two weeks of trading, Litecoin bulls have completely lost control of the important long-term support zone between $80–$84. Previously, a report from Coin Photon emphasized that this area plays a key role in maintaining LTC’s long-term price structure.
Notably, the report also pointed out that the bulls are weakening significantly, almost exhausted of momentum, and are only maintaining a defensive stance. Even with Litecoin being included in the Bitwise 10 Crypto Index ETF (BITW), it was not enough to generate a significant boost to the price on the trading chart.
Assessing the strength of Litecoin’s next downward trend
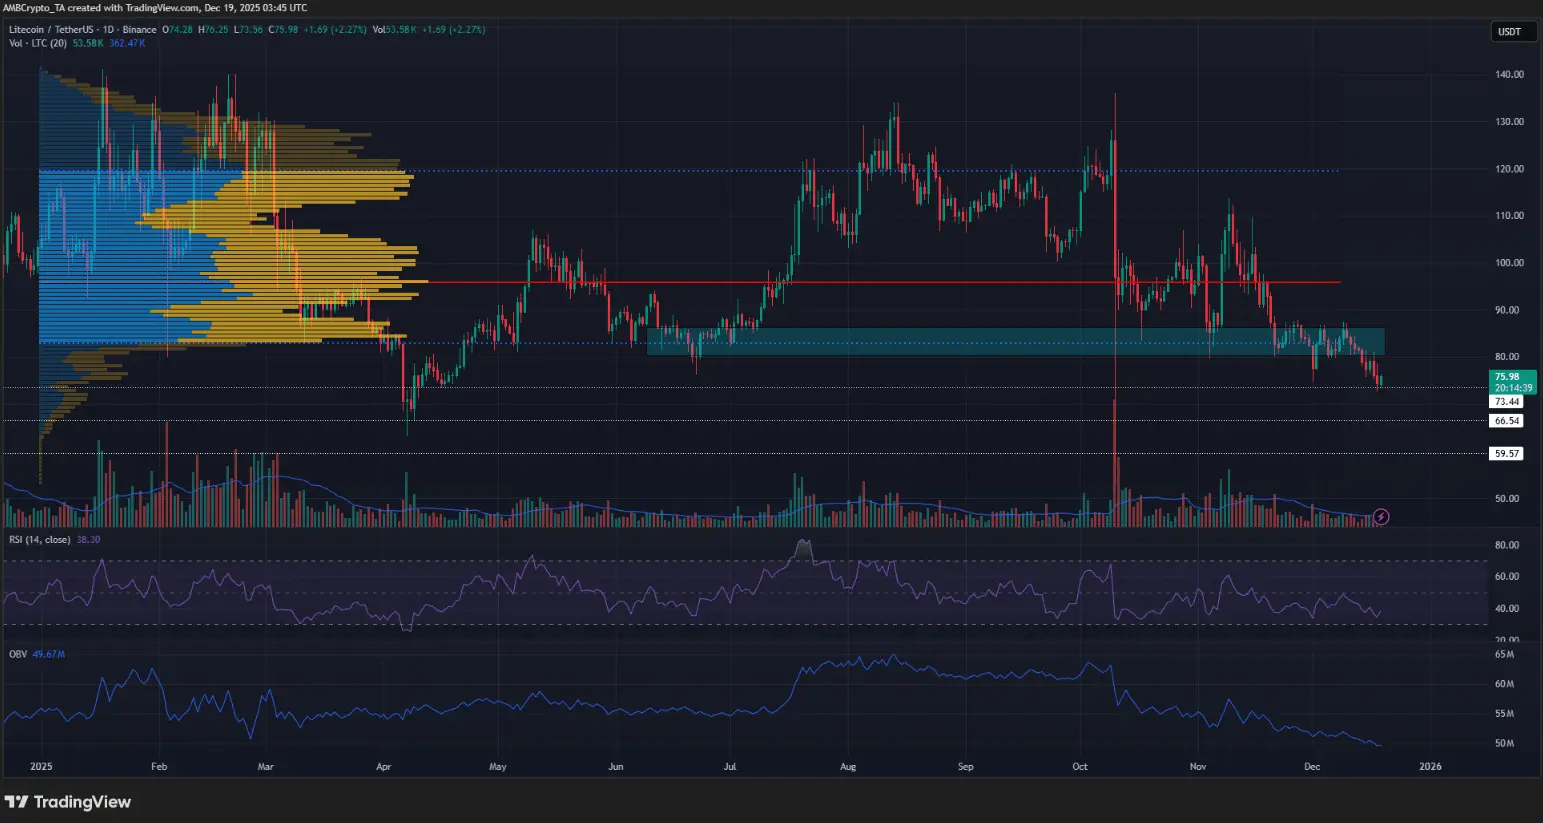 Daily LTC/USDT chart | Source: TradingView Using the Fixed Range Volume Profile tool for the entire 2025, the Value Area High (VAH) and Value Area Low (VAL) are identified at $120 and $83 respectively. After the first week of October, when Litecoin continued trading above the year’s VAH, the market experienced a sharp decline on October 10, marking an important turning point in the trend structure.
The OBV (On-Balance Volume) indicator shows that the supply-demand balance at that time had clearly tilted in favor of the bears, reflecting overwhelming selling pressure. In November, Litecoin entered a period of high volatility and attempted to defend the psychological support zone of $80, but weak demand was insufficient to reverse the downward trend forming.
When the $80 level was officially broken, the situation became more unfavorable for the bulls. The next long-term support zones that the bears might target are at $73.4, $66.5, and deeper at $59.6.
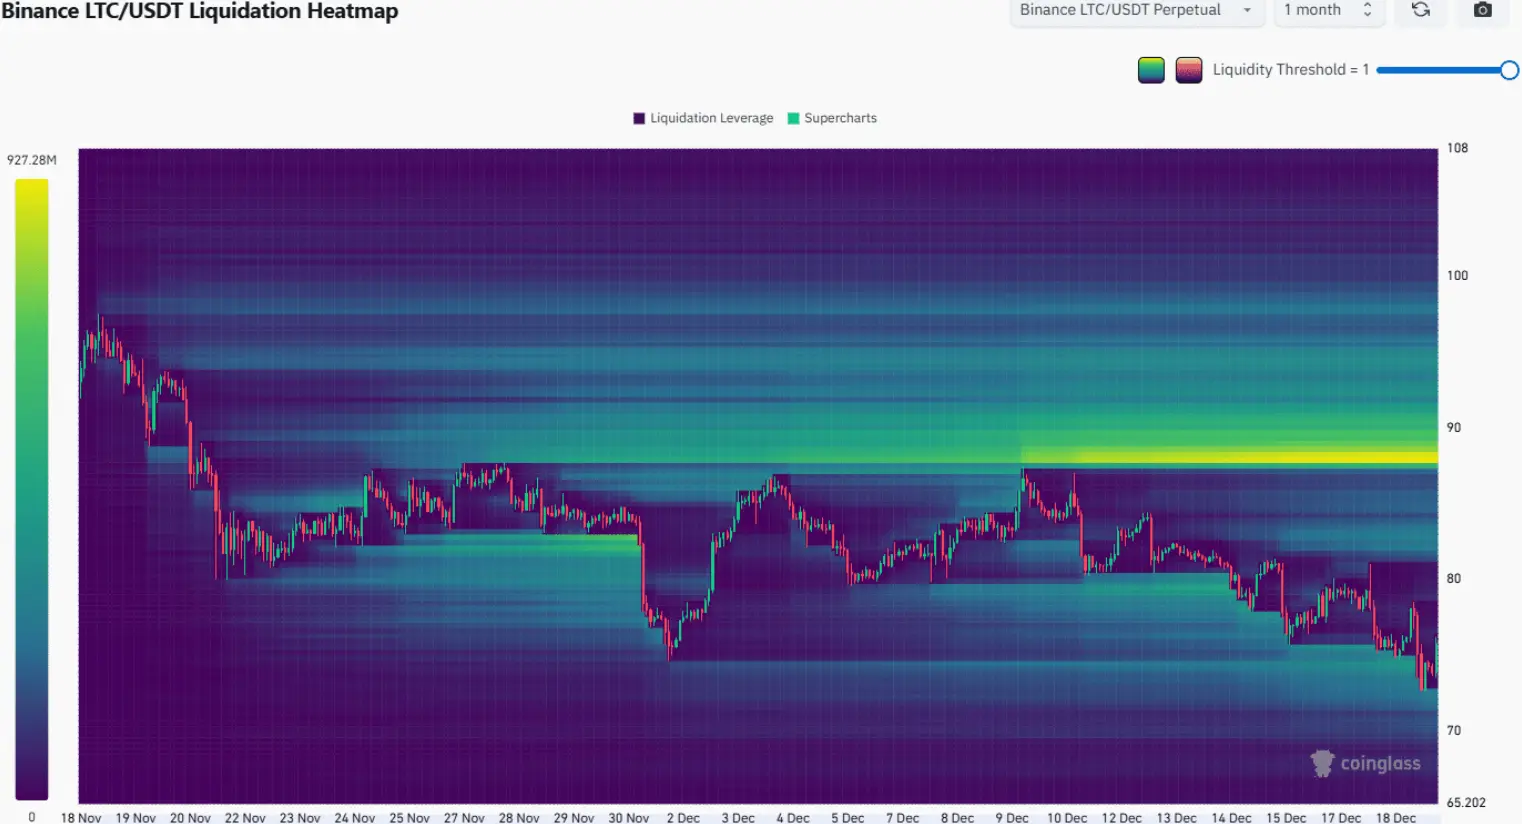 Source: CoinGlass Notably, the monthly liquidation heatmap shows that the liquidity around the $73 zone has been wiped out. In this context, a technical rebound could occur, and the price is likely to be pulled back toward the “magnet” zone of $82–$83, where supply and demand may continue to struggle in the short term.
Less likely scenarios for Litecoin
This is a notable bullish scenario. The $88 zone currently acts as a “liquidity magnet,” where a large concentration of short position liquidations (Short) is focused, potentially attracting the price gradually toward this area. If the overall market sentiment turns positive, triggering a chain reaction of short squeeze effects, LTC could break above $90, thereby reaffirming and strengthening the medium-term bullish trend.
Trader recommendations – Continue to maintain a bearish outlook
This altcoin has just lost a key support zone, signaling a clear market weakening. The main trend and price structure remain entirely bearish, while buying pressure on higher timeframes is almost absent, indicating that the bulls are not yet strong enough to regain control.
In a recovery scenario, the $80–$84 zone is likely to serve as a very strong resistance area that is difficult to conquer. Therefore, traders may consider short-selling on rebounds, with target prices around the support zones of $66 and deeper at $59.
Disclaimer: The information on this page may come from third parties and does not represent the views or opinions of Gate. The content displayed on this page is for reference only and does not constitute any financial, investment, or legal advice. Gate does not guarantee the accuracy or completeness of the information and shall not be liable for any losses arising from the use of this information. Virtual asset investments carry high risks and are subject to significant price volatility. You may lose all of your invested principal. Please fully understand the relevant risks and make prudent decisions based on your own financial situation and risk tolerance. For details, please refer to
Disclaimer.
Related Articles
Cryptocurrency Fear and Greed Index Falls to 8 Today, Market Extreme Panic Sentiment Deepens
Gate News reported that on March 23rd, according to Alternative.me data, today's cryptocurrency fear and greed index fell to 8, declining further from yesterday's 10. The index indicates the market is currently in a state of extreme panic, with panic sentiment continuing to deepen.
GateNews9m ago
The Hormuz Strait crisis remains unresolved, and Bitcoin has fallen below 68K.
Affected by the US-Iran conflict, global markets have been severely impacted, with the S&P 500 Index declining for four consecutive weeks. Gold has experienced a modest rebound around $4,500, while oil prices remain stable at elevated levels. Trump has issued an ultimatum to Iran, with potential escalation of conflict between the two sides. Bitcoin and Ethereum have also declined in tandem, and market sentiment has turned conservative.
ChainNewsAbmedia21m ago
River (RIVER) Price Keeps Pumping as TD Indicator Signals Another Rally
Analyst Ali Martinez highlights the accuracy of the TD Sequential indicator in predicting River (RIVER) price movements. The indicator has consistently identified significant buy and sell signals throughout RIVER's volatility, suggesting potential future trends based on current signals.
CaptainAltcoin1h ago
ETH 15-minute decline of 0.88%: Capital outflow dominates market, intensifying short-term selling pressure
On March 22, 2026, from 21:00 to 21:15 (UTC), Ethereum (ETH) recorded a -0.88% return rate within 15 minutes, with the price fluctuating in the range of 2029.54 to 2060.75 USDT, reaching an amplitude of 1.52%. Market attention has increased, short-term volatility has significantly intensified, reflecting rapid conversion of funding pressure into price pressure.
The main driver of this anomaly is accelerated capital outflows from trading platforms: approximately 420,690 USD equivalent of ETH flowed in within 10 minutes, but the number of withdrawals reached 2,319 transactions in the past 1 hour, far exceeding deposits during the same period by 5
GateNews3h ago
BTC Drops 0.58% in 15 Minutes: Tight Liquidity and Institutional Hedging Create Downward Pressure
2026-03-22 21:00 to 21:15 (UTC), BTC recorded a -0.58% return within just 15 minutes, with prices fluctuating in the range of 67562.1 to 68223.5 USDT, with an amplitude of 0.97%. During this period, market sentiment was highly tense, overall attention increased, and short-term volatility accelerated noticeably.
The main driving force behind this anomaly was the resonance formed by spot market liquidity shortage and medium-sized funds accelerating their exit. On-chain data shows a significant net outflow of -371.99 BTC in the $100k-$1M transaction range, driving selling
GateNews3h ago
Risk-Off Drips throughout Markets
Geopolitical tensions and rising uncertainty have led to a risk-off sentiment in global markets, with investors moving away from assets like Bitcoin and Ethereum. High oil prices and inflation concerns influenced portfolio adjustments, while Bitcoin selling pressure increased as short-term holders took profits. The market remains sensitive amid low sentiment.
CryptoBreaking3h ago
