Kaspa (KAS) is moving through a rough market phase, but development on the network continues in the background.
A major hardfork is scheduled for May, introducing smart contracts and native assets through a covenant-focused upgrade. The goal is to bring programmability directly to Layer 1.
Kaspa has now processed over 600 million transactions, showing that people are still using the network and that its BlockDAG system is handling activity well.
Even with that progress, the broader market drop in late February, driven by geopolitical tension, pulled most crypto prices down, including KAS. The KAS price was not spared and is now trading around $0.02985 after testing support.
- What the Kaspa Chart Is Showing
- What the Indicators Are Saying
- Kaspa Price Targets to Watch This Week
What the Kaspa Chart Is Showing
On the 4H chart, KAS remains in a broader downtrend. Price has been forming lower highs for weeks, and each bounce has struggled to gain momentum.
The recent correction took the Kaspa price down to the range of $0.024 to $0.025, but the token has since traded sideways in the range of $0.028 to $0.031. That range now defines the short-term battle zone.
Right now, KAS is trading just under $0.03. The market is no longer falling aggressively, but it also hasn’t broken structure. It looks more like stabilization after a drop rather than a confirmed reversal.
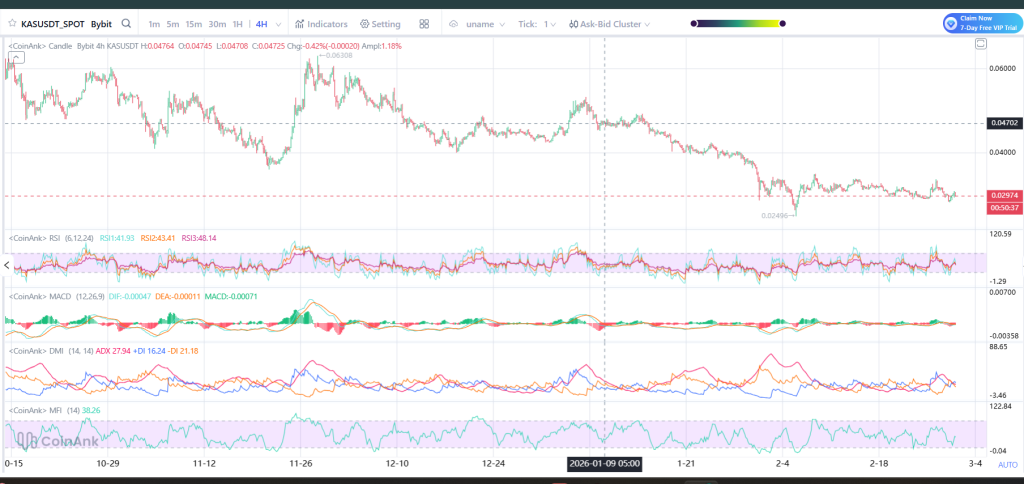
Source: Coinank
What the Indicators Are Saying
RSI is around the low 40s. That means the KAS price isn’t deeply oversold, but it’s not strong either. Buyers are not clearly in control.
MACD is flat with small bars, so there is no clear trend right now and no strong bullish signal.
DMI shows sellers slightly ahead, but not by much. The gap is small. MFI is also in the middle, which means money is flowing in and out evenly.
All of this points to one thing: the market is moving sideways, not making a big move yet.
_****Sei (SEI) Price at Historic Support as Experts Call It the “Final Gift”**
Kaspa Price Targets to Watch This Week
If KAS holds above $0.028, the next price to look at is $0.032. If it gets above $0.032, it can move toward $0.036–$0.038. After that, $0.047 is the next big level.
If the Kaspa price falls below $0.028, then $0.025 comes into view. If it drops under $0.025, the next area is around $0.022.
For now, KAS is trying to calm down after weeks of falling. The network news is positive, but the chart needs a move above $0.032 to look stronger. This week should show whether price starts climbing or tests lower levels again.
Disclaimer: The information on this page may come from third parties and does not represent the views or opinions of Gate. The content displayed on this page is for reference only and does not constitute any financial, investment, or legal advice. Gate does not guarantee the accuracy or completeness of the information and shall not be liable for any losses arising from the use of this information. Virtual asset investments carry high risks and are subject to significant price volatility. You may lose all of your invested principal. Please fully understand the relevant risks and make prudent decisions based on your own financial situation and risk tolerance. For details, please refer to
Disclaimer.
Articoli correlati
地緣政治大動盪!達利歐高呼「黃金才是唯一真神」、避險表現卻跑輸比特幣
在中東地緣政治緊張局勢升溫之際,橋水創辦人達利歐對比特幣質疑並重申黃金為避險首選。儘管如此,金價應聲下跌,而比特幣僅微幅修正,顯示兩者之間的關聯正在減弱。達利歐懷疑比特幣的透明度及未來風險,但他仍保留少量比特幣配置以求資產多樣化。
区块客53m fa
Sự quan tâm đến altcoin hạ nhiệt: Liệu Ethereum có thể kích hoạt mùa altcoin mới?
Thị trường đang buộc nhà đầu tư đưa quản trị rủi ro trở lại vị trí trung tâm.
Xét trên phương diện kỹ thuật, dòng tiền chảy vào trong tuần qua đã đẩy
TapChiBitcoin55m fa
Aster Price Nears $0.79 Breakout as Reversal Pattern Strengthens
Key Insights
Aster price structure shows an inverse head and shoulders pattern forming beneath $0.79 resistance, signaling growing buying pressure and possible trend reversal ahead.
Repeated tests of the $0.79 neckline suggest weakening selling pressure as buyers steadily absorb supply
CryptoFrontNews3h fa
Giá HYPE có thể tăng mạnh bất chấp đợt Short squeeze trị giá 2,8 triệu đô la sắp tới
The recent price movements of Hyperliquid (HYPE) are characterized by stagnation around 30 USD. A symmetrical triangle pattern indicates potential for a breakout in either direction, but market sentiment is cautious. Short squeeze risks may boost prices, while weak market flow and deteriorating demand pose challenges. The token could face significant support levels if it dips below 30 USD. An improved market sentiment could lead to a breakout above 33 USD, sparking recovery momentum.
TapChiBitcoin3h fa
Ethereum Price Holds Key Support: Is $2,200 the Next Test for ETH?
March 6, 2026 7:15 pm EST
TheCoinRepublic5h fa
Cardano Price Trends: Bulls Eye Opportunity as Indicator Flashes Green
ADA: Trading near $0.27, facing resistance at $0.28 and support at $0.26.
Technical Indicators: RSI and MACD show weak momentum, signaling short-term consolidation and cautious trading.
Macro Outlook: Rising PMI and historical patterns suggest potential bullish rebound if resistance
CryptoNewsLand6h fa