Key Takeaways
-
SAND price is showing early signs of stabilization after recent downside pressure.
-
Buyers appear to be defending a key support zone, hinting at a potential short-term rebound.
-
A breakout above nearby resistance could open the door for a stronger recovery move.
Gaming-focused crypto tokens are back in the spotlight after Axie Infinity (AXS) posted a sharp rally of over 16% in a single day and more than 246% over the past month, reigniting optimism around the gaming narrative. Riding this renewed momentum, Sandbox (SAND) has also stepped into focus, climbing nearly 45% as overall market sentiment turns constructive.
Beyond the recent price bounce, the technical structure on the chart is starting to tell a bigger story, hinting that SAND may be setting up for a bullish continuation move.
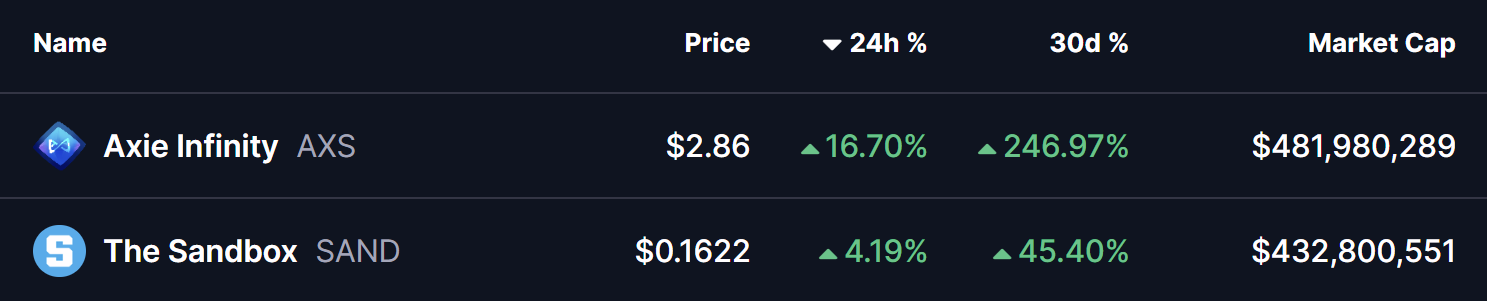
Source: Coinmarketcap
Descending Broadening Wedge Pattern in Play
On the daily timeframe, SAND is trading within a descending broadening wedge — a bullish reversal pattern that often develops during corrective phases before a trend shift. This structure reflects increasing volatility, with price gradually compressing while buyers quietly regain control.
During the latest pullback, SAND successfully retested the lower boundary of the wedge near the $0.11 zone, an area that has repeatedly acted as strong demand. Buyers stepped in aggressively at this level, triggering a rebound that pushed price toward $0.1711, placing SAND right near the wedge’s upper resistance trendline.
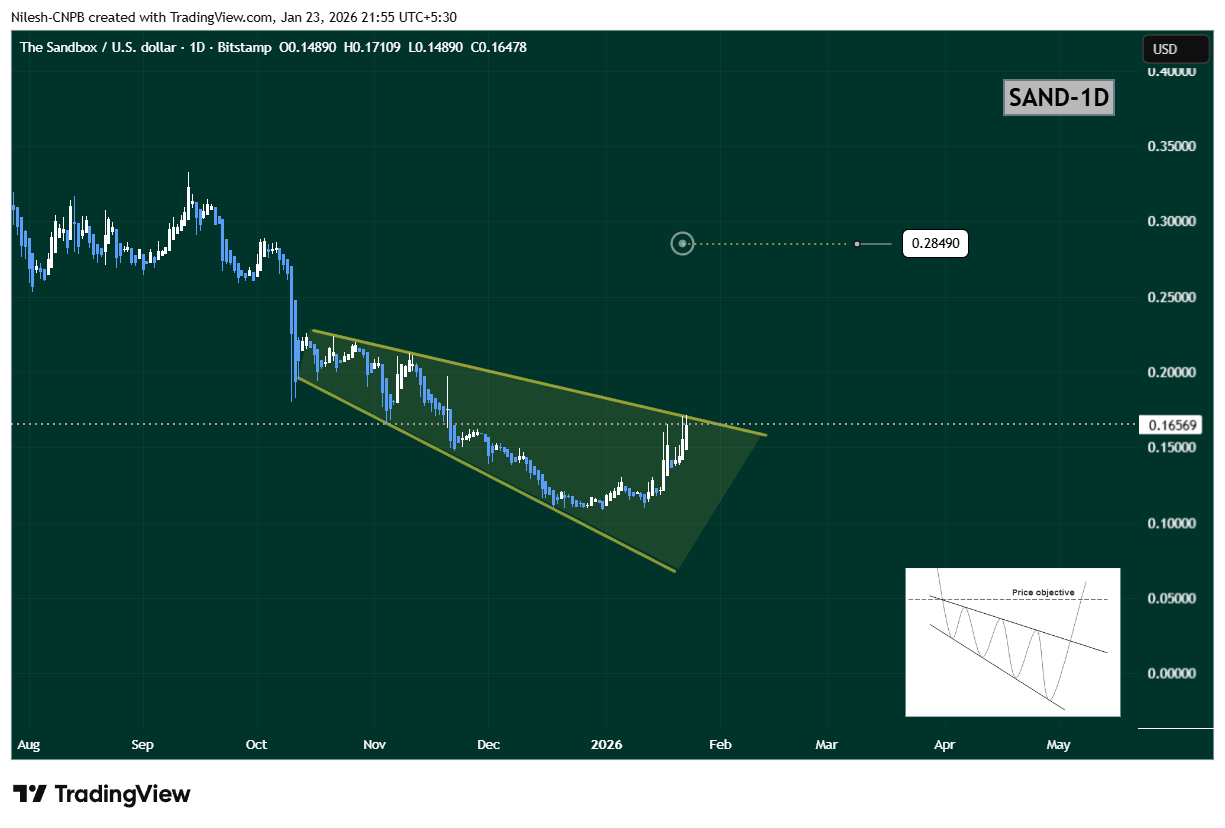
Sandbox (SAND) Daily Chart/Coinsprobe (Source: Tradingview)
The steady rise toward this upper boundary suggests growing bullish momentum and increasing breakout pressure.
What’s Next for SAND?
If buyers manage to push SAND above the upper wedge resistance near $0.1711, it would confirm a bullish breakout from the pattern. In that scenario, the chart opens the door for a move toward the $0.2849 target, which aligns with the measured move of the wedge and represents roughly 73% upside from current levels.
However, if price faces rejection at resistance, SAND could continue consolidating within the wedge structure. In that case, the $0.13–$0.14 region will act as an important short-term support zone to watch.
Bottom Line
SAND’s overall technical structure remains constructive. With a bullish descending broadening wedge in play, buyers defending key support, and gaming tokens gaining renewed attention, Sandbox appears to be positioning for a potential breakout. A confirmed move above resistance could mark the beginning of a stronger upside phase in the sessions ahead.
Disclaimer: The views and analysis presented in this article are for informational purposes only and reflect the author’s perspective, not financial advice. Technical patterns and indicators discussed are subject to market volatility and may or may not yield the anticipated results. Investors are advised to exercise caution, conduct independent research, and make decisions aligned with their individual risk tolerance.
About Author: Nilesh Hembade is the Founder and Lead Author of Coinsprobe, with over 5 years of experience in the cryptocurrency and blockchain industry. Since launching Coinsprobe in 2023, he has been providing daily, research-driven insights through in-depth market analysis, on-chain data, and technical research.
Disclaimer: The information on this page may come from third parties and does not represent the views or opinions of Gate. The content displayed on this page is for reference only and does not constitute any financial, investment, or legal advice. Gate does not guarantee the accuracy or completeness of the information and shall not be liable for any losses arising from the use of this information. Virtual asset investments carry high risks and are subject to significant price volatility. You may lose all of your invested principal. Please fully understand the relevant risks and make prudent decisions based on your own financial situation and risk tolerance. For details, please refer to
Disclaimer.
Articoli correlati
比特幣力守 7 萬美元!鏈上驚見「集體拋售潮」,散戶成最大賣壓來源
在中東地緣政治緊張影響下,比特幣遭遇廣泛拋售,散戶持有者尤為明顯。根據Glassnode數據,目前市場賣壓沉重,累積趨勢分數降至0.04,顯示散戶和中小型投資者正在大量減持,儘管如此,比特幣的抗跌表現仍讓市場觀察者感到驚訝。
区块客15m fa
英伟达GTC重磅发布后股价走弱:AI芯片与万亿预期为何未能提振市场?
尽管NVIDIA在GTC大会上发布了重要的AI和游戏技术,股价却未能持续上涨,分析认为这是由于市场对利好消息的兑现行为。同时,投资者关注AI投入的实际盈利转化及云计算支出的可持续性,导致股价走势谨慎。NVIDIA的行业领导地位依旧,但市场对估值与增长的匹配性更加审慎。
GateNews22m fa
比特币突破7.5万美元:资金回流与供应收紧共振,8万美元概率升至56%
比特币在亚洲早盘强势上涨,突破75,000美元,创下新高,连续第八个交易日上涨,显示市场情绪修复。交易所流入量下降和巨鲸交易活跃加剧上涨逻辑。资金流向由黄金转向比特币,但宏观不确定性依然存在。75,000美元成为关键支撑,未来走势面临考验。
GateNews33m fa
为何AI交易机器人难获认可?机构优势与责任风险揭示加密交易真相
市场上虽然出现了AI交易机器人获利的案例,但主流科技公司尚未正式参与,主要因责任风险和市场结构的限制。虽然部分交易员利用AI模型获利,但普遍的同质化和策略易复制使散户难以维持长久优势。随着技术进步,依赖通用AI盈利的难度在时上升。
GateNews35m fa
Solana Price Rejected at $90 as ABC Correction Targets Lower Support
Key Insights
Solana price rejected the $90 resistance zone as sellers defended the range high, increasing the probability of a corrective market phase.
The current structure suggests an ABC correction where the recent rally may represent the B leg before potential downside continuation
CryptoFrontNews37m fa
XRP Ledger Activity Surges as Price Holds Near Key Resistance
Key Insights
XRP Ledger processed over 2.5 million transactions in 24 hours, reflecting rising network engagement while the asset price remained stable near resistance.
XRP price holds near $1.41 while forming higher lows, indicating buyers continue supporting the asset despite repeated resi
CryptoFrontNews40m fa
