
Key Takeaways
-
SAND price is showing early signs of stabilization after recent downside pressure.
-
Buyers appear to be defending a key support zone, hinting at a potential short-term rebound.
-
A breakout above nearby resistance could open the door for a stronger recovery move.
Gaming-focused crypto tokens are back in the spotlight after Axie Infinity (AXS) posted a sharp rally of over 16% in a single day and more than 246% over the past month, reigniting optimism around the gaming narrative. Riding this renewed momentum, Sandbox (SAND) has also stepped into focus, climbing nearly 45% as overall market sentiment turns constructive.
Beyond the recent price bounce, the technical structure on the chart is starting to tell a bigger story, hinting that SAND may be setting up for a bullish continuation move.
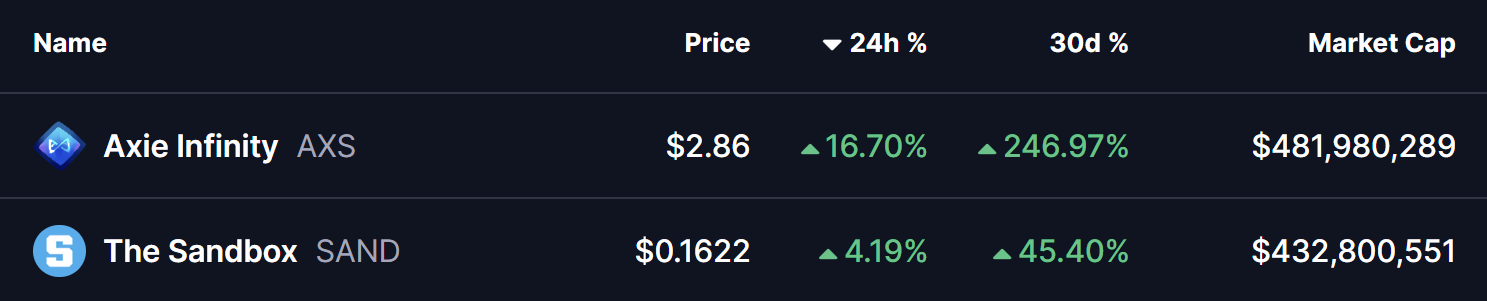
Source: Coinmarketcap
Descending Broadening Wedge Pattern in Play
On the daily timeframe, SAND is trading within a descending broadening wedge — a bullish reversal pattern that often develops during corrective phases before a trend shift. This structure reflects increasing volatility, with price gradually compressing while buyers quietly regain control.
During the latest pullback, SAND successfully retested the lower boundary of the wedge near the $0.11 zone, an area that has repeatedly acted as strong demand. Buyers stepped in aggressively at this level, triggering a rebound that pushed price toward $0.1711, placing SAND right near the wedge’s upper resistance trendline.
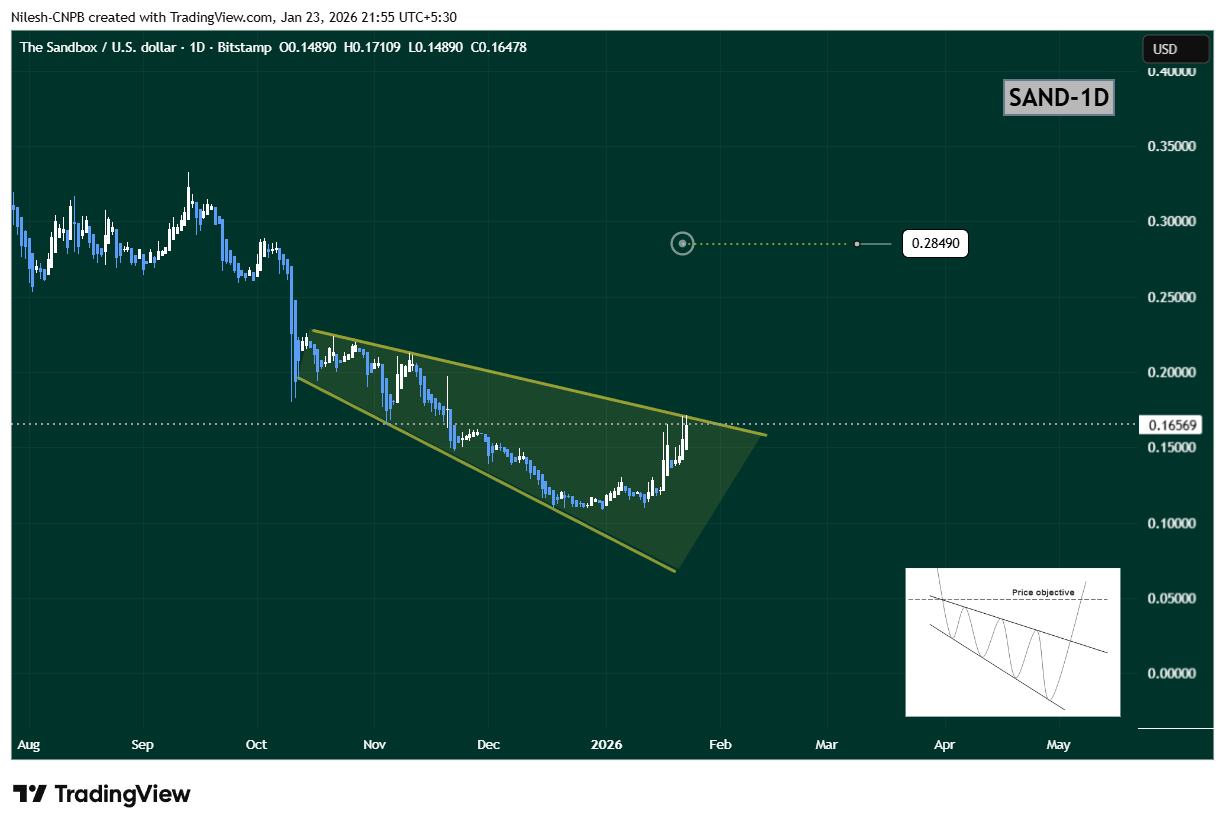
Sandbox (SAND) Daily Chart/Coinsprobe (Source: Tradingview)
The steady rise toward this upper boundary suggests growing bullish momentum and increasing breakout pressure.
What’s Next for SAND?
If buyers manage to push SAND above the upper wedge resistance near $0.1711, it would confirm a bullish breakout from the pattern. In that scenario, the chart opens the door for a move toward the $0.2849 target, which aligns with the measured move of the wedge and represents roughly 73% upside from current levels.
However, if price faces rejection at resistance, SAND could continue consolidating within the wedge structure. In that case, the $0.13–$0.14 region will act as an important short-term support zone to watch.
Bottom Line
SAND’s overall technical structure remains constructive. With a bullish descending broadening wedge in play, buyers defending key support, and gaming tokens gaining renewed attention, Sandbox appears to be positioning for a potential breakout. A confirmed move above resistance could mark the beginning of a stronger upside phase in the sessions ahead.
Disclaimer: The views and analysis presented in this article are for informational purposes only and reflect the author’s perspective, not financial advice. Technical patterns and indicators discussed are subject to market volatility and may or may not yield the anticipated results. Investors are advised to exercise caution, conduct independent research, and make decisions aligned with their individual risk tolerance.
About Author: Nilesh Hembade is the Founder and Lead Author of Coinsprobe, with over 5 years of experience in the cryptocurrency and blockchain industry. Since launching Coinsprobe in 2023, he has been providing daily, research-driven insights through in-depth market analysis, on-chain data, and technical research.
Disclaimer: The information on this page may come from third parties and does not represent the views or opinions of Gate. The content displayed on this page is for reference only and does not constitute any financial, investment, or legal advice. Gate does not guarantee the accuracy or completeness of the information and shall not be liable for any losses arising from the use of this information. Virtual asset investments carry high risks and are subject to significant price volatility. You may lose all of your invested principal. Please fully understand the relevant risks and make prudent decisions based on your own financial situation and risk tolerance. For details, please refer to
Disclaimer.
Articoli correlati
Crypto Market Update – River and DeXe Lead Gains As Political Memecoins Stir Volatility
The crypto market has continued to undergo rapid changes and temporary spurts in specific sectors than many other markets during its most recent period of consolidation. The “Gainers” chart on CoinMarketCap is often reviewed for trends that correlate with major cryptocurrency assets like Bitcoin and
BlockChainReporter13m fa
比特幣力守 7 萬美元!鏈上驚見「集體拋售潮」,散戶成最大賣壓來源
在中東地緣政治緊張的背景下,比特幣遭遇全面拋售,幾乎所有持幣者都轉向淨賣出,以散戶最為明顯。根據Glassnode數據,累積趨勢分數降至0.04,顯示市場賣壓沉重。小額持幣者及中型投資人拋售強度明顯,巨鯨大戶雖然減持,但力度較小。儘管數據慘淡,比特幣仍展現抗跌能力。
区块客46m fa
Shiba Inu Surges 5% as Short Squeeze Drives SHIB Momentum
SHIB rebounded 5% to $0.00000572, reversing a week of losses.
Short sellers faced $38,680 in liquidations, fueling a strong momentum shift.
Technical indicators suggest rising pressure, with resistance at $0.00000587 and support at $0.00000526.
Shiba Inu staged a sharp rebound on
CryptoNewsLand1h fa
持有 10 至 1 万枚 BTC 的巨鲸增持,持仓占比升至 68.17%
Santiment报告显示,持有10至1万枚比特币的投资者增加,现控制68.17%的供应量。比特币相对于标普500表现强劲,出现积极反转迹象。标普500下跌2.2%,比特币上涨2.4%。
GateNews2h fa
SHIB Derivatives See 1,549% Jump in Netflows: Is Short Squeeze Brewing? - U.Today
Shiba Inu (SHIB) experienced a 1,549% increase in futures netflows as traders adjusted their positions, with inflows surpassing outflows. Despite a recent price drop, positive on-chain indicators suggest potential for a market rebound if buyers return.
UToday3h fa
鏈上熱到爆、以太幣卻漲不動?專家揭「致命死穴」:恐下探 1,500 美元
CryptoQuant 報告指出,以太坊面臨「採用悖論」,雖然網路活躍度創新高,但幣價卻下滑。若熊市持續,到第三季末以太幣可能跌至 1,500 美元。智能合約活躍度上升與以太幣價格脫鉤,交易所流入量更能反映價格動態。投資需求疲軟,資金持續流失是主要隱憂。
区块客3h fa