
Key Takeaways
-
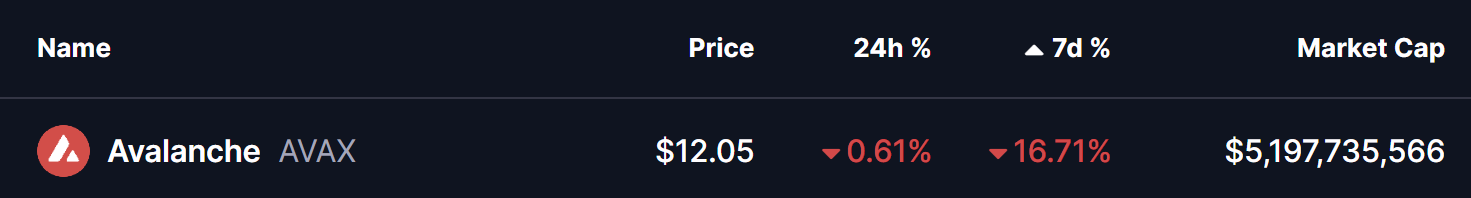
Avalanche (AVAX) has dropped over 16% in the past week, reflecting broader market weakness.
-
The 4H chart shows a Bullish Shark harmonic pattern, often associated with trend reversals.
-
Price is currently hovering near the $11.88 support, a critical zone for pattern validation.
-
If support holds, AVAX could rebound toward $13.39, with a higher upside target near $14.94.
-
A breakdown below the current support would invalidate the bullish setup and extend downside risk.
The cryptocurrency market remains under notable selling pressure as the total crypto market capitalization slipped 1.79% over the past 24 hours. This broader pullback triggered heightened volatility across digital assets, leading to more than $807 million in liquidations, with long positions bearing the brunt of the losses.
This wave of downside pressure has spilled into major altcoins, including Avalanche (AVAX). The token is trading slightly in the red and has dropped over 16% in the past seven days. However, beyond the red candles, AVAX’s chart is beginning to reveal a technical structure that suggests downside momentum may be weakening — and a rebound could be forming.
Source: Coinmarketcap
Harmonic Pattern Hints at Potential Upside
On the 4-hour timeframe, AVAX appears to be completing a Bullish Shark harmonic pattern, a formation that often emerges near market lows when selling pressure becomes exhausted. This pattern typically signals a potential trend reversal once its final leg forms within a defined demand zone.
The structure began with the initial O–X impulse around the $12.22 area, followed by a sharp rally that peaked near $14.83 at point X. Price then retraced aggressively toward point A before making another push higher to form point B near $14.94. That move, however, failed to sustain, triggering the current corrective leg.
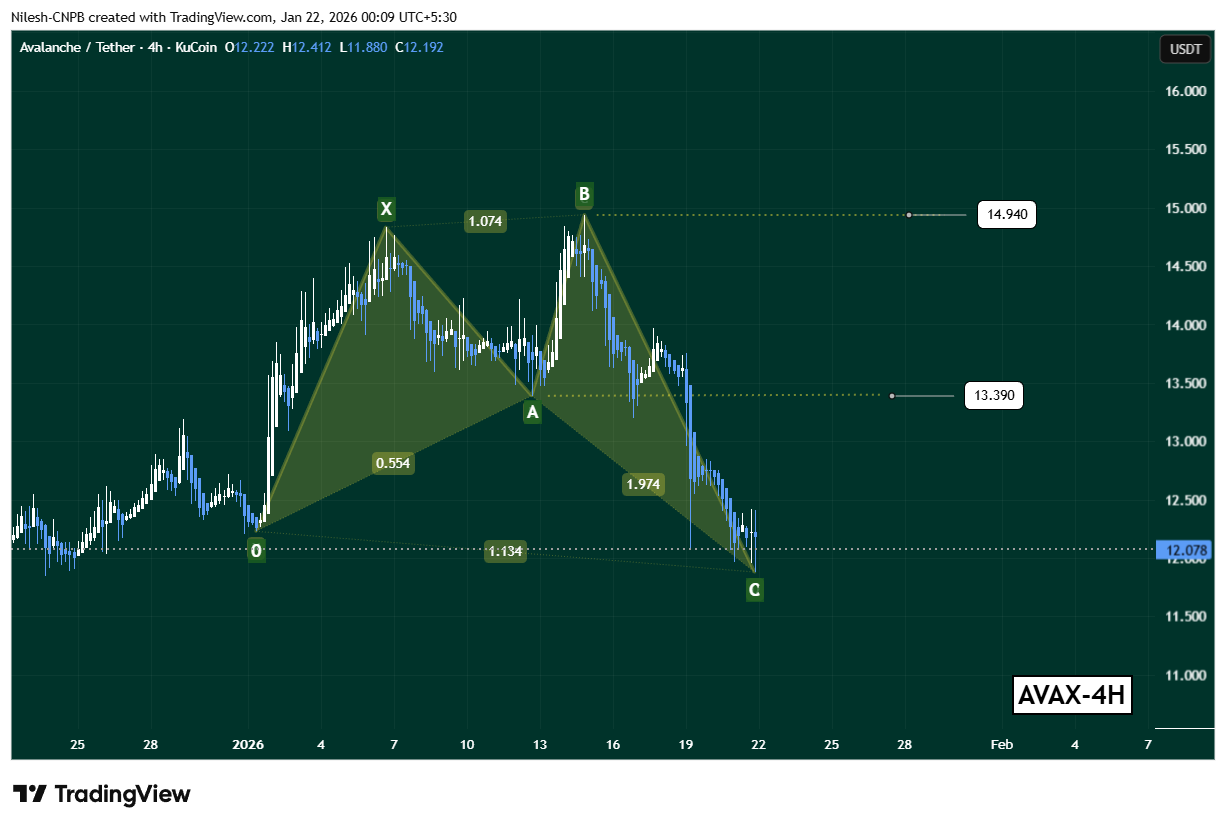
Avalanche (AVAX) 4H Chart/Coinsprobe (Source: Tradingview)
AVAX has since slid steadily lower, with price now hovering near $11.88, a level that could represent the C-point completion of the Shark pattern. This zone is technically important, as it’s where buyers often step in if the pattern is to play out bullishly.
What’s Next for AVAX?
If this harmonic structure continues to unfold as expected, AVAX could be positioning for a rebound from current levels. The first key upside level to watch sits around $13.39, which aligns closely with the prior A-point of the formation and serves as a near-term recovery target.
A stronger bullish follow-through could eventually bring the $14.94 region back into focus — the B-leg high and a significant resistance zone where sellers previously stepped in.
That said, the bullish outlook remains conditional. A sustained breakdown below the $11.88 support zone would invalidate the Shark pattern and shift momentum back in favor of the bears, opening the door for further downside continuation.
Bottom Line
AVAX may still be under pressure, but the emerging Bullish Shark harmonic pattern suggests selling momentum could be nearing exhaustion. As long as price holds above the current support zone, the setup favors a short-term rebound toward $13.39 and potentially $14.94. However, confirmation will depend on buyer response at current levels — making the next few sessions critical for Avalanche’s near-term direction.
Disclaimer: The views and analysis presented in this article are for informational purposes only and reflect the author’s perspective, not financial advice. Technical patterns and indicators discussed are subject to market volatility and may or may not yield the anticipated results. Investors are advised to exercise caution, conduct independent research, and make decisions aligned with their individual risk tolerance.
About Author: Nilesh Hembade is the Founder and Lead Author of Coinsprobe, with over 5 years of experience in the cryptocurrency and blockchain industry. Since launching Coinsprobe in 2023, he has been providing daily, research-driven insights through in-depth market analysis, on-chain data, and technical research.
Disclaimer: The information on this page may come from third parties and does not represent the views or opinions of Gate. The content displayed on this page is for reference only and does not constitute any financial, investment, or legal advice. Gate does not guarantee the accuracy or completeness of the information and shall not be liable for any losses arising from the use of this information. Virtual asset investments carry high risks and are subject to significant price volatility. You may lose all of your invested principal. Please fully understand the relevant risks and make prudent decisions based on your own financial situation and risk tolerance. For details, please refer to
Disclaimer.
Articoli correlati
Bitcoin Enters Relief Phase of the Bear Market, Crypto Analyst Reveals Bottom Time Frame
Bitcoin enters relief phase of the bear market.
Crypto analyst reveals bottom price formation time frame.
Can the price of BTC hit one last ATH before the bottom forms?
The price of Bitcoin (BTC), the pioneer crypto asset, continues to trade under the $70,000 price range and is
CryptoNewsLand21m fa
XRP 空头压力巨大,30 亿美元清算在即,多头突破能否引发暴涨?
XRP近期价格波动在1.339至1.35美元区间,受美伊停火谈判提振,单日上涨约3%。关键阻力区为1.34至1.355美元,分析师指出需突破此区方能关注更高目标。下行支撑位在1.31至1.32美元,若跌破则可能重返盘整区间。市场正等待美国经济数据,短期动态值得关注。
GateNews28m fa
以太坊价格新闻:伊朗危机引发ETH双顶崩盘警报,2000美元支撑位能否守住?
受伊朗局势影响,以太坊价格下跌约3.4%,跌破2100美元。市场担忧地缘政治冲突升级,技术指标显现空头趋势。短期内可能承压,长期走势仍取决于局势发展。投资者需关注技术面与地缘政治动态。
GateNews39m fa
2026年Q1加密项目经历倒闭潮:比特币ETF与稳定币引导资金流向优质平台
2026年第一季度,加密货币行业经历项目关闭潮,超80个项目停运,反映市场模式变迁。分析师Ignas认为,这是“轻松赚钱时代”的结束,未来需要专业与可持续经济模型。资金向稳健产品集中,投机项目面临挑战。
GateNews43m fa
Bitcoin Enters Relief Phase of the Bear Market, Crypto Analyst Reveals Bottom Time Frame
Bitcoin enters relief phase of the bear market.
Crypto analyst reveals bottom price formation time frame.
Can the price of BTC hit one last ATH before the bottom forms?
The price of Bitcoin (BTC), the pioneer crypto asset, continues to trade under the $70,000 price range and is
CryptoNewsLand1h fa
特朗普对伊朗最后通牒临近,比特币价格波动于68,000美元附近
比特币交易员关注美国总统特朗普对伊朗的最后通牒,市场情绪紧张,比特币价格在68,000美元附近波动。尽管经历抛售后迅速回升,投资者需关注地缘政治局势变化及其对比特币的影响。
GateNews1h fa
