
Key Takeaways
-
Monero (XMR) hit a new all-time high near $799, before pulling back to the $610 range.
-
The $282M theft swap acted as a short-term catalyst, not the primary cause of the rally.
-
The chart shows a long-term rounded bottom and confirmed breakout, forming well before the theft news.
In the cryptocurrency market today, Monero (XMR) has been firmly in the spotlight following its explosive price action in early January 2026. The privacy-focused asset smashed through its previous all-time high, surging to nearly $799 before pulling back toward the $626 zone, marking a roughly 7% correction as of January 17, 2026.
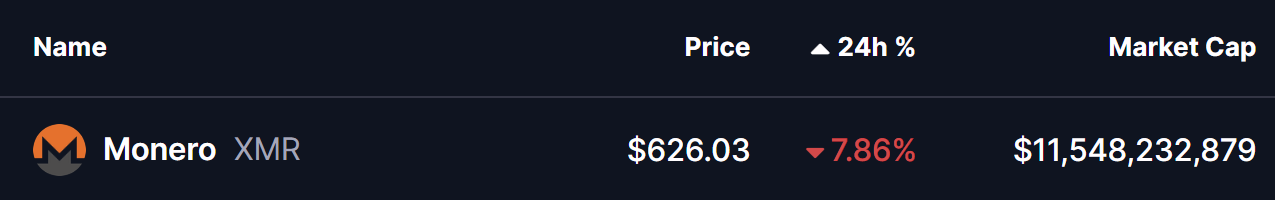
Source: Coinmarketcap
Much of the initial attention centered on a report by blockchain investigator ZachXBT, who linked the rally to a massive $282 million theft on January 10. According to the findings, stolen Bitcoin (BTC) and Litecoin (LTC) were rapidly swapped into XMR via instant exchanges, fueling speculation that the surge was driven purely by laundering activity.
That narrative spread quickly across social media—painting Monero’s rally as artificial and event-driven. But when we step back and analyze the technical structure, the chart tells a very different story.
The Theft Swap: A Catalyst, Not the Cause
There’s no denying the scale of the incident. The victim reportedly lost 1,459 BTC and 2.05 million LTC in a sophisticated hardware wallet social-engineering attack. Portions of those assets were converted into XMR to exploit its privacy features—ring signatures, stealth addresses, and confidential transactions—creating a burst of short-term buy pressure.
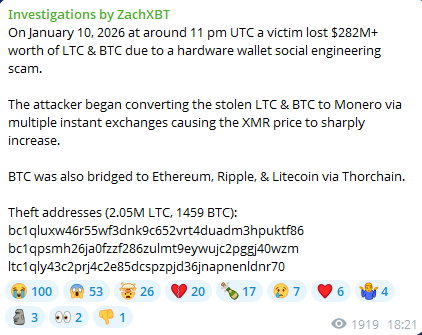
Source: @amit0xic (X)
However, context matters.
Even at $282 million, the theft represents only a small fraction of Monero’s total market expansion during the rally. XMR’s market capitalization grew from roughly $8 billion to over $12 billion, a move far too large to be explained by a single conversion event.
If the pump were purely theft-driven, we would expect:
-
A sharp, isolated spike
-
Weak follow-through
-
Immediate distribution
Instead, price structure shows continuity, retests, and acceptance above key levels—hallmarks of a genuine breakout.
What the XMR Chart Really Shows
Looking at the 1D XMR/USD chart, the bullish case becomes clear.
Throughout most of 2025, Monero carved out a rounded bottom—a classic long-term reversal pattern. Price bottomed near $235, then gradually curved higher over several months, signaling accumulation rather than speculation.
Key Technical Highlights:
-
Rounded Bottom Formation: Indicates prolonged accumulation and a shift in market sentiment
-
Breakout Zone: Price decisively broke above the $412–$420 resistance, followed by a clean retest
-
Local High: XMR pushed aggressively to $799.94, confirming momentum
-
Healthy Pullback: Price has since retraced toward $610, a previous breakout area
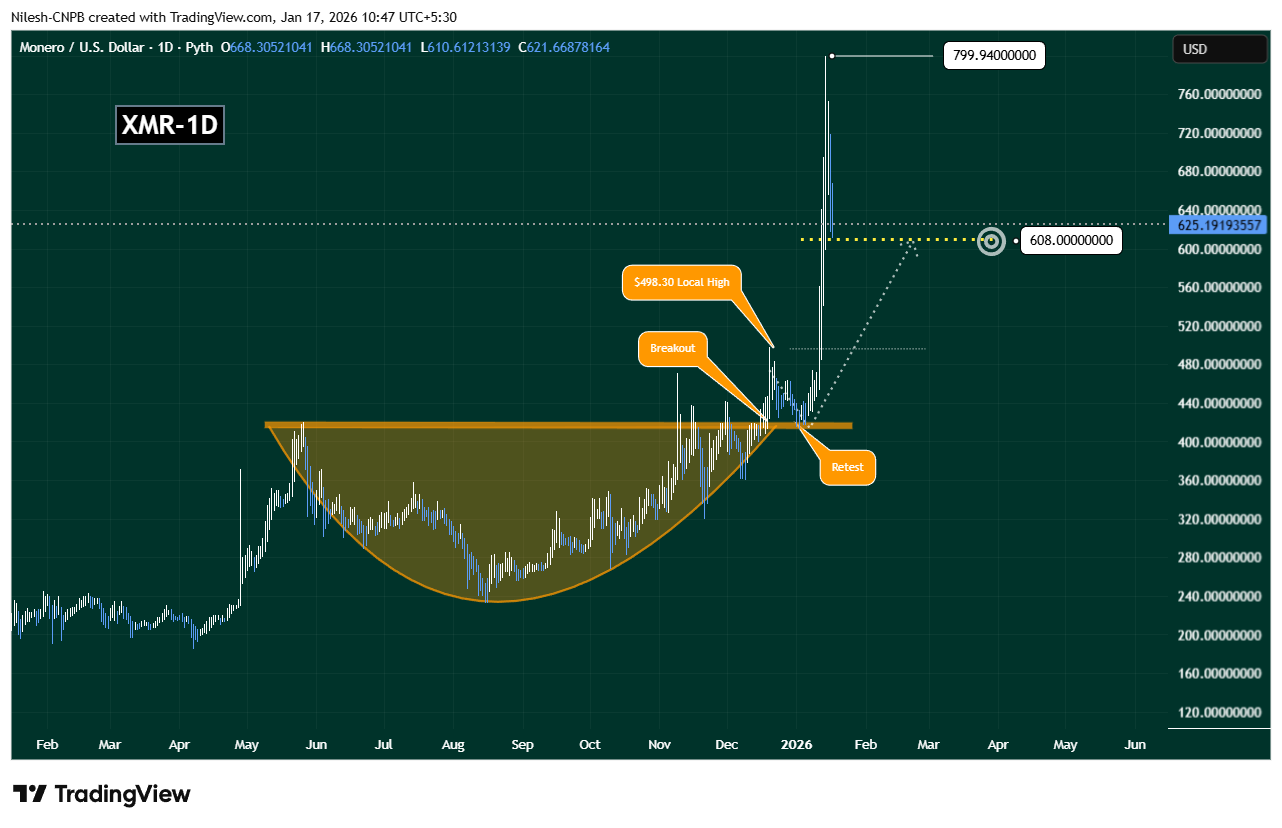
Monero (XMR) Daily Chart/Coinsprobe (Source: Tradingview)
This structure was already in place before the theft news broke. The timing suggests the swap acted as an accelerant, not the origin of the move.
In other words, the chart was already primed.
The Bigger Picture: A Privacy Coin Revival
Beyond technicals, Monero’s rally aligns with a broader renewed interest in privacy-focused assets. As regulatory oversight intensifies globally and financial surveillance expands, users are increasingly looking for alternatives that protect transactional freedom.
Unlike optional privacy solutions, Monero’s anonymity is default and enforced, making it uniquely positioned in a world moving toward stricter compliance and traceability.
This structural demand—combined with shrinking exchange availability and growing decentralized access—has quietly strengthened XMR’s long-term value proposition.
What’s Next for XMR?
From a technical perspective, $610 now stands out as a critical support zone. This level aligns with:
If XMR holds above this region, the bullish structure remains intact, opening the door for continuation once consolidation completes.
However, if $610 fails, the next major downside support sits near $498.30, the former local high before the final breakout leg.
Bottom Line
Despite widespread speculation, Monero’s rally is not simply the result of a $282M theft swap. The chart clearly shows a multi-month accumulation phase, a confirmed breakout, and a healthy post-rally correction—all signs of an organic market move.
The theft may have added fuel, but the fire was already burning.
As long as XMR maintains key structural levels, the broader trend remains constructive. Whether the next leg higher comes immediately or after consolidation, one thing is clear: this move was chart-driven, not scandal-driven.
**Frequently Asked Questions (FAQ)
**
Was Monero’s (XMR) recent pump caused by the $282M theft swap?
Not entirely. While the theft added short-term buying pressure, the chart shows XMR was already in a long-term bullish structure before the incident.
What technical pattern supported XMR’s rally?
XMR formed a rounded bottom throughout 2025, followed by a clean breakout above the $412–$420 resistance zone, signaling trend reversal and accumulation.
Is the current pullback bearish for Monero?
No. The pullback toward the $610 area appears to be a healthy retest of the breakout zone rather than a breakdown.
Disclaimer: The views and analysis presented in this article are for informational purposes only and reflect the author’s perspective, not financial advice. Technical patterns and indicators discussed are subject to market volatility and may or may not yield the anticipated results. Investors are advised to exercise caution, conduct independent research, and make decisions aligned with their individual risk tolerance.
About Author: Nilesh Hembade is the Founder and Lead Author of Coinsprobe, with over 5 years of experience in the cryptocurrency and blockchain industry. Since launching Coinsprobe in 2023, he has been providing daily, research-driven insights through in-depth market analysis, on-chain data, and technical research.
