
Key Takeaways
-
OriginTrail (TRAC) has surged around 12% in a single day, drawing renewed attention to the token.
-
TRAC has broken out from an ascending triangle near $0.46 on the daily chart, signaling growing bullish momentum.
-
Similar breakout structures in July and October 2025 previously led to strong rallies of 63% and 113%.
-
Holding the $0.44–$0.46 zone as support will be crucial to keep the bullish fractal setup intact.
-
If the pattern plays out, TRAC could attempt a move toward its long-term ascending resistance above $1.00.
OriginTrail, the decentralized knowledge graph protocol, is stepping back into the spotlight as its native token TRAC records a strong 12% daily surge. Beyond the price jump, the real signal is coming from the charts, where a familiar fractal breakout structure is starting to emerge on the daily timeframe, hinting that a larger upside move could be forming.
Source: Coinmarketcap
Fractal Breakout Hints at Potential Upside Move
On the daily chart, TRAC has confirmed a breakout from an ascending triangle pattern near the $0.46 level. This breakout is particularly important as price is now trading just above the 200-day moving average, a level that has historically acted as a major trend-defining zone for TRAC.
What makes this setup more compelling is its similarity to previous breakout phases. In late July 2025, a comparable structure resulted in a 63% upside move after price held above its breakout base. Later, in early October 2025, TRAC broke out from a right-angled descending broadening wedge pattern. That move was followed by a reclaim of the 200-day moving average and ultimately led to a powerful 113% rally.
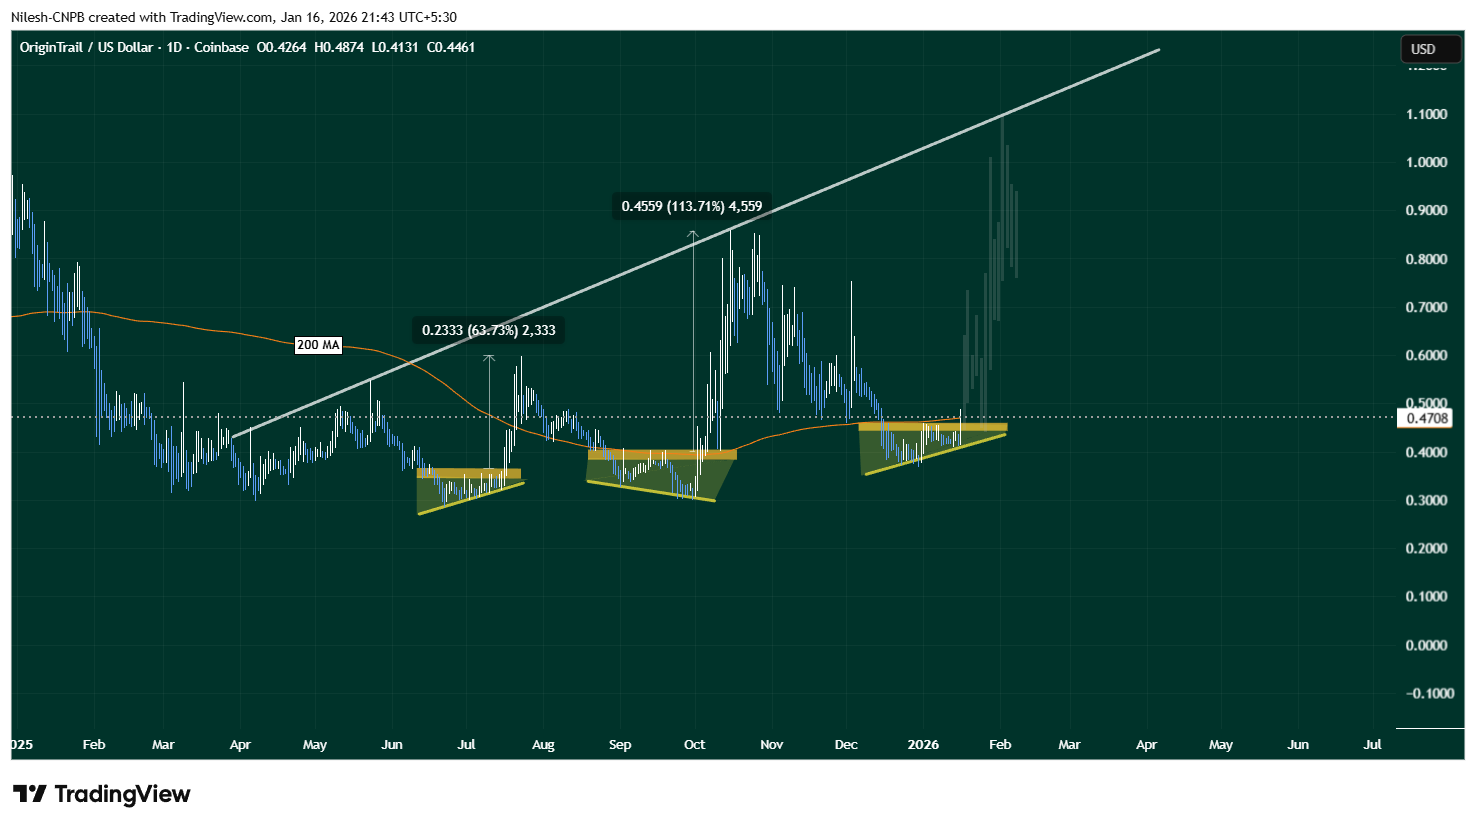
OriginTrail (TRAC) Daily Chart/Coinsprobe (Source: Tradingview)
The current setup shares key characteristics with those earlier moves. Price compression, a clean breakout, and interaction with the 200-day MA suggest that TRAC may once again be transitioning from consolidation into expansion.
What’s Next for TRAC?
If this fractal breakout plays out as expected, holding the $0.44–$0.46 zone as support will be crucial. A sustained hold above this range, along with continued strength above the 200-day moving average, could act as a launchpad for further upside.
In that scenario, TRAC may attempt a move toward its long-term ascending resistance trendline, which currently sits above the $1.00 level. A push toward that zone would align closely with the magnitude of prior fractal-driven rallies seen on the chart.
That said, fractal patterns are never guarantees. Broader market conditions, liquidity, and overall sentiment will continue to influence price action. A failure to hold the $0.44–$0.46 support zone or a rejection back below the 200-day moving average could invalidate the breakout and weaken the bullish fractal thesis.
Bottom Line
TRAC is showing early signs of another technically significant breakout, supported by historical fractal behavior and a reclaim of a key long-term moving average. If buyers can defend the current support zone, the chart suggests that OriginTrail may be positioning itself for a larger upside move in the weeks ahead.
Disclaimer: The views and analysis presented in this article are for informational purposes only and reflect the author’s perspective, not financial advice. Technical patterns and indicators discussed are subject to market volatility and may or may not yield the anticipated results. Investors are advised to exercise caution, conduct independent research, and make decisions aligned with their individual risk tolerance.
About Author: Nilesh Hembade is the Founder and Lead Author of Coinsprobe, with over 5 years of experience in the cryptocurrency and blockchain industry. Since launching Coinsprobe in 2023, he has been providing daily, research-driven insights through in-depth market analysis, on-chain data, and technical research.
Disclaimer: The information on this page may come from third parties and does not represent the views or opinions of Gate. The content displayed on this page is for reference only and does not constitute any financial, investment, or legal advice. Gate does not guarantee the accuracy or completeness of the information and shall not be liable for any losses arising from the use of this information. Virtual asset investments carry high risks and are subject to significant price volatility. You may lose all of your invested principal. Please fully understand the relevant risks and make prudent decisions based on your own financial situation and risk tolerance. For details, please refer to
Disclaimer.
Articoli correlati
NAV Price Surges 44.25%: Is a New Trend Emerging?
NAV coin recently surged by 44.25%, reaching $0.032715, amid increased trading activity and fluctuating market conditions. Analysts attribute this rally to rising on-chain activity and shifting sentiment toward altcoins, while traders monitor key price levels for future movements.
Coinfomania46m fa
Why TARA Just Skyrocketed 24.47% in 60 Minutes
TARA's price surged 24.47% to $0.000047 amid mixed signals in the crypto market and increased trading activity. Market conditions and macroeconomic factors are influencing investor sentiment, with traders closely monitoring key resistance and support levels.
Coinfomania47m fa
XRP Reclaims $1.40 Mark as Price Jumps 6%, Where Is Price Heading? - U.Today
XRP recently surpassed the $1.40 resistance level, driven by a 12.92% spike in trading volume to $2.63 billion. Renewed interest, notably due to a partnership with Mastercard, may help sustain upward momentum, with potential targets of $1.50 and $2. However, a drop below $1.39 could negate this breakout.
UToday1h fa
PI Jumps 16% After V20.2 Upgrade and AI Node Plans
Pi Network completed the V20.2 upgrade, ensuring node alignment and network stability for all operators.
AI node experiments tested decentralized computing, using spare node capacity to handle real AI tasks.
PI price jumped 16%, breaking resistance at $0.23, eyeing $0.28 as key target.
P
CryptoNewsLand2h fa
“刻舟求剑”式币价预测走红,玄学预言的实战逻辑与缺陷
作者:Frank,PANews
每当市场进入不上不下的迷茫阶段,就会有人试图用“刻舟求剑”式的历史回溯方法去预测下一段走势。这种情况下,人们往往能从这些理论和图表中看到历史总是在重演,并似乎自动将未来一段时间的行情走势与过去的某一段进行重叠验证。
这种重合似乎有着神奇的效果,并且也常常得到验证。有博主自称这种预测的准确率能到达75%~80%。
这种在社交媒体上屡屡爆红的“刻舟求剑”式价格预测,究竟是在帮助市场识别阶段,还是在把噪音包装成预言?
从“滴答分形”到“历史押韵”
关于2025年10月市场顶点预测的巅峰操作是名为CryptoBullet的分析师,他所创建的一种名为“tick
PANews3h fa