
**Date: **Wed, Jan 07, 2026 | 06:20 AM GMT
The broader cryptocurrency market continues to show strong New Year momentum, with Bitcoin (BTC) up around 4% and Ethereum (ETH) gaining over 9% on a weekly basis. This improving sentiment is gradually spilling over into major altcoins — including the DePIN-focused token Akash Network (AKT).
AKT has already posted an impressive 20% weekly gain. While this short-term strength has caught traders’ attention, the more important development is unfolding on the higher-timeframe chart. Recent price action suggests a meaningful shift in market structure, hinting that AKT may be transitioning out of a prolonged corrective phase and into the early stages of a bullish continuation.
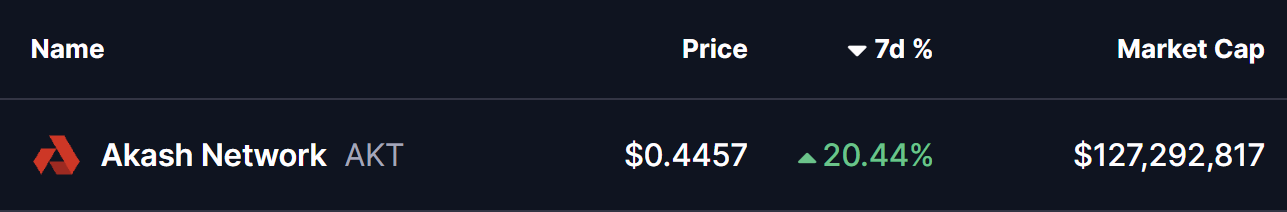
Source: Coinmarketcap
Falling Wedge and Rounding Bottom in Play
On the daily chart, AKT has been trading within a broader falling wedge — a structure that often precedes bullish reversals as selling pressure gradually weakens. Within this larger wedge, price action is also shaping a developing rounding bottom pattern, reflecting steady accumulation and seller exhaustion.
The formation began after AKT faced strong rejection near the $0.5441 resistance zone in late November. That rejection triggered a sharp sell-off, pushing price lower toward the $0.3465 region. However, bears failed to extend losses beyond this area. Instead, demand stepped in, downside momentum slowed, and price began to stabilize.
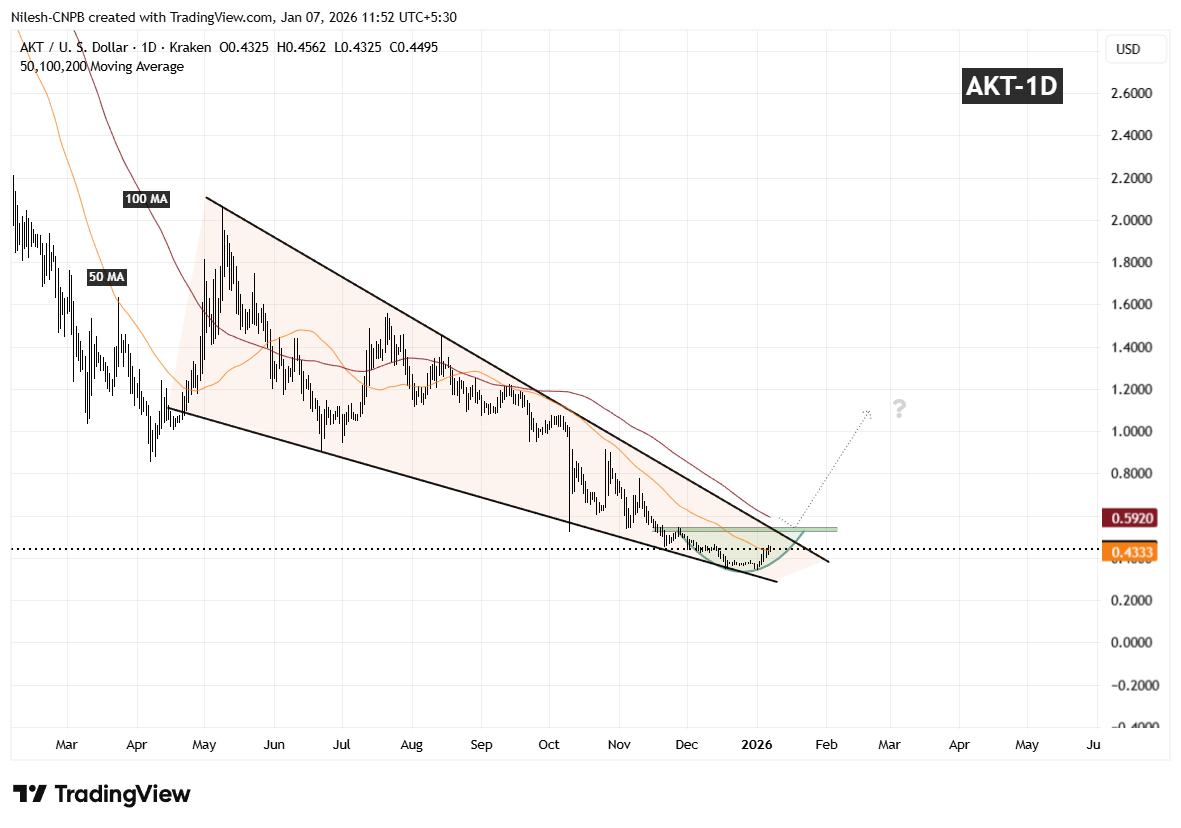
Akash Network (AKT) Daily Chart/Coinsprobe (Source: Tradingview)
Over the following weeks, volatility compressed and AKT started to curl higher in a smooth, rounded fashion — closely matching the textbook behavior of a rounding bottom. Importantly, the recent rebound has pushed price back above the 50-day moving average around $0.4333, a level that had previously acted as resistance and is now beginning to flip into support.
What’s Next for AKT?
If AKT can continue to hold above the 50-day moving average, this area may act as a solid base for further upside attempts. From here, attention shifts toward the descending resistance trendline of the falling wedge, which aligns closely with the $0.5441 resistance zone.
A clean and decisive breakout above this confluence area, followed by sustained acceptance, would confirm a broader bullish expansion phase and mark a clear trend reversal from the prior downtrend. Such a move would likely attract renewed momentum participation as the market recognizes the structural shift.
Until that breakout occurs, the pattern remains in development. Short-term consolidation or shallow pullbacks are still possible as price digests recent gains. However, as long as AKT continues to print higher lows above the established base, the broader technical structure remains constructive.
Overall, the chart suggests AKT is approaching a critical inflection point — one that could determine whether this recovery evolves into a sustained bullish trend as 2026 progresses.
Disclaimer: The views and analysis presented in this article are for informational purposes only and reflect the author’s perspective, not financial advice. Technical patterns and indicators discussed are subject to market volatility and may or may not yield the anticipated results. Investors are advised to exercise caution, conduct independent research, and make decisions aligned with their individual risk tolerance.
About Author: Nilesh Hembade is the Founder and Lead Author of Coinsprobe, with over 5 years of experience in the cryptocurrency and blockchain industry. Since launching Coinsprobe in 2023, he has been providing daily, research-driven insights through in-depth market analysis, on-chain data, and technical research.
Disclaimer: The information on this page may come from third parties and does not represent the views or opinions of Gate. The content displayed on this page is for reference only and does not constitute any financial, investment, or legal advice. Gate does not guarantee the accuracy or completeness of the information and shall not be liable for any losses arising from the use of this information. Virtual asset investments carry high risks and are subject to significant price volatility. You may lose all of your invested principal. Please fully understand the relevant risks and make prudent decisions based on your own financial situation and risk tolerance. For details, please refer to
Disclaimer.
Articoli correlati
BTC 若突破 7.3 万美元,主流 CEX 累计空单清算强度将达 8.34 亿美元
根据Coinglass数据,若比特币价格突破7.3万美元,将触发8.34亿美元的空单清算;若跌破6.9万美元,将引发9.4亿美元的多单清算。这显示了市场流动性波动的潜在影响。
GateNews2h fa
Ethereum Bottom In at $2,156, Says Tom Lee! Spike Soon?
Ethereum shows signs of stabilization with long-term holders increasing positions despite cautious institutional ETF outflows. This suggests a potential market bottom, though recovery may take time influenced by external factors.
Coinfomania3h fa
Quant tiến vào vùng cung quan trọng: Liệu đà tăng 24% hàng tuần của QNT có chững lại?
Quant (QNT) has shown strong recent performance, rising 4.91% in 24 hours and 24.14% over the week, contrasting with Bitcoin's drop. While a bullish trend is possible, signals indicate a cautious outlook, with key resistance levels to watch.
TapChiBitcoin4h fa
HODL Kings: Bitcoin Leads Diamond Hands Ranking
According to analysis shared by CEX.IO, long-term holding continues to be a defining strategy in the cryptocurrency market. The “diamond hands” metric measures the percentage of a digital asset’s supply that has remained inactive for extended periods, typically over one year. This indicator
Coinfomania4h fa
BNB Chain dẫn đầu lĩnh vực AI với 39,9% thị phần sao giá vẫn tụt?
BNB Chain is emerging as a leader in the AI agent ecosystem, holding 39.9% market share. However, its token BNB's price has not reflected this growth, remaining 25.9% below its previous peak, as market sentiment remains cautious.
TapChiBitcoin7h fa
