
Date: Fri, Dec 26, 2025 | 06:30 PM GMT
The broader cryptocurrency market has been navigating a period of choppy and uncertain price action over the past several weeks, a phase that began after the sharp market-wide sell-off on October 10. During that correction, Ethereum (ETH) dropped nearly 28% over the last 60 days, applying sustained pressure across the altcoin sector — including ether.fi (ETHFI).
ETHFI has mirrored this weakness, sliding more than 31% over the same period. However, despite the sharp downtrend, recent price behavior suggests selling pressure may be easing. The token is now trading near a historically significant demand zone, where buyers have repeatedly stepped in before — raising the possibility that ETHFI could be approaching an inflection point.
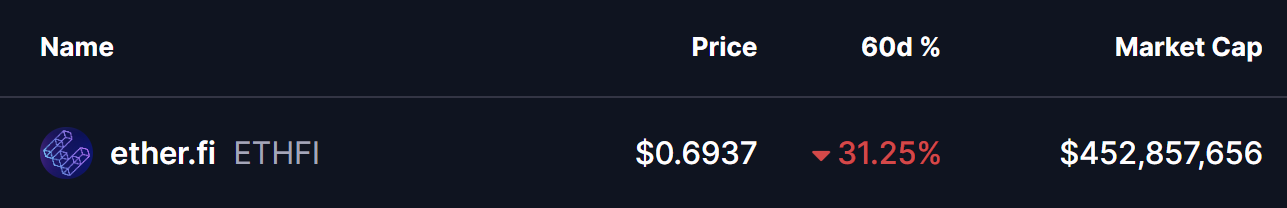
Source: Coinmarketcap
Double Bottom Pattern in Focus
On the daily timeframe, ETHFI appears to be forming a potential double-bottom structure — a classic reversal pattern that often signals exhaustion among sellers. The setup began after ETHFI was rejected from the $0.9233 resistance area, a move that triggered a sharp decline of nearly 28% and pushed price back toward the lower end of its range.
That sell-off dragged ETHFI into the $0.65 support zone, a level that has consistently acted as a strong demand area in the past. The chart now shows price revisiting this same region and stabilizing once again, suggesting buyers are actively defending it. The similarity between the first and second lows strengthens the case that a double-bottom base may be forming.
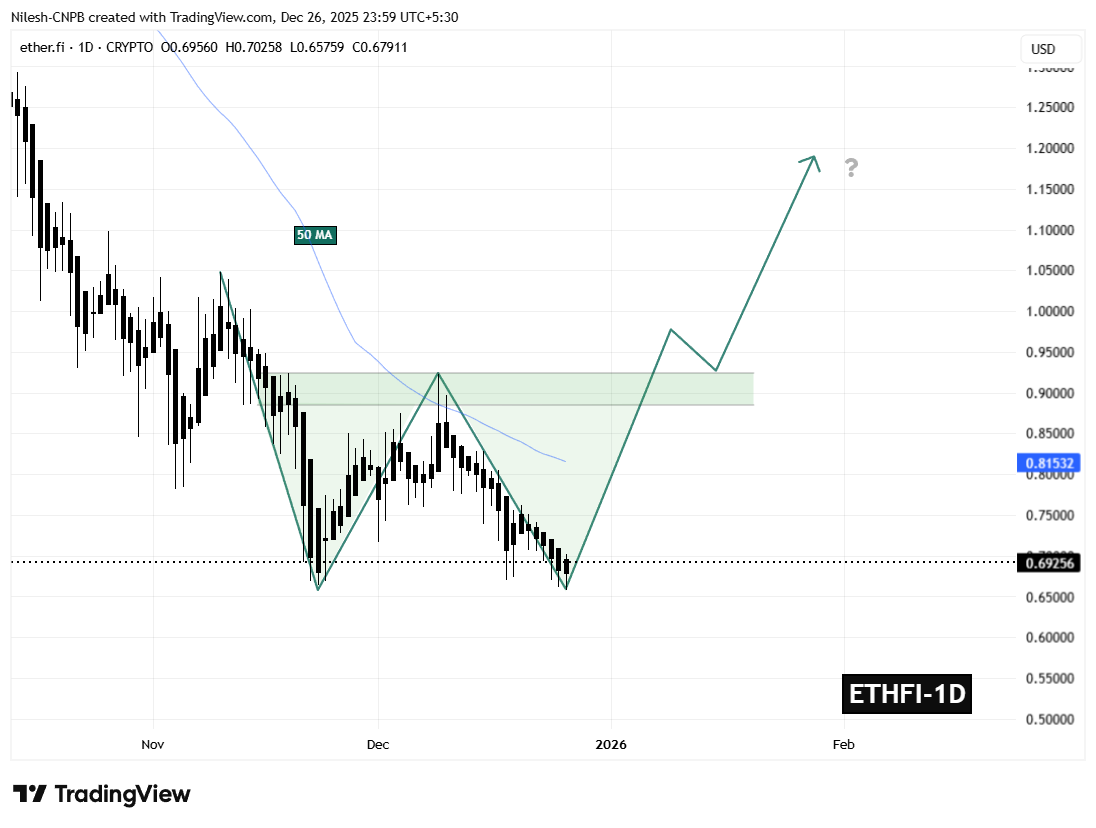
ETHFI Daily Chart/Coinsprobe (Source: Tradingview)
If this support continues to hold, the ongoing consolidation could mark the completion of the second bottom — a critical step in shifting momentum away from sellers and toward a potential trend reversal.
What’s Next for ETHFI?
The $0.65 support zone remains the most important level to monitor in the near term. As long as ETHFI holds above this area, the developing bullish structure remains valid and provides room for momentum to gradually rebuild.
On the upside, the first major challenge sits at the 50-day moving average near $0.8153. This level has repeatedly capped recovery attempts throughout the recent downtrend and now represents the initial test for buyers. A sustained move above this moving average would signal improving market structure and growing bullish confidence.
Beyond that, the $0.9233 neckline stands as the key confirmation level. A decisive breakout above this resistance would complete the double-bottom pattern and significantly strengthen the bullish outlook, potentially opening the door for a broader recovery move in the weeks ahead.
For now, ETHFI finds itself at a technically pivotal zone — one that could either reinforce the existing downtrend or mark the beginning of a meaningful rebound if buyers continue to defend support.
Disclaimer: The views and analysis presented in this article are for informational purposes only and reflect the author’s perspective, not financial advice. Technical patterns and indicators discussed are subject to market volatility and may or may not yield the anticipated results. Investors are advised to exercise caution, conduct independent research, and make decisions aligned with their individual risk tolerance.
Disclaimer: The information on this page may come from third parties and does not represent the views or opinions of Gate. The content displayed on this page is for reference only and does not constitute any financial, investment, or legal advice. Gate does not guarantee the accuracy or completeness of the information and shall not be liable for any losses arising from the use of this information. Virtual asset investments carry high risks and are subject to significant price volatility. You may lose all of your invested principal. Please fully understand the relevant risks and make prudent decisions based on your own financial situation and risk tolerance. For details, please refer to
Disclaimer.
Articoli correlati
Áp lực giảm giá của ADA gia tăng, nhưng dòng tiền từ cá voi hé lộ khả năng đảo chiều bất ngờ
Giá Cardano (ADA) đang chịu áp lực khi trượt xuống dưới mốc 0,26 USD vào thời điểm ghi nhận ngày thứ Bảy, gần như xóa sạch thành quả phục hồi đạt được từ đầu tuần. Các tín hiệu từ thị trường phái sinh và chỉ báo kỹ thuật đều nghiêng về xu hướng giảm, dù lực mua mạnh từ một số “cá voi” có thể đóng
TapChiBitcoin12m fa
Peter Schiff Drops a Truth Bomb on Bitcoin: Four Years Later and Still Below $69K
Peter Schiff, a long-time Bitcoin critic, highlights Bitcoin's stagnation below previous highs for over four years amid a market downturn. While he points to this as evidence of Bitcoin's decline, historically, Bitcoin has rebounded from similar situations, suggesting that betting against it could be risky.
CaptainAltcoin1h fa
XLM Gears Up for 14% Jump as Market Strength Returns
XLM surged 9% with strong volume, outperforming major cryptocurrencies.
A break above $0.18 could trigger a 14% move toward $0.21.
Rising Open Interest and whale activity signal growing bullish momentum.
Momentum returned across the crypto market, and Stellar — XLM, quickly joined the
CryptoNewsLand2h fa
比特币或跌破6万美元:回本周期可能延至2027年,巨鲸抛压加剧下行风险
最新数据显示,比特币若再跌破6万美元,市场恢复至历史高点的时间可能推迟至2027年。分析认为,目前的回撤和市场状况暗示仍有下行空间,加之巨鲸抛售加剧,使得市场复苏压力增大。
BlockBeatNews2h fa
Bitcoin Warning: Why This Weekend Could Be ‘Highly Eventful’ as War Enters 2nd Month
It was precisely a month ago when the US and Israel joined forces to carry out military strikes against several Iranian sites, including killing the nation’s Supreme Leader, in what was advertised as a relatively quick operation.
Although Trump bragged several times that the US is ahead of
CryptoPotato3h fa
