Crypto is in a shaky spot right now. We’re still in a bear market, rallies don’t last long, and sentiment changes with every headline. The big question traders keep asking is simple: where is the real bottom?
In a market sensitive to macro news, a serious geopolitical escalation could easily overpower any technical setup. That’s why we asked ChatGPT to model a stress scenario. If tensions between the U.S. and Iran escalate into something bigger, where could the XRP price and the BTC price realistically trade?
- Current Market Structure: Already Under Pressure
- What Happens to the BTC Price If Conflict Escalates?
- The XRP Price Could Drop Harder
- After the Initial Shock
Current Market Structure: Already Under Pressure
Let’s start with Bitcoin. On the 4-hour chart, the BTC price has been grinding lower in a messy downtrend. Earlier this month, we saw a sharp liquidation that pushed price briefly into the low $60,000s. Since then, Bitcoin has been printing lower highs near $70,000 and struggling to hold above the $63,000 area.
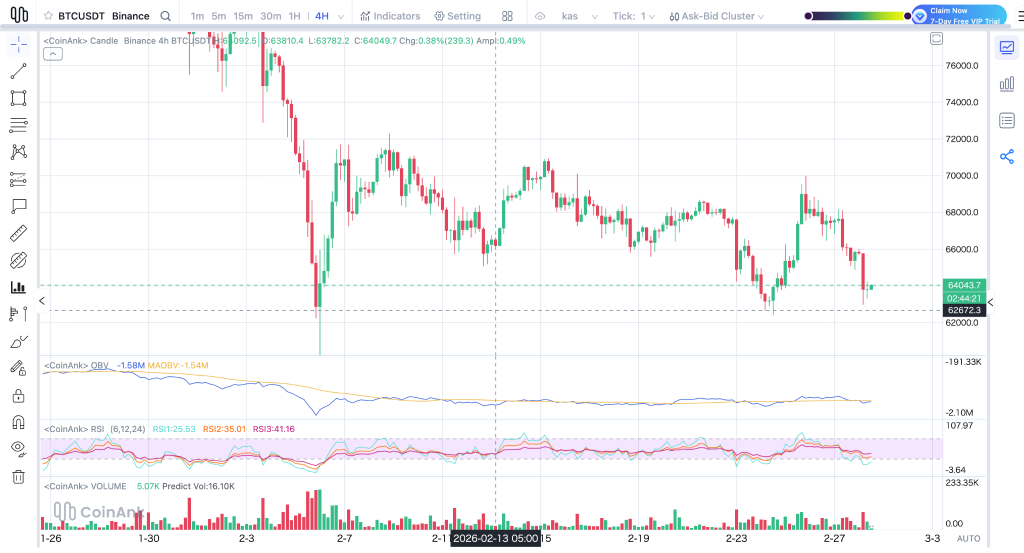
Source: CoinAnk
On-Balance Volume isn’t showing strong accumulation, and RSI is sitting in the lower half of its range. In simple terms, buyers aren’t stepping in aggressively. The structure feels fragile. If the BTC price loses the $62,000–$60,000 zone, downside could open up fast in a panic scenario.
XRP looks even more unstable. The XRP price recently flushed down to around $1.11 before bouncing into the $1.30–$1.40 region. That rebound didn’t hold. Price is drifting lower again, OBV continues trending down, and RSI shows weak momentum. XRP is already under pressure even without a geopolitical shock layered on top.
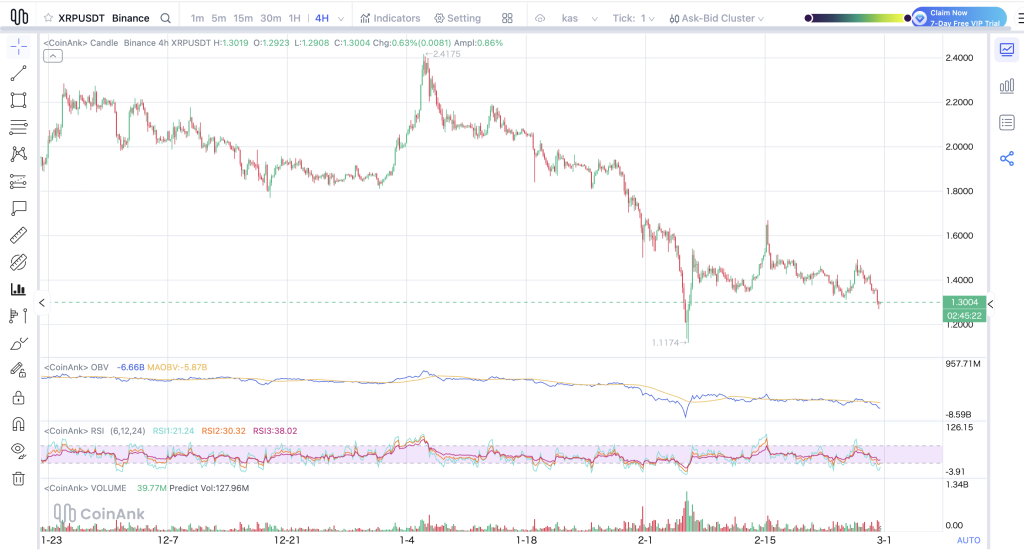
Source: CoinAnk
What Happens to the BTC Price If Conflict Escalates?
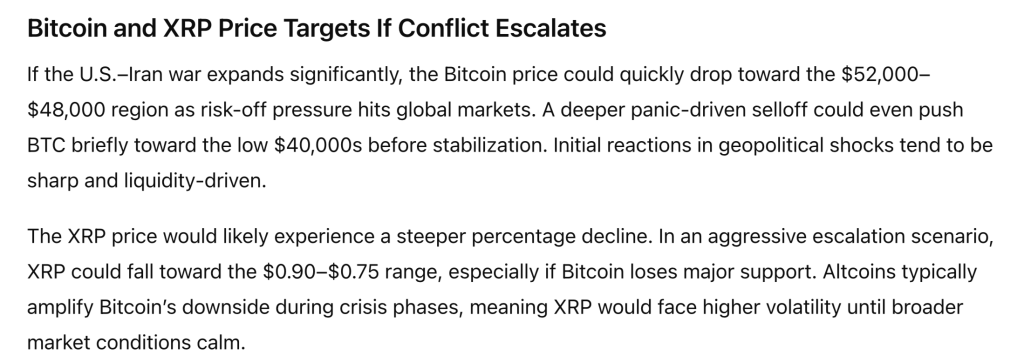
If the U.S.–Iran situation expands significantly, the first reaction would likely be risk-off across global markets. In that kind of environment, the BTC price could break under $60,000 and quickly slide toward the $52,000–$48,000 range. That’s a realistic first stop in a fast liquidity-driven selloff.
But if the panic increases and the stocks fall significantly, we could see a more pronounced dip into the low $40,000s, after which we will level out. Cryptocurrencies tend to move quickly in such macro-economic shocks, especially when there is leverage involved.
How long Bitcoin stays down would depend on how long uncertainty lingers. If tensions cool within weeks, the BTC price could bounce back quickly. A drawn-out conflict would likely keep pressure elevated for longer.
Source: ChatGPT
The XRP Price Could Drop Harder
Altcoins usually exaggerate Bitcoin’s moves during crisis moments, and the XRP price would likely follow that pattern. If the BTC price trades into the high $40,000s, XRP could fall toward the $0.90–$0.75 range.
In a severe escalation scenario, temporary moves below $0.75 aren’t impossible. XRP has thinner liquidity and tends to react more aggressively when fear spikes. At that point, the move wouldn’t be about fundamentals. It would be about capital rotation. When investors rush to reduce exposure, higher-volatility assets get hit first.
Claude AI Predicts the Price of XRP and Solana If the U.S.–Iran War Escalates Further_**
After the Initial Shock
The depth of the slump will depend on how intense the escalation gets, how stock markets react, and whether or not Bitcoin is able to attract safe-haven status when the initial panic dies down.
In the near term, the BTC price remains the anchor for the entire crypto market. The XRP price would likely amplify whatever direction Bitcoin takes. Right now, both charts look fragile. In a full escalation scenario, $48,000 for the BTC price and $0.75 for the XRP price stand out as realistic stress-case levels. Until macro stability returns, volatility will likely stay in control.
Disclaimer: The information on this page may come from third parties and does not represent the views or opinions of Gate. The content displayed on this page is for reference only and does not constitute any financial, investment, or legal advice. Gate does not guarantee the accuracy or completeness of the information and shall not be liable for any losses arising from the use of this information. Virtual asset investments carry high risks and are subject to significant price volatility. You may lose all of your invested principal. Please fully understand the relevant risks and make prudent decisions based on your own financial situation and risk tolerance. For details, please refer to
Disclaimer.