Bitcoin Cash (BCH) is currently one of the few cryptocurrencies in the top 10 with a weekly price chart trending upward. Meanwhile, BNB was once considered a potential next candidate but has been under heavy pressure, experiencing a 54% decline over the past four months.
In contrast, BCH has maintained trading within a stable range for nearly 20 months. The price range fluctuates from $272 to $640, offering many attractive opportunities for swing traders.
According to a report from Coinphoton, long-term investors expect this range’s high to be broken and turned into support before considering participation in a stronger bullish trend. Although buyers attempted a breakout in early January, this effort was unsuccessful due to a market-wide sell-off that caused the price to reverse and correct.
However, currently, the Bitcoin Cash network appears to be maintaining a stable state. The significant increase in transaction volume along with active whale movements recently indicates strong on-chain liquidity circulation.
Short-term traders focus on the middle of the range to predict the next move
Since the second week of October, BCH price has touched below the support level in the middle of the $456 range three times on the weekly timeframe. However, no weekly close has fallen below this level, keeping the outlook positive.
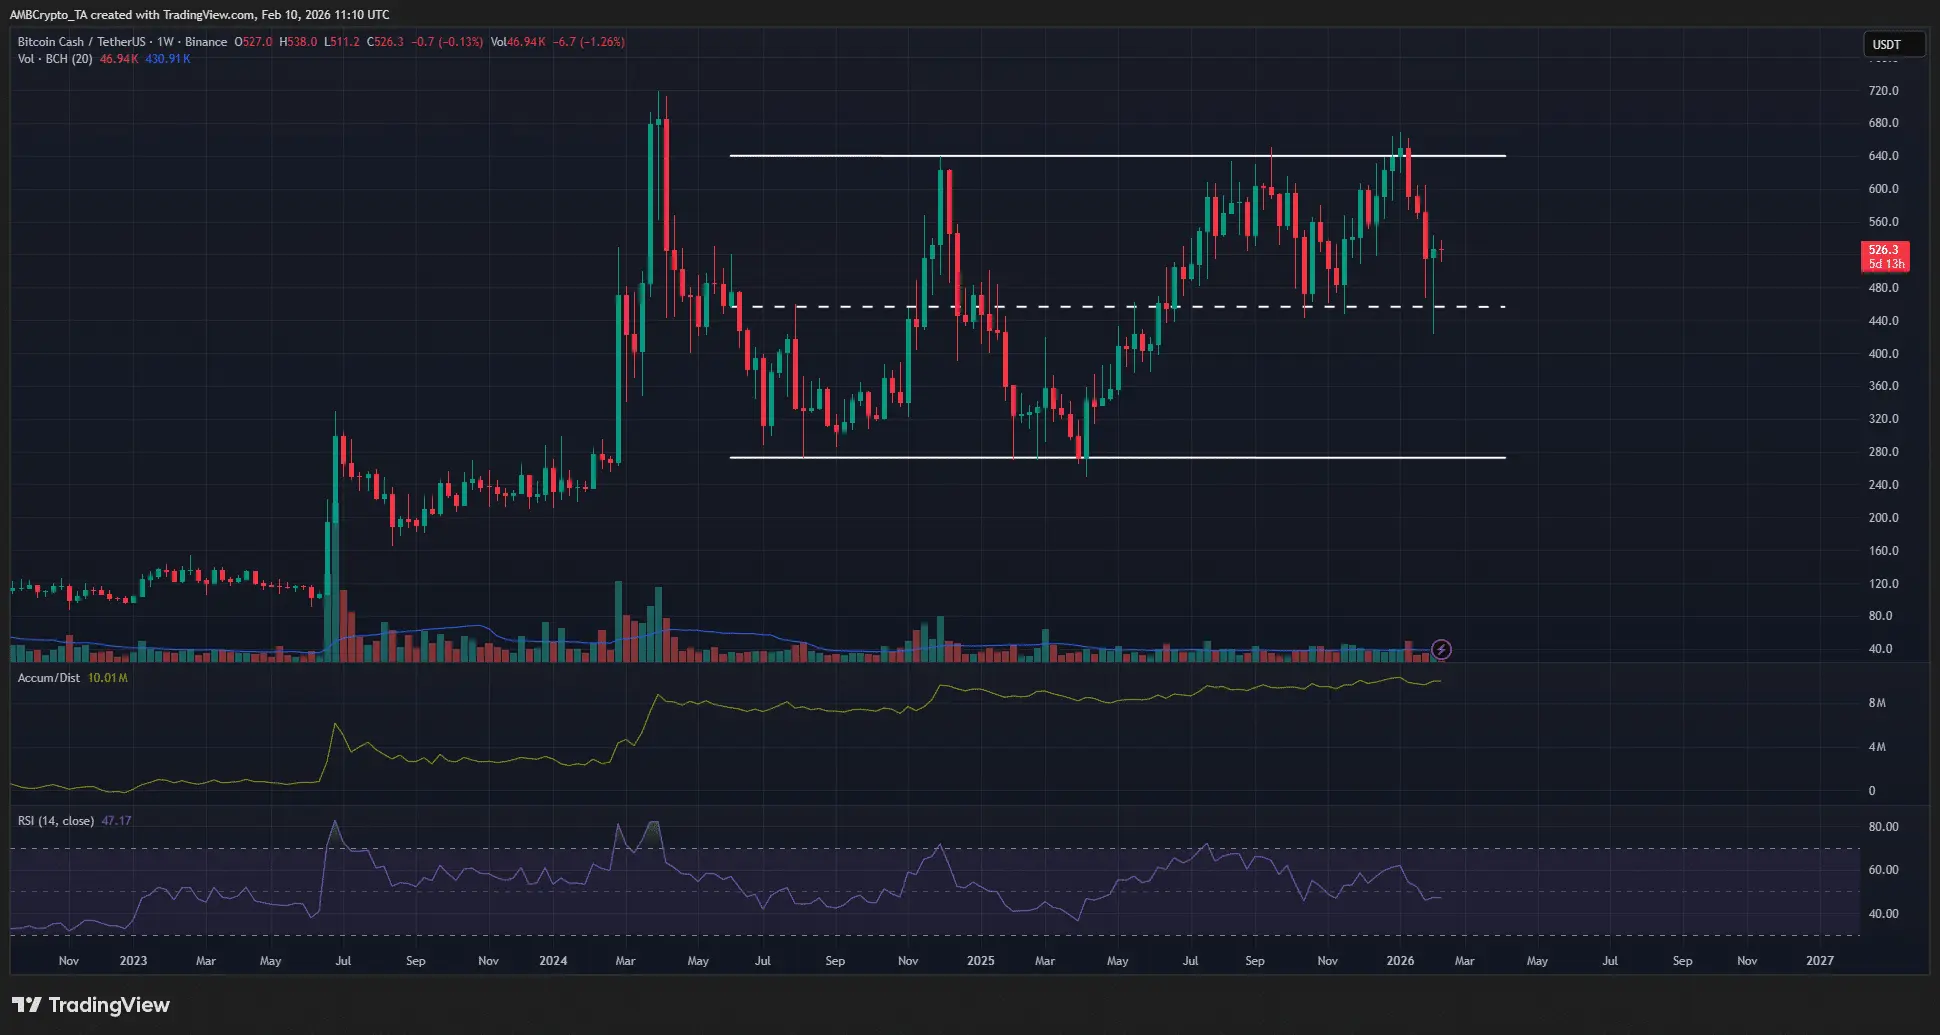 Source: TradingView The accumulation/distribution (A/D) indicator has maintained an upward trend since 2024, reflecting steady buying pressure. Additionally, the weekly RSI is currently at 47, indicating neutral momentum.
Combined with long-term price action, the $440–$460 zone is considered a low-risk, high-reward buying opportunity for investors.
Local supply zones may exert downward pressure
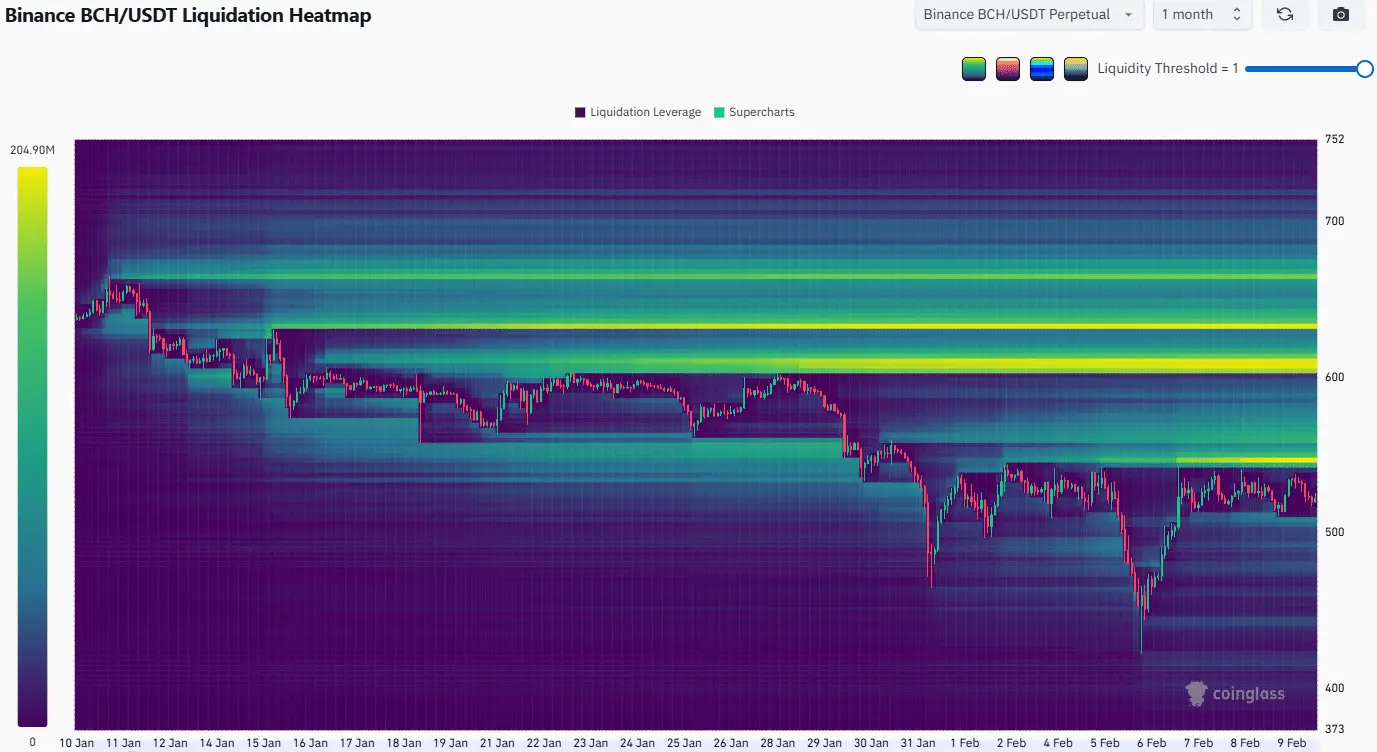
Liquidation heatmaps show that the $550 and $610 price levels are important nearby zones with significant potential to attract upward price movement before a reversal occurs. Notably, the supply zone at $550 has accumulated liquidity over the past 10 days.
 Source: CoinGlass Furthermore, the 4-hour chart indicates that BCH buyers have failed to break through the resistance at $540.
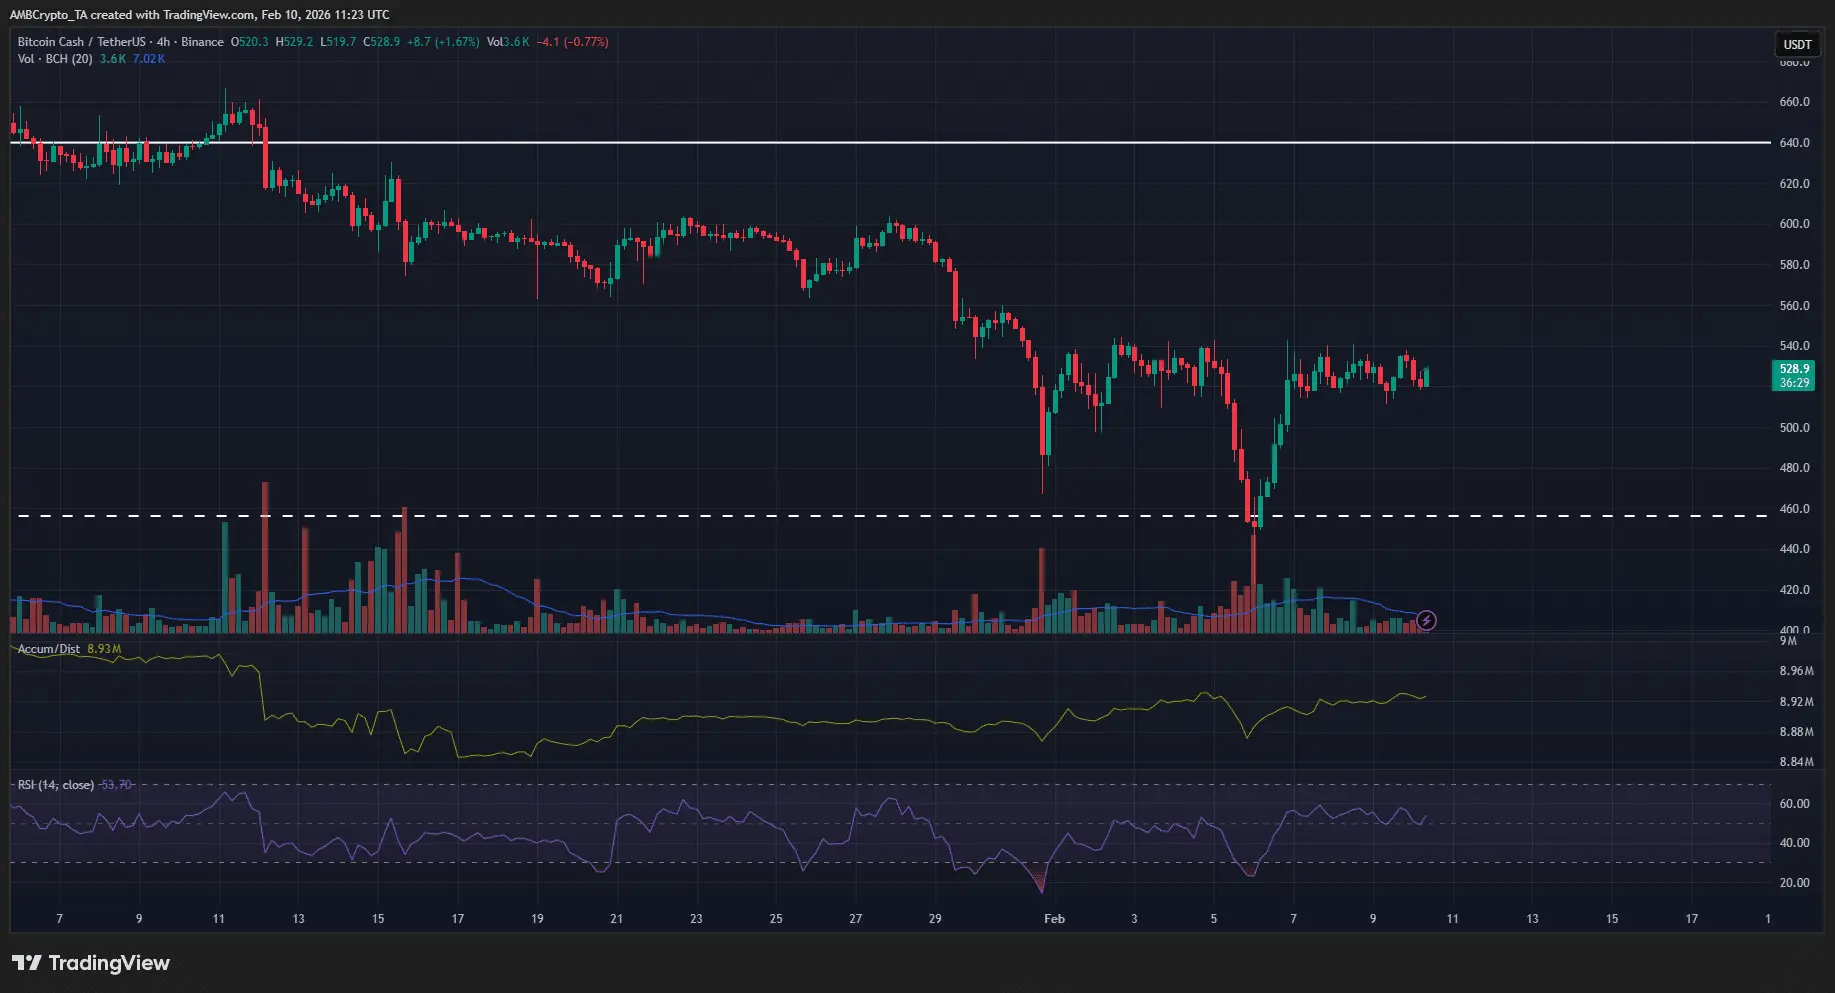 Source: TradingView Therefore, a possible scenario is that the price will be pushed higher in the short term to the $550–$560 zone before correcting downward to around $460. However, if BCH can break above $580, this scenario will be invalidated, opening the potential for a stronger rally.
Disclaimer: The information on this page may come from third parties and does not represent the views or opinions of Gate. The content displayed on this page is for reference only and does not constitute any financial, investment, or legal advice. Gate does not guarantee the accuracy or completeness of the information and shall not be liable for any losses arising from the use of this information. Virtual asset investments carry high risks and are subject to significant price volatility. You may lose all of your invested principal. Please fully understand the relevant risks and make prudent decisions based on your own financial situation and risk tolerance. For details, please refer to
Disclaimer.
Related Articles
Crypto Market Records Downturn As Fear Again Dominates Investor Sentiment
The crypto market has declined, with a total capitalization of $2.42T and a 24-hour volume drop of 6.08%. Bitcoin and Ethereum saw minor decreases, while notable gainers included $BPX and $PENGU. DeFi TVL fell by 1.56%, and NFT sales dropped 14.62%. Morgan Stanley updated its Bitcoin ETF filing, while Gemini faces a lawsuit for misleading investors.
BlockChainReporter8m ago
The Real Reason Bittensor (TAO) Price Just Pumped 30%
Bittensor's TAO surged 30% to $299, driven by endorsements from top figures like NVIDIA's Jensen Huang. Technical indicators suggest a bullish trend, eyeing resistance at $341, with strong market interest and trading volume signaling potential for ongoing recovery.
CaptainAltcoin13m ago
Bitcoin Briefly Falls Below $70,000 Mark During Asian Session as Fed Hawkishness and Macro Uncertainty Weigh on Market Volatility
Bitcoin fell below 70,000 on March 19, touching approximately 69,537, reflecting market concerns about the Federal Reserve maintaining high interest rates. Bitcoin subsequently rebounded to around 70,180, demonstrating psychological support at the 70,000 level. Despite improved market fund inflows, cryptocurrencies continue to face challenges amid global macroeconomic pressures, with 70,000 becoming a critical near-term level.
区块客43m ago
Pendle Price Challenges Inverted Flag Pattern Bottom Trendline, Technical Analysis Shows Downside Risk
Gate News reports that on March 20, Pendle token price is challenging the bottom trendline of an inverted flag pattern. Technical analysis shows that if this support level breaks, the price could fall back to the $1 level.
GateNews1h ago
Bitcoin Holds Strong at $70,000! On-Chain Data Reveals "Collective Selling Wave," Retail Investors Emerge as Biggest Selling Pressure
Against the backdrop of Middle East geopolitical tensions, Bitcoin has faced a comprehensive sell-off with nearly all coin holders turning to net selling, most notably among retail investors. According to Glassnode data, the cumulative trend score has dropped to 0.04, indicating heavy selling pressure in the market. Small-cap holders and mid-sized investors are showing significant selling intensity, while whales, though reducing their holdings, are doing so at a lower rate. Despite the dismal data, Bitcoin continues to demonstrate resilience against declines.
区块客1h ago
Bitcoin Price Trend Mirrors Late 2024 Decline Pattern, Traders Focus on Key Technical Levels
Bitcoin's current price movement is similar to the downtrend seen at the end of 2024, showing an upward tilt within narrow range fluctuations since February. Technical analysis indicates that a break below the lower band of 65,800 USD would form a key signal, while a breakthrough above could show different performance. Traders are closely monitoring this critical level.
GateNews1h ago
