
As the new year 2026 begins, the broader cryptocurrency market has shown modest strength over the past few hours, with both Bitcoin (BTC) and Ethereum (ETH) turning slightly green. This improvement in sentiment has started to spill over into the altcoin market as well, with several tokens attempting to build upward momentum — including Render (RENDER).
RENDER is currently up around 4% on the day, but the more compelling development lies beneath the surface. On lower timeframes, price action is beginning to highlight a constructive bullish structure that could soon pave the way for a meaningful breakout if confirmed.
Source: Coinmarketcap
Ascending Triangle Structure Takes Shape
On the 4-hour chart, RENDER appears to be forming a textbook ascending triangle, characterized by a sequence of higher lows pressing steadily against a well-defined horizontal resistance zone. This structure is widely viewed as a bullish continuation pattern, particularly when it develops after a period of consolidation and shows signs of accumulation.
RENDER recently faced rejection near the $1.36 neckline resistance, which pushed price back toward its rising support trendline around the $1.28 region. However, each pullback has been met with strong buying interest, keeping the pattern intact and preventing any deeper breakdown. This behavior suggests that sellers are gradually losing control as buyers continue to step in at higher levels.
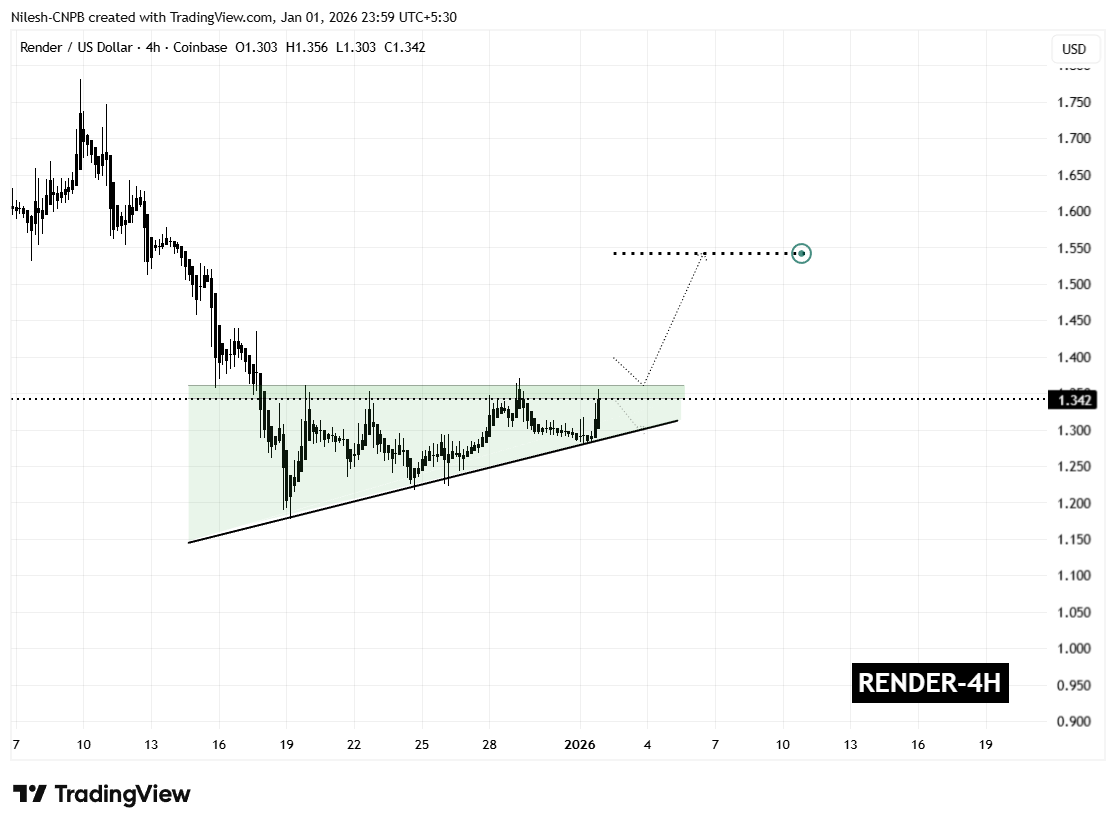
Render (RENDER) 4H Chart/Coinsprobe (Source: Tradingview)
The latest rebound has carried RENDER back toward the upper boundary of the pattern, reinforcing the idea that demand remains firm. Rather than signaling weakness, this price action points to healthy consolidation as the market tightens ahead of a potential breakout.
What’s Next for RENDER?
From here, RENDER appears to be preparing for another test of the $1.36 resistance zone. A confirmed breakout and sustained close above this level, ideally followed by a successful retest as support, would validate the ascending triangle structure and likely trigger a bullish expansion phase.
Based on the measured move of the pattern, the technical upside projection points toward the $1.54 region. This target represents a potential upside of roughly 14% from current levels and also aligns with previous price structure, strengthening the bullish case.
That said, caution remains warranted. A failure to break above resistance could result in a pullback toward the rising support trendline. As long as that trendline continues to hold, the broader bullish structure would remain intact. A decisive breakdown below support, however, would invalidate the pattern and delay any breakout scenario.
For now, the combination of improving market sentiment, persistent buying pressure, and a tightening ascending triangle structure suggests that Render is approaching a critical decision point — one that could define its next significant move as 2026 gets underway.
Disclaimer: The views and analysis presented in this article are for informational purposes only and reflect the author’s perspective, not financial advice. Technical patterns and indicators discussed are subject to market volatility and may or may not yield the anticipated results. Investors are advised to exercise caution, conduct independent research, and make decisions aligned with their individual risk tolerance.
About Author: Nilesh Hembade is the Founder and Lead Author of Coinsprobe, with over 5 years of experience in the cryptocurrency and blockchain industry. Since launching Coinsprobe in 2023, he has been providing daily, research-driven insights through in-depth market analysis, on-chain data, and technical research.
Disclaimer: The information on this page may come from third parties and does not represent the views or opinions of Gate. The content displayed on this page is for reference only and does not constitute any financial, investment, or legal advice. Gate does not guarantee the accuracy or completeness of the information and shall not be liable for any losses arising from the use of this information. Virtual asset investments carry high risks and are subject to significant price volatility. You may lose all of your invested principal. Please fully understand the relevant risks and make prudent decisions based on your own financial situation and risk tolerance. For details, please refer to
Disclaimer.
Related Articles
BTC 15-minute pump of 1.03%: integer-level breakout and macro risk-hedging resonance amplifying the move
From 2026-04-09 15:30 to 15:45 (UTC), the BTC return rate recorded +1.03%, with the price ranging from 71,291.5 to 72,226.9 USDT, and the amplitude reaching 1.31%. During the abnormal move, market attention rose rapidly, volatility noticeably intensified, and prompted investors to closely watch short-term trends.
The main driver behind this abnormal move was BTC breaking through the 72,000 USDT integer level at 15:34, which directly activated some algorithmic trading and drew short-term funds in. The rapid breakout above this key price level boosted spot and derivatives trading volumes in the short term
GateNews40m ago
Analyst: BTC $63k is the watershed between bulls and bears; multiple support levels form the entry range
Crypto analyst Ali Martinez says that current market volatility could provide cycle-level get on board opportunities, and has set multiple key price ranges based on on-chain data. The main support band is $63,111 to $70,685; if it breaks below, it could lead to a liquidity vacuum. In the long term, BTC is approaching its historical uptrend line, and it’s recommended to accumulate in batches.
GateNews3h ago
The U.S.-Iran negotiations have been inconsistent, and Bitcoin and gold both surged and then fell back.
After the Iran–Israel ceasefire, Bitcoin and gold both rose in sync before pulling back. From the perspective of geopolitical chess, we break down the deeper logic behind the price moves and the outlook that follows.
InstantTrends4h ago
Bitcoin Sits at a Crucial Support Level, Analyst Expects Break Above $79,000 or Below $64,000
Bitcoin sits at a crucial support level, big move could play out soon.
Analyst expects break above $79,000 for bullish reaction.
A bearish reaction and a drop below $64,000 could also play out.
This week was an exciting one for the
CryptoNewsLand5h ago
Solana Recovery Gains Pace While Derivatives Data Shows Split Sentiment
Key Insights
Solana records four consecutive days of gains as funding rates rise, signaling stronger retail interest while overall market conviction remains divided across participants.
Declining futures Open interest alongside rising funding rates highlights reduced trader exposure,
CryptoNewsLand6h ago
ATOM Eyes 15% Gain: Technical Indicators Point to Possible Upswing
ATOM broke a long bearish trend with a 5.25% price increase.
Price must close above $1.77 to confirm a potential 15% rally.
Top holders and rising Open Interest indicate growing bullish sentiment among traders.
Cosmos — ATOM, has started showing signs of breaking free from a long bearish
CryptoNewsLand6h ago
