 Zcash price has been having a steady loss of structure that makes the chart harder to ignore. On the 1H timeframe, ZEC price is drifting lower after failing to hold key areas that previously acted as support. The move lines up closely with a technical framework posted by analyst Ardi (@ArdiNSC), who has been tracking subtle shifts in Zcash’s microstructure long before the latest weakness became obvious.
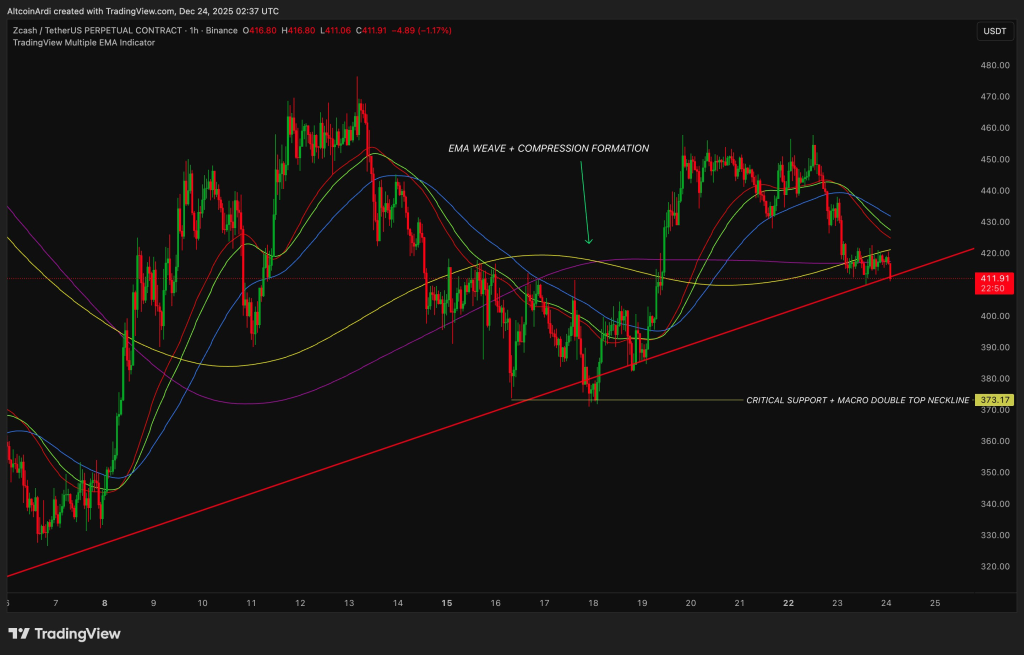
Zcash price recently traded near $411 after spending days compressing inside a tight range. Earlier attempts to push higher stalled, and each bounce started to lose strength. That slow loss of momentum matters. According to Ardi, ZEC price already lost alignment with its short and long term trend structure before the latest dip into lower support zones.
The chart shows price falling below areas that previously held the market together. This type of move does not feel impulsive. It feels planned. Past price action suggests Zcash often weakens in phases like this, where the damage shows up gradually rather than all at once. The visual compression seen earlier on the chart resolved to the downside, putting pressure on nearby trend support.
Zcash price has been having a steady loss of structure that makes the chart harder to ignore. On the 1H timeframe, ZEC price is drifting lower after failing to hold key areas that previously acted as support. The move lines up closely with a technical framework posted by analyst Ardi (@ArdiNSC), who has been tracking subtle shifts in Zcash’s microstructure long before the latest weakness became obvious.
Zcash price recently traded near $411 after spending days compressing inside a tight range. Earlier attempts to push higher stalled, and each bounce started to lose strength. That slow loss of momentum matters. According to Ardi, ZEC price already lost alignment with its short and long term trend structure before the latest dip into lower support zones.
The chart shows price falling below areas that previously held the market together. This type of move does not feel impulsive. It feels planned. Past price action suggests Zcash often weakens in phases like this, where the damage shows up gradually rather than all at once. The visual compression seen earlier on the chart resolved to the downside, putting pressure on nearby trend support.
@ArdiNSC / X
- ZEC Price Pattern Points Toward A Double Top Scenario
- Zcash Indicator Readings Reflect Short Term Uncertainty
- Long Term Zcash Outlook Looks Healthier On Monthly Timeframe
ZEC Price Pattern Points Toward A Double Top Scenario
One of the more uncomfortable elements on the Zcash chart is how closely current price action mirrors previous topping behavior. Ardi noted that the structure is lining up with a second potential double top formation. The first instance already played out earlier, with price rolling over well before obvious confirmation signals appeared.
This time, ZEC price is again following a similar script. Price pushed up, stalled near resistance, then slipped lower while momentum quietly faded. The key concern is that the pattern is unfolding before most indicators would traditionally confirm weakness. Historically, that early signal has mattered for Zcash price movements.
A closer look at the chart reveals a rising long term trendline acting as the next major test. That area sits closer to $373, which also aligns with a critical support level tied to a broader double top neckline. Price has not reached that zone yet, though the current structure suggests it may come into focus if weakness persists.
ZEC price hovering above this level keeps the larger structure intact, at least for now. Losing it would shift the conversation entirely. The chart does not show panic, though it does show vulnerability. That combination often creates choppy and uncomfortable trading conditions.
Zcash Indicator Readings Reflect Short Term Uncertainty
Daily chart indicators from investing.com support the idea that Zcash price is in a fragile state rather than a clear trend. The readings below show a mixed environment where momentum struggles to find direction.
Name
Value
Action
RSI(14)
47.192
Neutral
STOCH(9,6)
63.292
Buy
MACD(12,26)
-17.83
Sell
ADX(14)
22.571
Sell
ROC
1.246
Buy
RSI hovering near 47 shows ZEC price stuck in no man’s land, lacking strong buying or selling pressure. MACD staying negative points to lingering downside momentum, while ADX below 25 suggests the trend itself remains weak. Short term bounces remain possible, though conviction behind them appears limited.
The daily indicators still lean toward caution. Zcash price has yet to regain strength on this timeframe, and momentum remains uneven. This aligns with Ardi’s view that structural weakness showed up before most traditional confirmations.
Daily conditions like these often result in sideways to lower movement rather than immediate reversals. Until ZEC price reclaims lost structure, pressure remains present beneath the surface.
Long Term Zcash Outlook Looks Healthier On Monthly Timeframe
The longer term picture tells a different story. Monthly indicators for Zcash price paint a much stronger backdrop that contrasts sharply with current short term weakness.
Name
Value
Action
RSI(14)
88.026
Overbought
STOCH(9,6)
28.955
Sell
MACD(12,26)
78.3
Buy
ADX(14)
61.223
Buy
Ultimate Oscillator
56.448
Buy
ROC
1013.268
Buy
High ADX and positive MACD readings suggest long term momentum remains firmly intact despite near term discomfort. Overbought RSI reflects how far ZEC price has traveled over the bigger cycle, not necessarily an immediate reversal signal. This disconnect between timeframes explains why the current chart feels tense rather than outright bearish.
Read Also: Here’s the Sei (SEI) Price If Network Adoption Keeps Compounding Into 2026
Zcash price is not breaking down aggressively, though it is losing structure in a way that deserves attention. Short-term charts look fragile. Daily indicators remain soft. Long-term momentum still supports the broader trend. That split creates uncertainty, and uncertainty often leads to choppy price action.
Disclaimer: The information on this page may come from third parties and does not represent the views or opinions of Gate. The content displayed on this page is for reference only and does not constitute any financial, investment, or legal advice. Gate does not guarantee the accuracy or completeness of the information and shall not be liable for any losses arising from the use of this information. Virtual asset investments carry high risks and are subject to significant price volatility. You may lose all of your invested principal. Please fully understand the relevant risks and make prudent decisions based on your own financial situation and risk tolerance. For details, please refer to
Disclaimer.
Related Articles
Bitcoin holds steady at 74K, and FOMO sentiment is heating up as U.S. stocks hit a record high
Benefiting from positive news about the U.S.-Iran peace agreement, the stock market surged sharply, with the Nasdaq index and the S&P 500 index reaching record highs. Bitcoin remained steady at 74K, market sentiment improved, and the Fear & Greed Index rose to 55. Investor FOMO toward the stock market intensified, and the total market capitalization in the crypto market increased overall, indicating genuine buy-side interest.
ChainNewsAbmedia30m ago
Bitcoin Rebounds to $74K on U.S.-Iran Framework Deal, But Market Skepticism Remains
Bitcoin's recent rise to mid-$74,000 followed a risk asset rally linked to a U.S.-Iran nuclear framework, but skepticism remains due to flat Treasury yields and unchanged gold prices. The core issue of uranium enrichment persists, and while on-chain data shows BTC's gradual advance, options markets reflect doubts about a sustained breakout. Overall, analysts see the rally as temporary, with macro conditions still tight and potential downside risks.
GateNews13h ago
Cardano Traders Watch $0.243 Support Level as ADA Price Faces Critical Decision
Cardano (ADA) is at a crucial support level of $0.243, with potential gains to $0.30 if it holds. A daily close below this could lead to declines toward $0.10. Currently, trading volume is around $500 million, with ADA notably below its all-time high.
GateNews14h ago
ETH/BTC Price Ratio Rebounds to 0.0313 in Q1 2026 as Ethereum User Base Surges 82%
In Q1 2026, the Ethereum-to-Bitcoin price ratio reached a three-month high at 0.0313. Ethereum added 284,000 users and surpassed $180 billion in stablecoin supply. Bitcoin remained strong above $74,000, driven by significant ETF inflows.
GateNews19h ago
Why is Bitcoin up today? Trump says Iran is seeking a truce, and risk assets move higher across the board
On April 15, Bitcoin rebounded about 6% after Trump said Iran is seeking to reach an agreement, breaking above $75,000. Expectations for the resumption of U.S.-Iran negotiations warmed up, lifting Asian stock markets. Technically, roughly $6 billion worth of short positions were forced to close, accelerating the rebound. Analysts said that if the U.S.-Iran situation continues to ease, Bitcoin could break through $80,000, and they predicted it may reach $150,000 by year-end.
MarketWhisper23h ago
Bitmine is promoted to the NYSE main board! Tom Lee: US stocks may be at a bottom, and selling pressure on Ether could ease
Bitmine officially transferred from the NYSE American market to the main board, marking a significant milestone for the company. Despite a sharp drop in its share price, it still increased the share repurchase program to $4 billion. The company holds a large amount of Ether, and expects that a rebound in the crypto market will help improve its assets and share price performance.
CryptoCity23h ago
