Date: Fri, Dec 19 2025 | 12:45 PM GMT
The broader cryptocurrency market is showing relative strength despite concerns around the Japan rate hike. Cooling U.S. inflation has helped both Bitcoin (BTC) and Ethereum (ETH) hold in the green, and this stability is beginning to spill over into select altcoins, including Stellar (XLM).
XLM has posted modest gains today, but beyond the short-term price move, the daily chart is starting to reveal an emerging technical structure that could set the stage for a more meaningful recovery if key levels continue to hold.
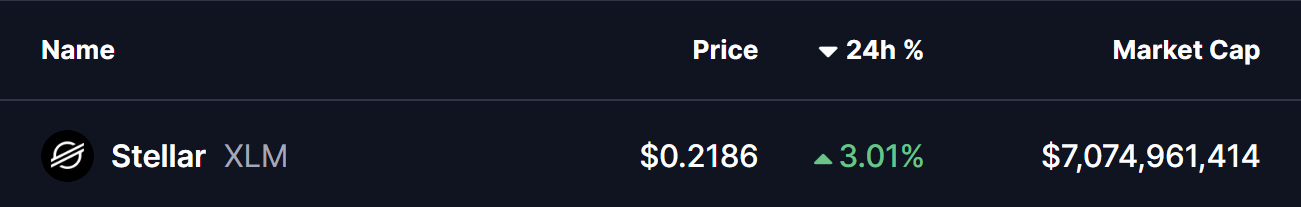
Source: Coinmarketcap
Harmonic Pattern Signals Potential Upside
On the daily timeframe, XLM appears to be forming a Bearish Cypher harmonic pattern — a setup that often generates upside momentum during its final CD leg before price reaches the Potential Reversal Zone (PRZ).
The pattern began at point X near the $0.3113 region, where XLM topped out before entering a sharp corrective phase. Price then declined into point A, followed by a rebound toward point B. From there, XLM rolled over again and extended lower into point C around the $0.2029 area, completing the core structure of the pattern.
Since tagging this low, XLM has started to stabilize and grind higher, currently trading near the $0.2188 level. This slow but steady recovery suggests that selling pressure may be fading, with buyers beginning to defend the recent lows more aggressively.
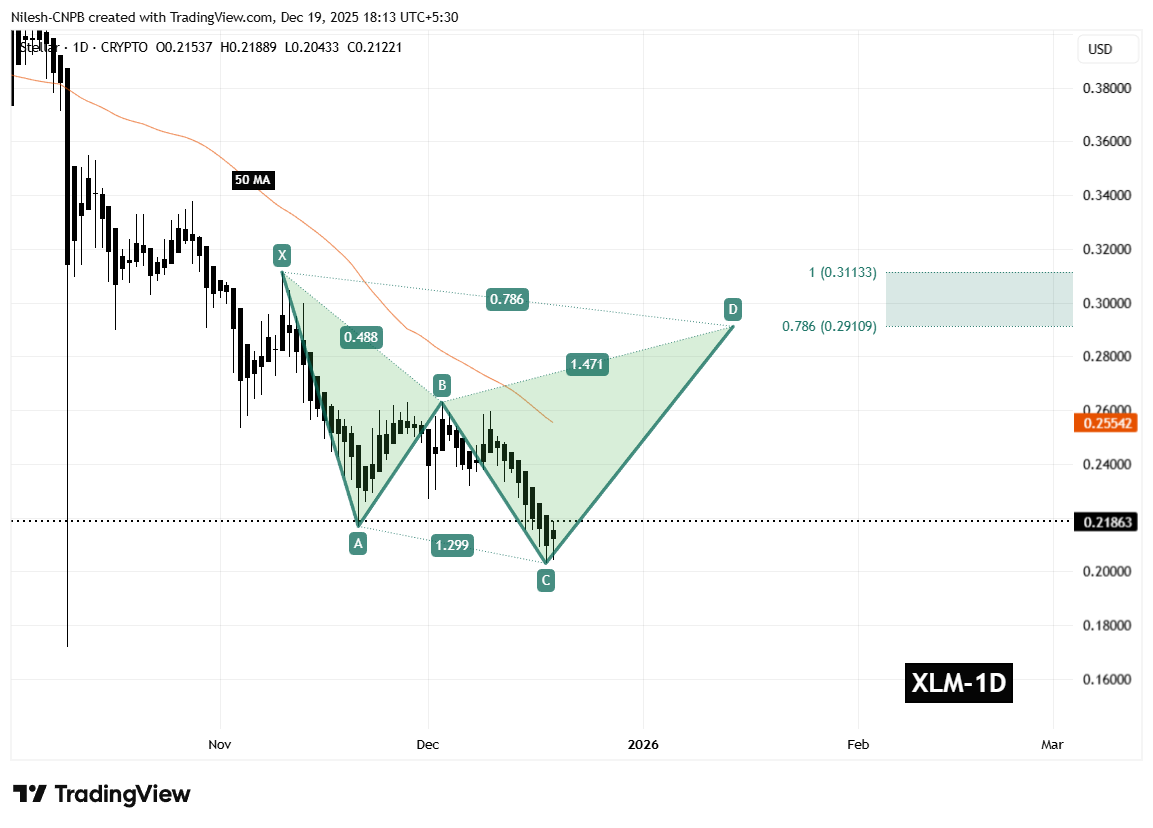
Stellar (XLM) Daily Chart /Coinsprobe (Source: Tradingview)
A key technical factor aligning with this structure is the 50-day moving average, currently positioned near $0.2554. This moving average has consistently acted as dynamic resistance throughout the downtrend and represents an important hurdle for bulls to overcome in the near term.
What’s Next for XLM?
In the short term, the most critical level to monitor is the C-leg support around $0.2029. As long as XLM holds above this zone, the harmonic pattern remains valid and the bullish CD-leg scenario stays intact.
If price continues to build strength from this base, the next major test will be a reclaim of the 50-day moving average near $0.2554. A decisive break and close above this level would signal improving momentum and could accelerate upside continuation.
Based on the harmonic structure, the projected upside targets sit within the Potential Reversal Zone, defined between the 0.786 Fibonacci extension near $0.2910 and the 1.0 extension around $0.3113. Reaching this zone would represent a potential upside of roughly 40–45% from current price levels, making it a key area where profit-taking or stronger resistance could emerge.
On the downside, failure to hold above the $0.2029 support would significantly weaken the bullish setup. A breakdown below this level could invalidate the harmonic structure and expose XLM to deeper downside pressure before any sustainable recovery attempt develops.
For now, the chart suggests Stellar is sitting at an important technical crossroads. While confirmation is still needed, the presence of a well-defined harmonic pattern indicates that a short- to medium-term bounce remains a realistic possibility if buyers continue to defend current levels and reclaim key resistance zones.
Disclaimer: The views and analysis presented in this article are for informational purposes only and reflect the author’s perspective, not financial advice. Technical patterns and indicators discussed are subject to market volatility and may or may not yield the anticipated results. Investors are advised to exercise caution, conduct independent research, and make decisions aligned with their individual risk tolerance.
Disclaimer: The information on this page may come from third parties and does not represent the views or opinions of Gate. The content displayed on this page is for reference only and does not constitute any financial, investment, or legal advice. Gate does not guarantee the accuracy or completeness of the information and shall not be liable for any losses arising from the use of this information. Virtual asset investments carry high risks and are subject to significant price volatility. You may lose all of your invested principal. Please fully understand the relevant risks and make prudent decisions based on your own financial situation and risk tolerance. For details, please refer to
Disclaimer.
Related Articles
Why Is Bitcoin Up Today? Hormuz Blockade Triggers Short Squeeze and a BTC Test of $75k
On April 13, Bitcoin rose from its early-session low of 70,741 to trade as high as $74,900 during the session, approaching the $75,000 level. The main drivers came from two directions: after Trump ordered the blockade of the Strait of Hormuz, traders began to view Bitcoin as a geopolitical hedge asset; and a massive net short position that had been building as funding rates stayed persistently negative was met with liquidation, triggering a chain of liquidations totaling millions of dollars near the $70,000 support level.
MarketWhisper1h ago
Bitmine gets promoted to the NYSE main board! Tom Lee: U.S. stocks may have bottomed out, and Ether’s selling pressure may ease
Bitmine has officially moved from the NYSE American board to the main board in the United States, marking an important milestone for the company. Despite a sharp drop in its stock price, it has still increased its share repurchase authorization to $4.0 billion. The company holds a large amount of Ether, and it predicts that a rebound in the crypto market will help boost its assets and stock price performance.
CryptoCity3h ago
U.S. stocks have recovered the losses since the Iran war, while Bitcoin pushes up to 74K
Due to market expectations that the United States and Iran will reach an agreement, the S&P 500 index has rebounded to its highest level since the war, and Bitcoin has also surged to $74,900. Despite the failure of peace talks between the U.S. and Iran, the U.S. has imposed a maritime blockade to pressure Iran. MicroStrategy once again made a large-scale purchase of Bitcoin, indicating that investor confidence is picking up.
ChainNewsAbmedia3h ago
BTC 15-minute surge up 0.77%: Spot buy-side demand and on-chain activity convergence drive short-term strength
2026-04-13 22:00 to 2026-04-13 22:15 (UTC), the BTC price fluctuated upward within 15 minutes, with a return of +0.77%. The high and low prices in the range were between 73178.0 and 73899.0 USDT, and the amplitude was 0.99%. During the event, market attention increased, volatility slightly intensified, and overall sentiment leaned positive.
The main driver behind this price deviation was active spot market buy orders stepping in, which pushed the BTC price higher in the short term. The number of active addresses on-chain remained at a high level, reflecting an increase in genuine trading demand. Trading volume was higher than in the previous period,
GateNews4h ago
Bitmine gets promoted to the NYSE main board! Tom Lee: US stocks may be bottoming out, and sell pressure on Ether could ease
Bitmine has officially moved from the NYSE American board to the main board in the United States, marking an important milestone for the company. Despite a sharp drop in its share price, it has still increased the share repurchase plan amount to $4.0 billion. The company holds a large amount of Ether, and it expects that a rebound in the crypto market will help improve its assets and share price performance.
CryptoCity6h ago
