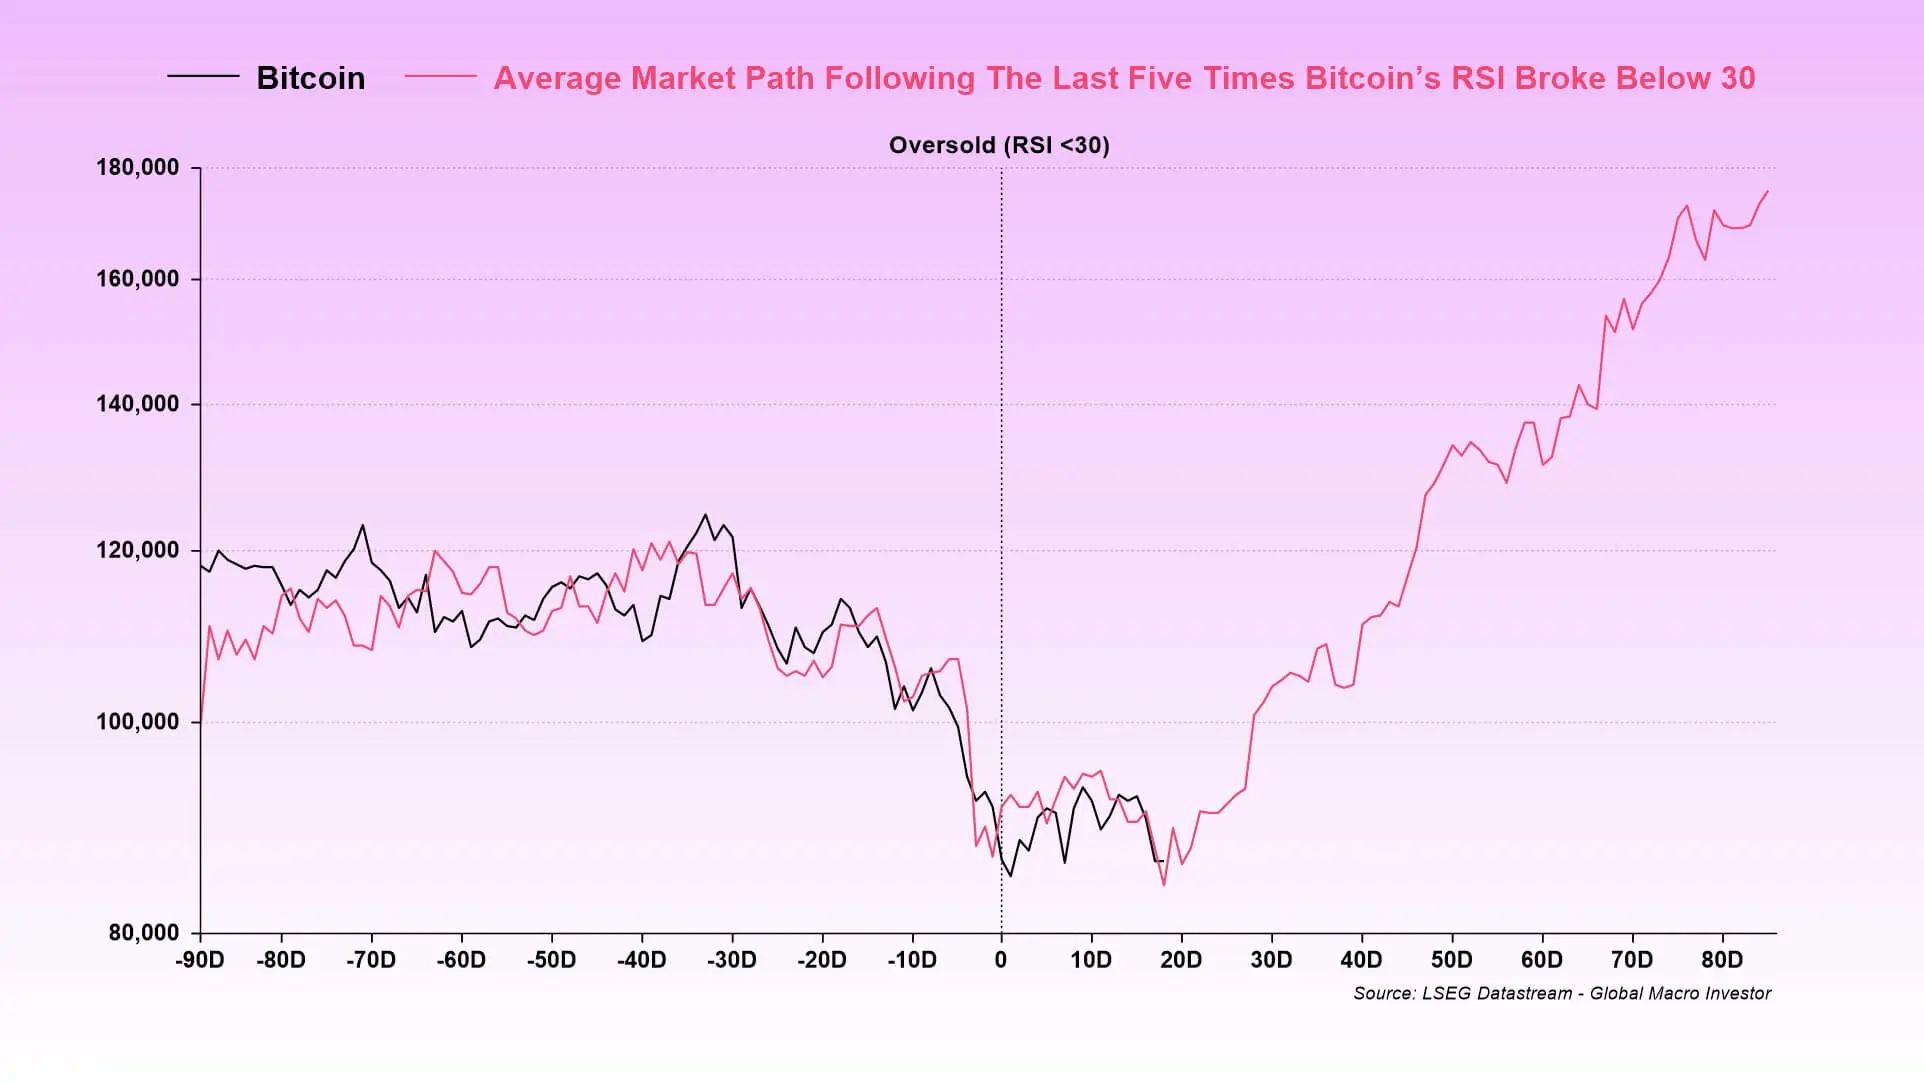
Bitcoin is trading around the $89,000 mark after the 14-day Relative Strength Index (RSI) fell below 30 in mid-November – a threshold often monitored by traders as a “market capitulation” signal.
A chart shared by Julien Bittel (Global Macro Investor), using data from LSEG Datastream, compares the current Bitcoin price movement with the average trajectory after the previous 5 instances when the 14-day RSI broke below 30. This average path indicates an end point around $180,000, approximately 90 days after the RSI entered oversold territory.
The $180,000 level mainly reflects yield calculations. From the current $89,000, reaching this level would require Bitcoin to increase by about 105% over three months, equivalent to a cumulative daily gain of approximately 0.80%.
However, this chart is not a probability forecast but a study of events based on historical averages. This means it may obscure significant differences in price trajectories during various past phases.
 Bitcoin’s oversold RSI forecast (Source: Julien Bittel)## The “cycle peak” thesis still persists
Price movements since October continue to fuel debate around the 4-year cycle. Bitcoin reached a peak of $126,223 in October before sharply correcting at the end of November.
On November 21, the price bottomed around $80,697, roughly a 36% correction from October’s high. This decline falls within the 35%–55% correction zone according to CoinPhoton’s cycle analysis framework, which identifies potential lows between $82,000 and $57,000 if the post-halving model remains valid.
Another analysis highlights the $106,400 level as a key equilibrium point, repeatedly switching roles between support and resistance. Bitcoin traded below this level for several weeks into December.
This is especially significant when considering the RSI scenario, as a move toward $180,000 would almost certainly require the price to reclaim and hold previous “shift” levels, rather than just a technical rebound within a correction trend.
Capital flows and derivatives remain obstacles
Capital flows are a real test for the “bullish breakout” argument. On November 19, investors withdrew a record $523 million from BlackRock’s iShares Bitcoin Trust (IBIT), coinciding with Bitcoin breaking below $90,000. Since then, net inflows into Bitcoin ETFs have nearly stalled.
In the derivatives market, position structures also create limited ranges. Options market analysis shows dealer gamma concentration in the $86,000–$110,000 range. This range often encourages two-way trading, as hedging activities are continuously adjusted, slowing trend movements until prices break out of this zone with enough momentum.
According to Barchart’s technical table, Bitcoin’s 14-day RSI has recovered to around 40 after falling below 30 in mid-November. This aligns with a rebound, but also indicates the market remains sensitive to the risk of selling pressure if capital continues to weaken.
Is the 4-year cycle really “dead”?
Bittel’s argument that the “4-year cycle has ended” is not based on halving schedules but on macroeconomic drivers. He links the cycle timing to the structure of sovereign debt refinancing, US government borrowing maturities, and interest costs – factors directly affecting policy and liquidity.
Data from FRED shows that US federal interest payments have become a major item in current expenditures, and according to the Congressional Budget Office, public debt interest is forecasted to exceed $1 trillion annually.
Liquidity conditions are especially critical within the 90-day window of the RSI chart, as they coincide with macro lead-lag models often used by traders. In December, the US Federal Reserve (Fed) lowered interest rates to the 3.50%–3.75% range and announced monthly purchases of about $40 billion in short-term Treasury bills, along with reinvestments, to ease year-end liquidity tensions.
A commonly compared indicator is the global M2 money supply, which lags Bitcoin by about 90 days. While this correlation can break down over long periods, it is often used to illustrate how liquidity forces can precede risk asset revaluation.
 The correlation between Bitcoin and M2 (84-day lag) over 180 daysAnalysis shows that during uptrends, M2 tends to track Bitcoin’s price movements. Conversely, during downtrends, M2 continues to increase while Bitcoin’s price diverges downward.
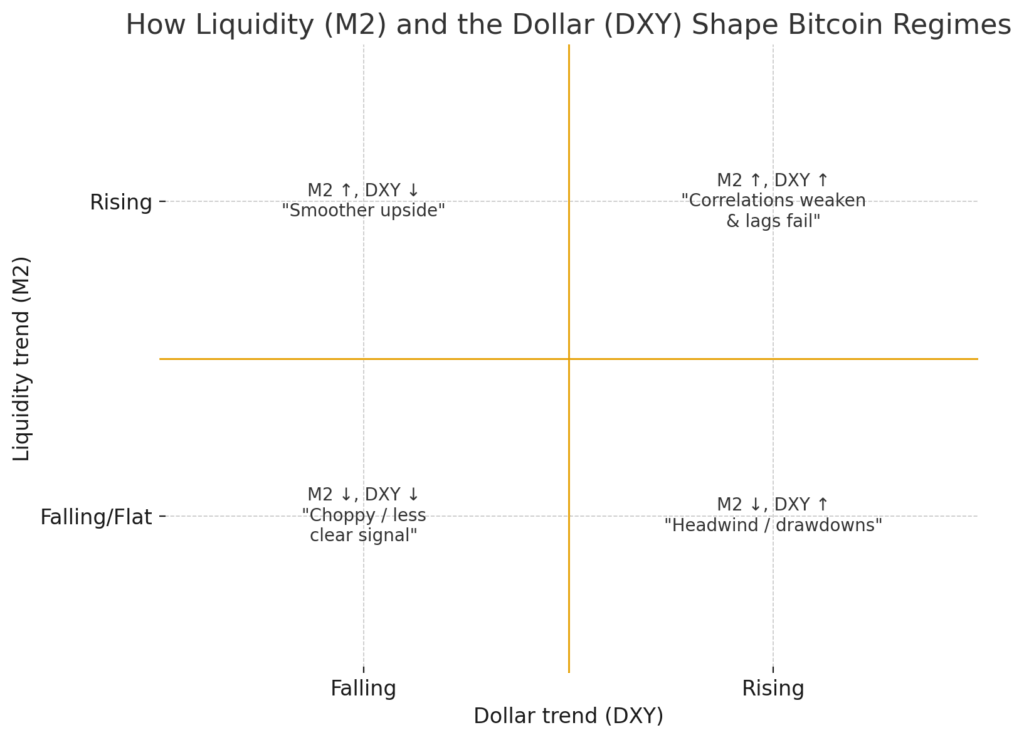 Bitcoin versus M2 and liquidity measures## Oversold RSI is not always a bottom
A counterpoint is that RSI can remain at extreme levels without forming a sustainable bottom. Therefore, the scenario targeting $180,000 is conditional, with key confirmation signals being more important than the event of RSI breaking below 30 itself.
Main monitoring points include:
– Starting level: approximately $87,800 (17/12), serving as the basis for the 90-day yield calculation
– Event signal: 14-day RSI below 30 (mid-November)
– Chart target: around $180,000 after ~90 days, representing about a 105% increase
– Shift level: $106,400, which must be reclaimed and held to transition from technical rebound to trend
– Dealer price range: $86,000–$110,000
– Capital stress indicator: $523 million withdrawal from IBIT on 19/11 (
– Cycle correction zone: $82,000–$57,000, from the October peak of $126,223
Bitcoin has accumulated all the “inputs” for this debate: the RSI break in mid-November and the bottom on November 21 around $80,697. What remains is to reclaim the $106,400 level and see a clear improvement in spot ETF capital flows to determine whether the current rebound is merely technical or can extend along the $180,000 trajectory.
As analyst Caleb Franzen noted:
Oversold RSI in a bull market is often positive.
Oversold RSI in a bear market is not.
Meanwhile, some other viewpoints, like MilkRoad, agree with Bittel:
Short-term oversold signals need to be viewed in the context of liquidity and business cycles. If conditions continue to improve and capital returns to the market, these oversold dips often lead to upward trends over time, though the path may be bumpy. We believe prices will go higher.
