Bitcoin (BTC) recorded buying pressure pushing the price above the $90,000 mark on Wednesday, however, higher price levels quickly attracted selling pressure from the bears. Data from Farside Investors shows that spot Bitcoin ETF funds experienced a net outflow of up to $634.8 million this week, reflecting cautious sentiment and a risk-averse trend among institutional investors.
In a recent Quicktake analysis, CryptoQuant analyst MorenoDV_ emphasized that the True Market Mean (TMM) indicator — representing the cost basis of circulating coins, excluding “sleeping” coins and miner balances — is acting as an important psychological threshold. If BTC loses the TMM level around $81,500, the market could face a deeper correction and enter a phase of searching for new support levels in the coming months.
Conversely, Grayscale remains optimistic in the medium term. In its 2026 outlook report, the organization suggests that Bitcoin could set a new all-time high as early as the first half of next year, supported by more favorable macroeconomic conditions and increasing clarity regarding the legal framework in the US.
So, what will be the key support and resistance levels that investors need to monitor for Bitcoin and top altcoins? Let’s analyze the charts of the 10 largest cryptocurrencies to find out.
Technical Analysis BTC
Buyers pushed BTC back above the upward trendline on Wednesday, but a long wick indicates selling pressure at higher levels.
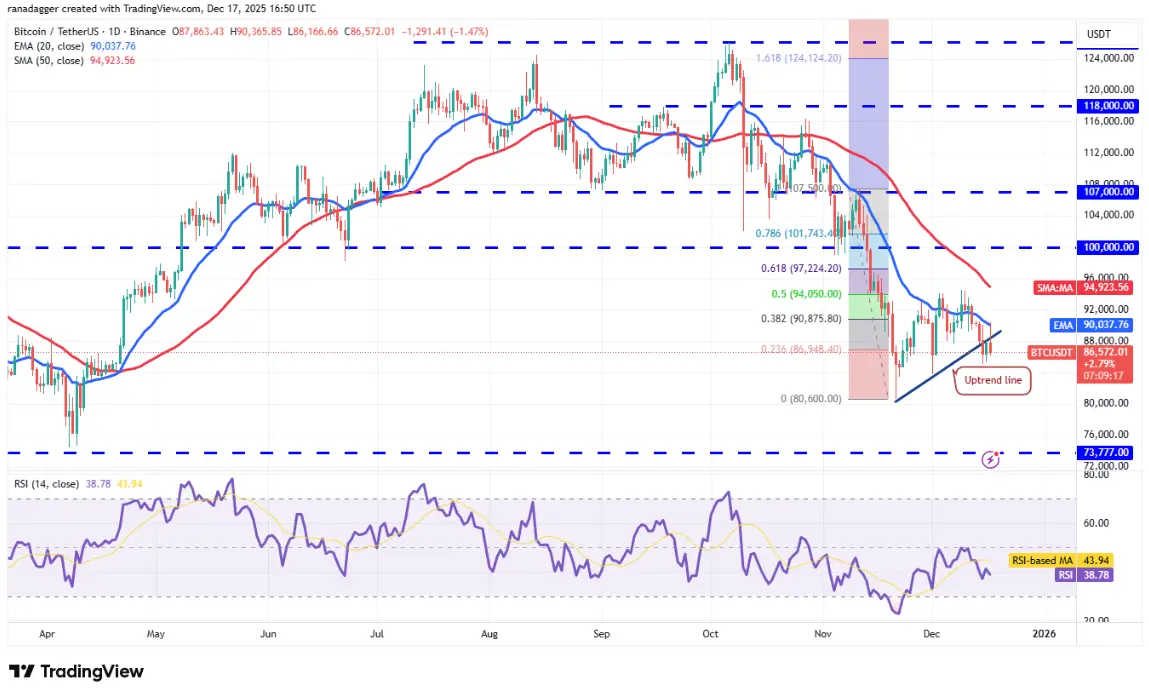 Daily BTC/USDT chart | Source: TradingViewThe bears will attempt to pull the Bitcoin price below the support zone at $84,000. If successful, the BTC/USDT pair could retest the critical level at $80,600. Buyers are expected to defend the $80,600–73,777 zone aggressively.
The first sign of strength will be a break and close above the 20-day exponential moving average (EMA) at $90,037. If that happens, the pair could rise to $94,589 and then reach the psychological level of $100,000.
Technical Analysis ETH
Ether (ETH) bounced from the upward trendline on Tuesday, but the recovery was halted at the 20-day EMA (3,066 USD) on Wednesday.
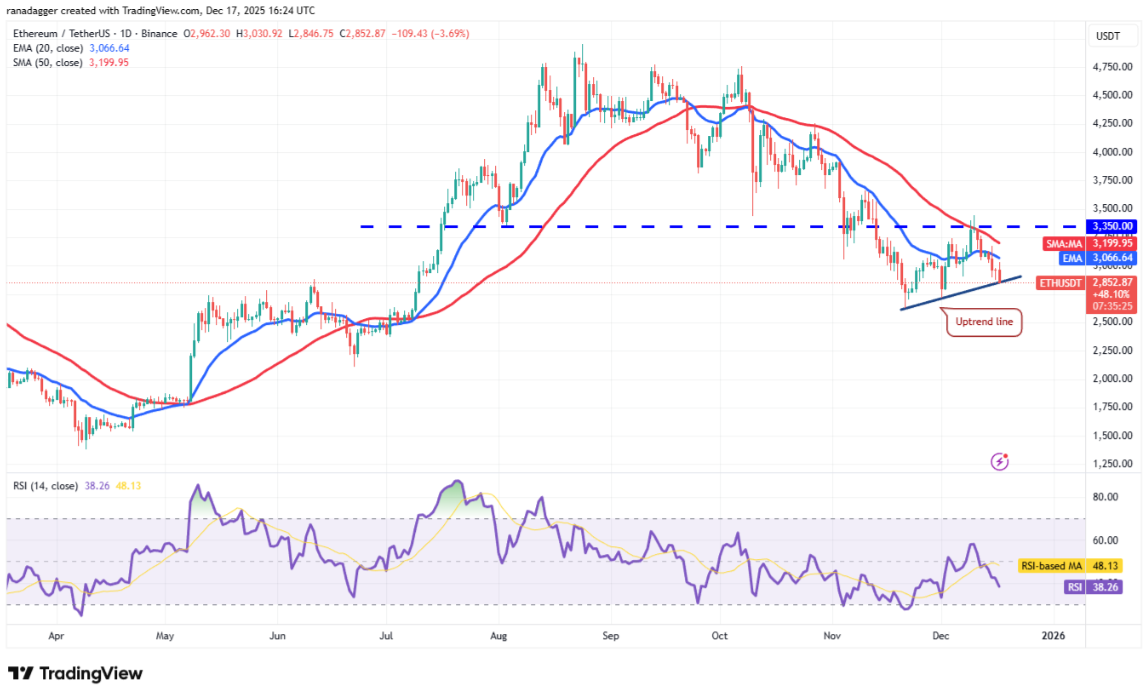 Daily ETH/USDT chart | Source: TradingViewThe bears are trying to strengthen their position by dragging the Ether price below the rising trendline. If successful, the ETH/USDT pair could decline to $2,716 and then to $2,623.
Buyers face a significant challenge. They need to push the Ether price above the resistance zone at $3,350 to signal a short-term trend reversal. If they succeed, the price could accelerate higher to $3,659 and then to $3,918.
Technical Analysis BNB
Buyers attempted to push BNB back above the 20-day EMA (883 USD), but the bears successfully defended this level.
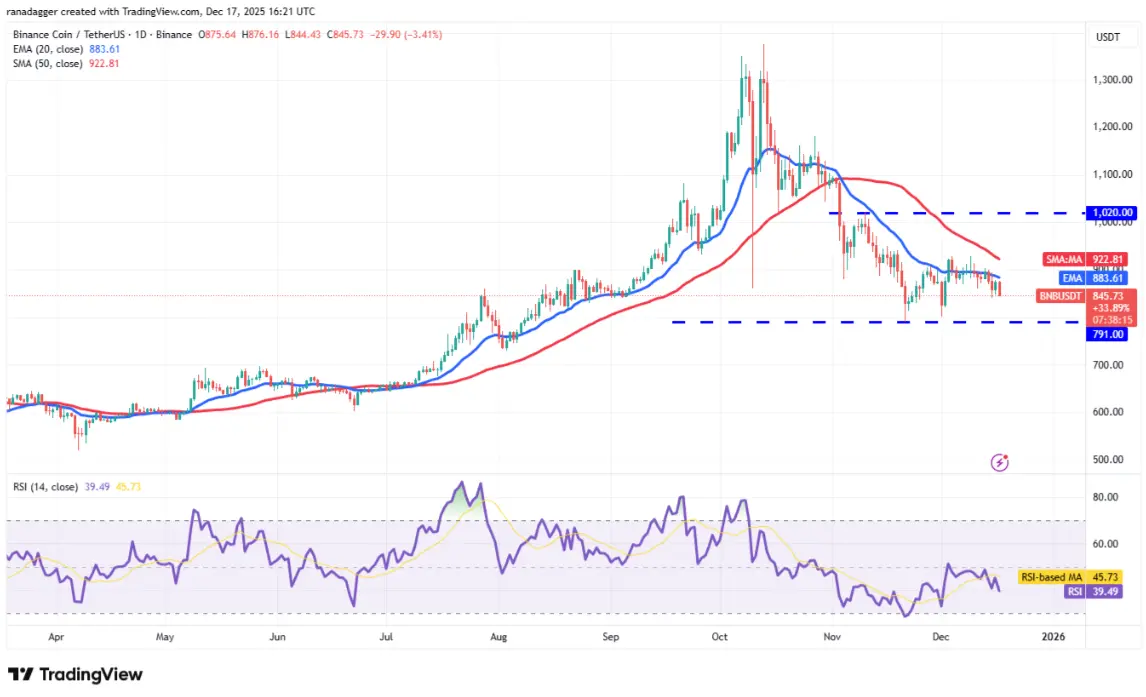 Daily BNB/USDT chart | Source: TradingViewSellers will try to pull the BNB price below $840 and test the important support zone at $791. Buyers are expected to defend the $791 level strongly, because a breakdown could send the BNB/USDT pair plunging to $730.
On the other hand, if the price reverses and moves above the moving averages, it indicates that the pair could continue to fluctuate between $791 and $1,020 for some time. The bulls will regain control if the price closes above $1,020.
Technical Analysis XRP
XRP is gradually sliding toward the support line of the descending channel pattern, reflecting negative market sentiment.
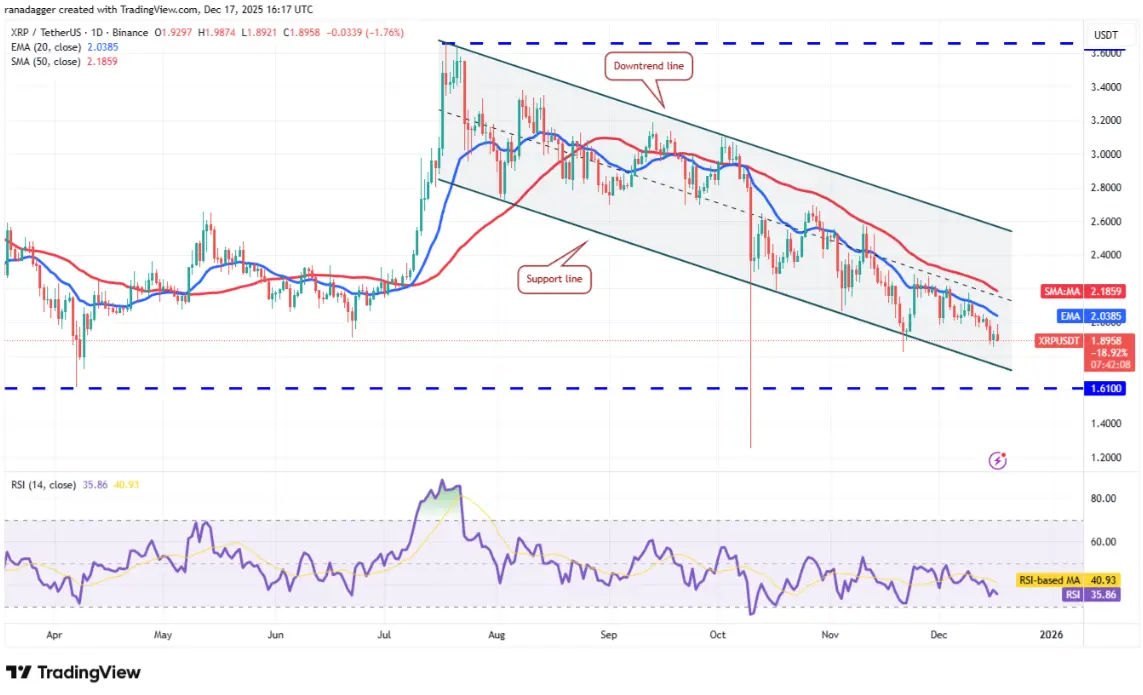 Daily XRP/USDT chart | Source: TradingViewThe bulls are expected to mount a strong defense in the area between the channel’s support line and the $1.61 level. Any rebound could face selling at the 20-day EMA (2.03 USD), followed by the 50-day simple moving average (SMA) at $2.18.
If XRP’s price turns down from the moving averages, the probability of a breakdown below $1.61 increases. In that case, the XRP/USDT pair could plunge to the October 10 low of $1.25. Conversely, a break above the downtrend line would signal a potential trend reversal.
Technical Analysis SOL
The bulls are trying to defend Solana’s support line (SOL), but the weak rebound indicates that the bears are still exerting pressure.
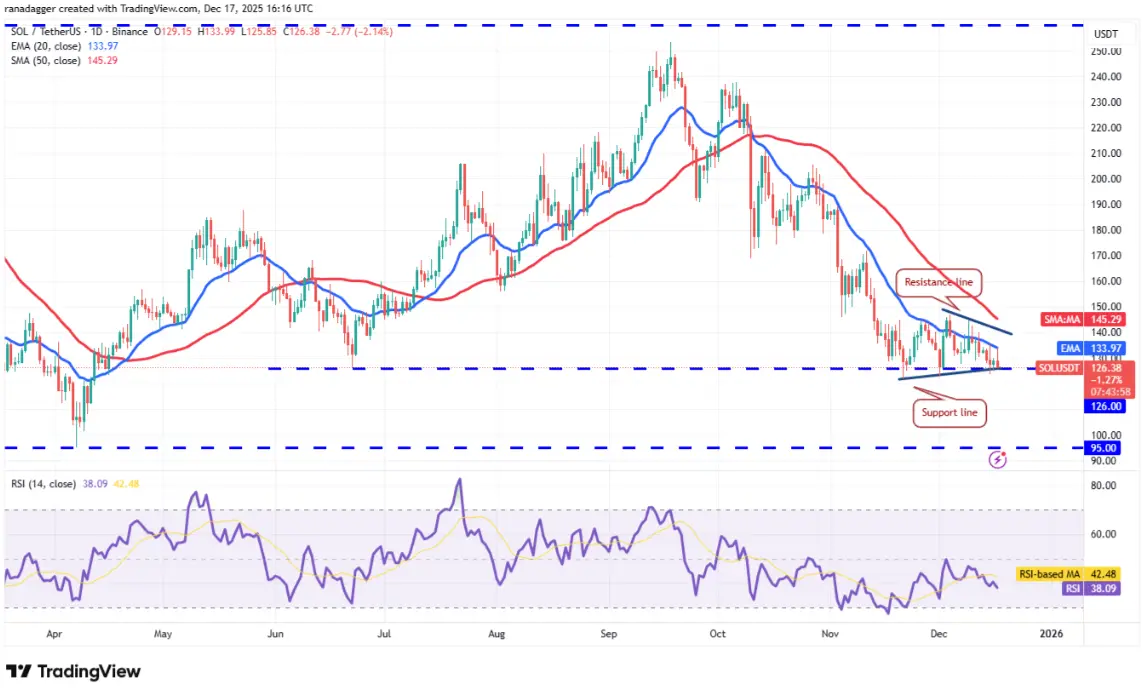 Daily SOL/USDT chart | Source: TradingViewThe 20-day EMA (133 USD) is sloping downwards, and the Relative Strength Index (RSI) is below 39, indicating that the bears are in control. A close below the support line will confirm the continuation of the downtrend. The SOL/USDT pair could then fall to $110 and subsequently to the strong support zone at $95, where buyers are expected to step in.
To regain the advantage, the bulls need to push and sustain the price above the resistance zone. If successful, the pair could rise to $172.
Technical Analysis DOGE
Dogecoin (DOGE) fell below the $0.13 support zone on Monday, signaling the resumption of the downtrend.
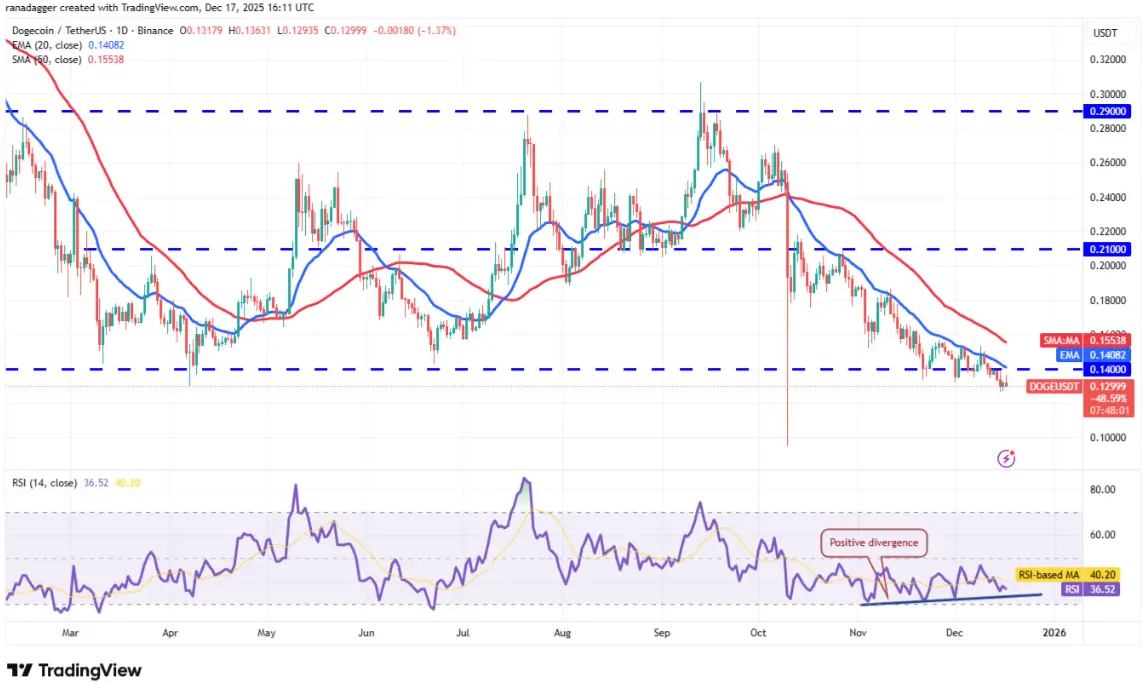 Daily DOGE/USDT chart | Source: TradingViewA minor positive for the bulls is that the RSI is forming a bullish divergence, indicating weakening selling pressure. Buyers need to quickly push and hold the Dogecoin price above the 50-day SMA (0.15 USD) to signal strength. If they succeed, the DOGE/USDT pair could rise to $0.19.
Otherwise, if the price continues to decline or reverses from the $0.14 level, it indicates that the bears still control the market. The pair could then fall sharply to the October 10 low of $0.10.
Technical Analysis ADA
Cardano (ADA) is struggling to bounce from the $0.37 support zone, indicating that the bulls lack sufficient buying interest.
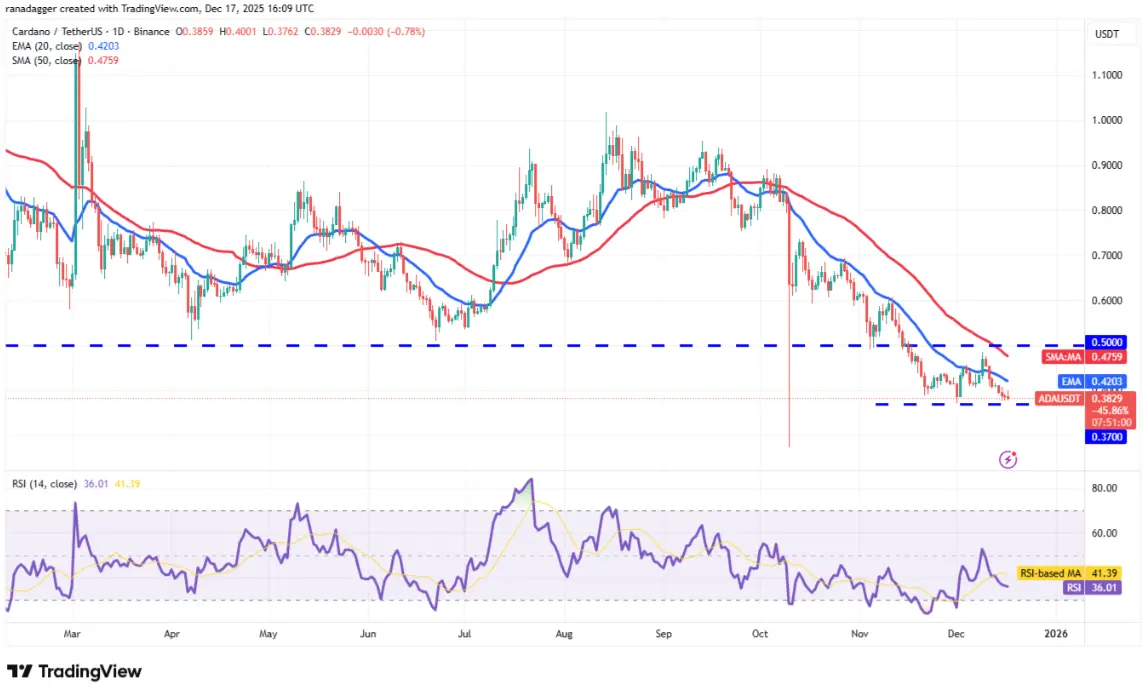 Daily ADA/USDT chart | Source: TradingViewThe bears will try to strengthen their position by dragging ADA below $0.37. If successful, the pair could plunge to $0.32, followed by the October 10 low at $0.27.
Any technical rebound is likely to face selling pressure at the moving averages. To signal a trend reversal, the bulls need to push and sustain the price above the breakout zone at $0.50. If they succeed, the pair could rise to $0.61.
Technical Analysis BCH
Bitcoin Cash (BCH) bounced from the 50-day simple moving average (SMA) at $534 on Tuesday. On Wednesday, the bulls are trying to keep the price above the 20-day exponential moving average (EMA) at $558.
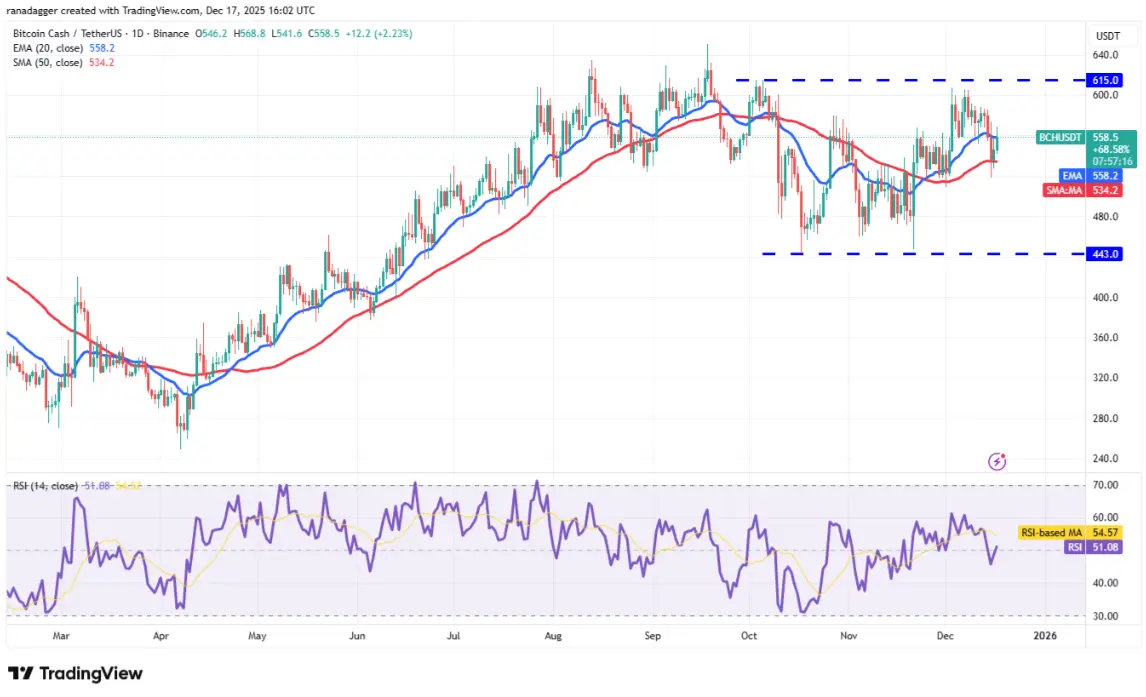 Daily BCH/USDT chart | Source: TradingViewIf the price cannot sustain above the 20-day EMA, the bears will continue to attempt to push BCH/USDT below the 50-day SMA. If that happens, Bitcoin Cash could decline below the support zone at $508. This scenario suggests the market may continue to fluctuate between $443 and $615 for some time.
Conversely, a close above the 20-day EMA indicates positive sentiment. The bulls will then try to push the pair higher toward the resistance zone at $615.
Technical Analysis HYPE
Buyers are attempting to initiate a recovery for Hyperliquid (HYPE), but the upward momentum is likely to face strong selling pressure near the 20-day EMA at $30.26.
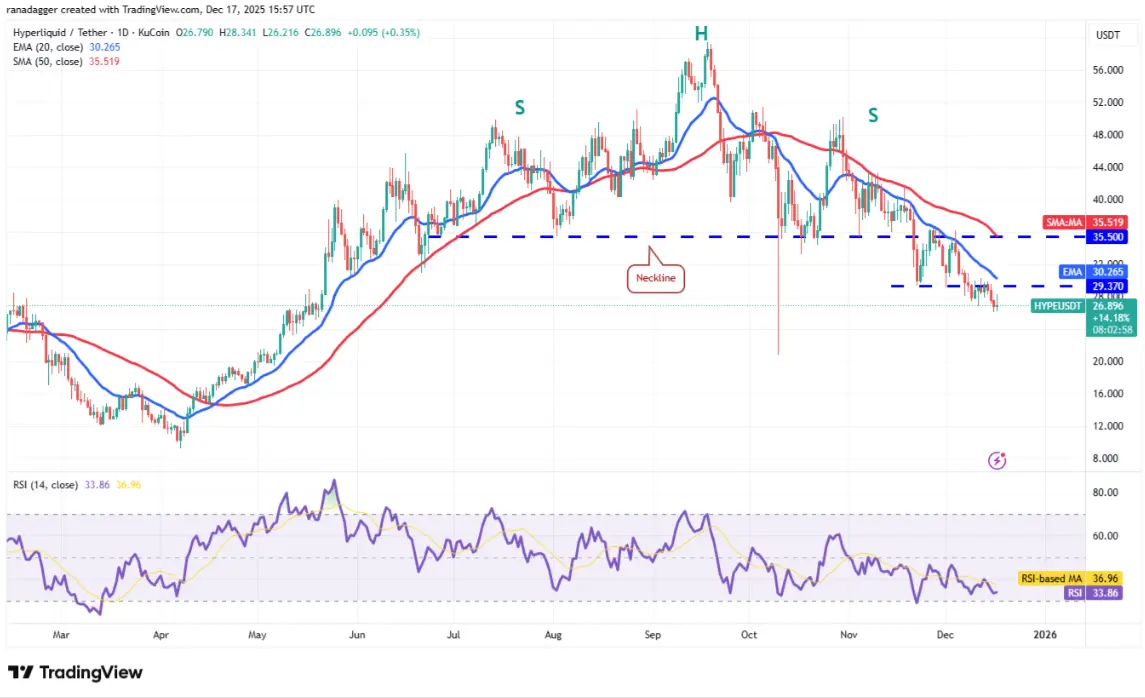 Daily HYPE/USDT chart | Source: TradingViewIf the price reverses downward from the 20-day EMA, the HYPE/USDT pair could resume its decline. The price could then slide back to $24 and subsequently to the October 10 low of $20.82.
On the other hand, if the price reverses upward and breaks above the 20-day EMA, it indicates weakening selling pressure. The pair could then rise toward the key breakout zone at $35.50 — a critical level to watch. If the bulls manage to surpass this resistance, the downtrend could be over.
Technical Analysis LINK
Chainlink (LINK) is trading below the moving averages, increasing the likelihood of a decline toward the support zone at $10.94.
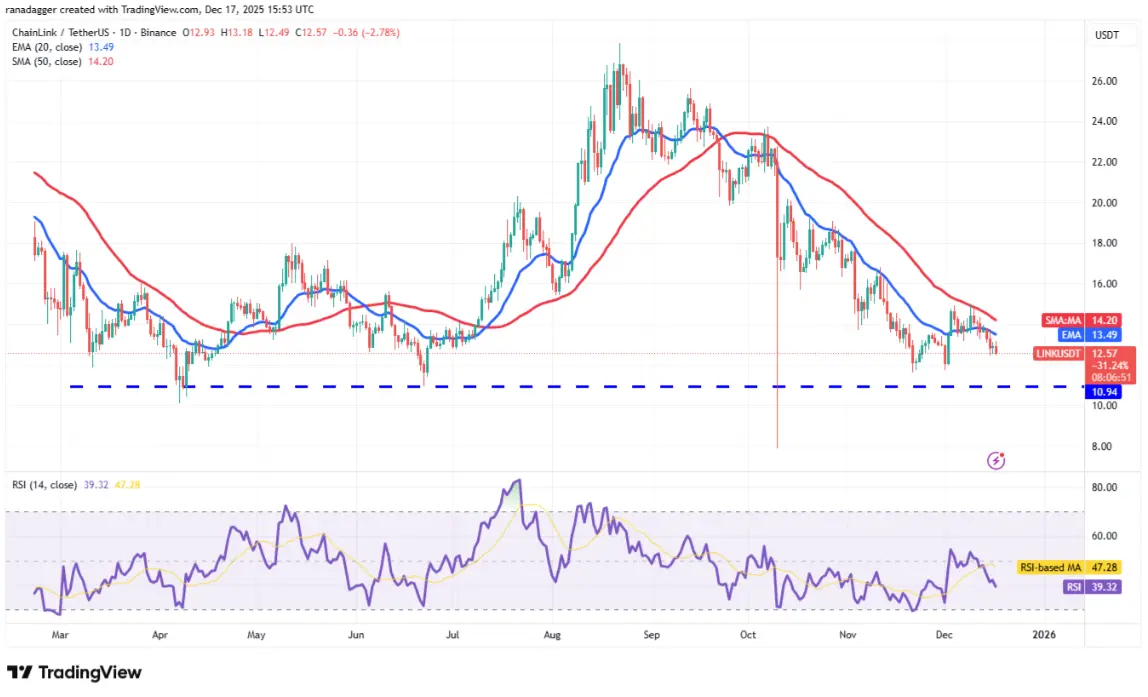 Daily LINK/USDT chart | Source: TradingViewBuyers are expected to defend the $10.94 level strongly, but technical rebounds are likely to face selling at the moving averages. If the price reverses downward from these levels, the LINK/USDT pair could plunge to the October 10 low of $7.90.
Alternatively, if Chainlink’s price bounces from the current zone or from the support at $10.94 and breaks above $15, it indicates that demand is emerging at lower levels. The pair could then rise to $16.80.