Terra (LUNA), MemeCore (M), and XDC Network (XDC) stand out as the top performers in the past 24 hours. LUNA leads with an impressive breakout of 40%, while MemeCore and XDC continue their positive momentum on Thursday, following gains of 6% and 3% respectively from the previous session. However, technically, all three altcoins are approaching key resistance zones – a factor that could temporarily hinder the current rebound.
Terra’s Uptrend Reaches Critical Resistance Zone
At the time of writing on Thursday, Terra is trading around $0.2002, experiencing nearly 100% growth in just one week. This strong breakout aims to close a clear candle above the July high at $0.1990 — a signal that could open up opportunities to conquer the important resistance area at $0.2490 (May’s peak).
Terra’s remarkable recovery, along with Luna Classic, is likely driven by the testimony of Do Kwon on Thursday, combined with a new network upgrade aimed at improving security, optimizing functions, and increasing stability across the Terra ecosystem.
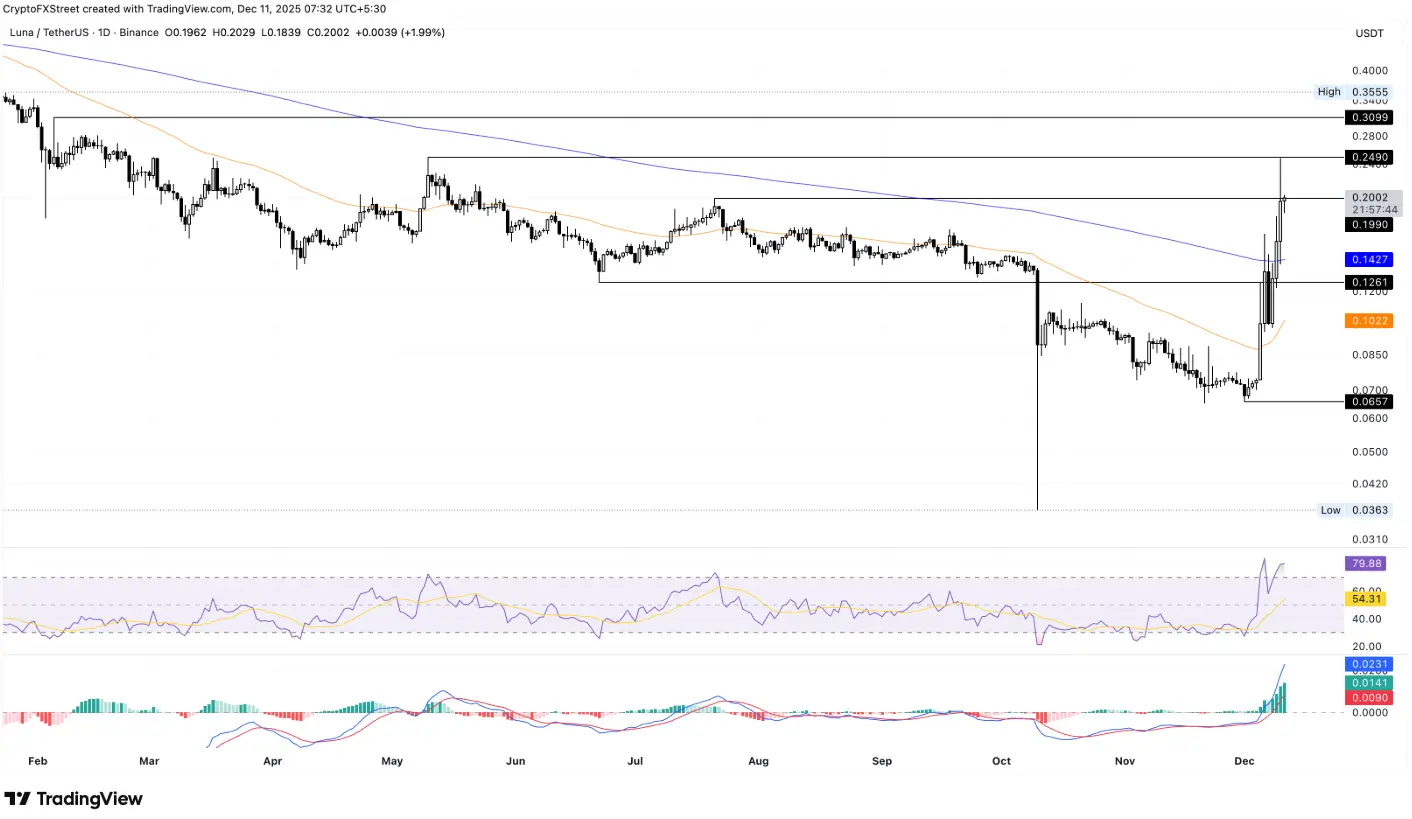 Daily LUNA/USDT chart | Source: TradingViewOn the daily chart, the RSI indicator reaches 79, indicating an overbought market, which suggests that current buying momentum may lack sustainability. However, the MACD remains bullish with a widening green histogram, reflecting ongoing upward momentum.
Conversely, if Terra fails to hold above $0.2000, the price could revisit the 200-day EMA at $0.1427.
MemeCore aims for double bottom breakout
MemeCore continues to stay green in Thursday’s session, marking a third consecutive day of recovery. This week alone, the M token has increased by nearly 16%, after a 6% jump on Wednesday.
The steady recovery suggests the formation of a double bottom pattern (double bottom) around the support zone of $1.25, with the neckline (neckline) at the November 29 peak of $1.52. If M closes above this level, the bullish trend could extend to the 50-day EMA at $1.77, and potentially toward the Pivot R1 at $2.56.
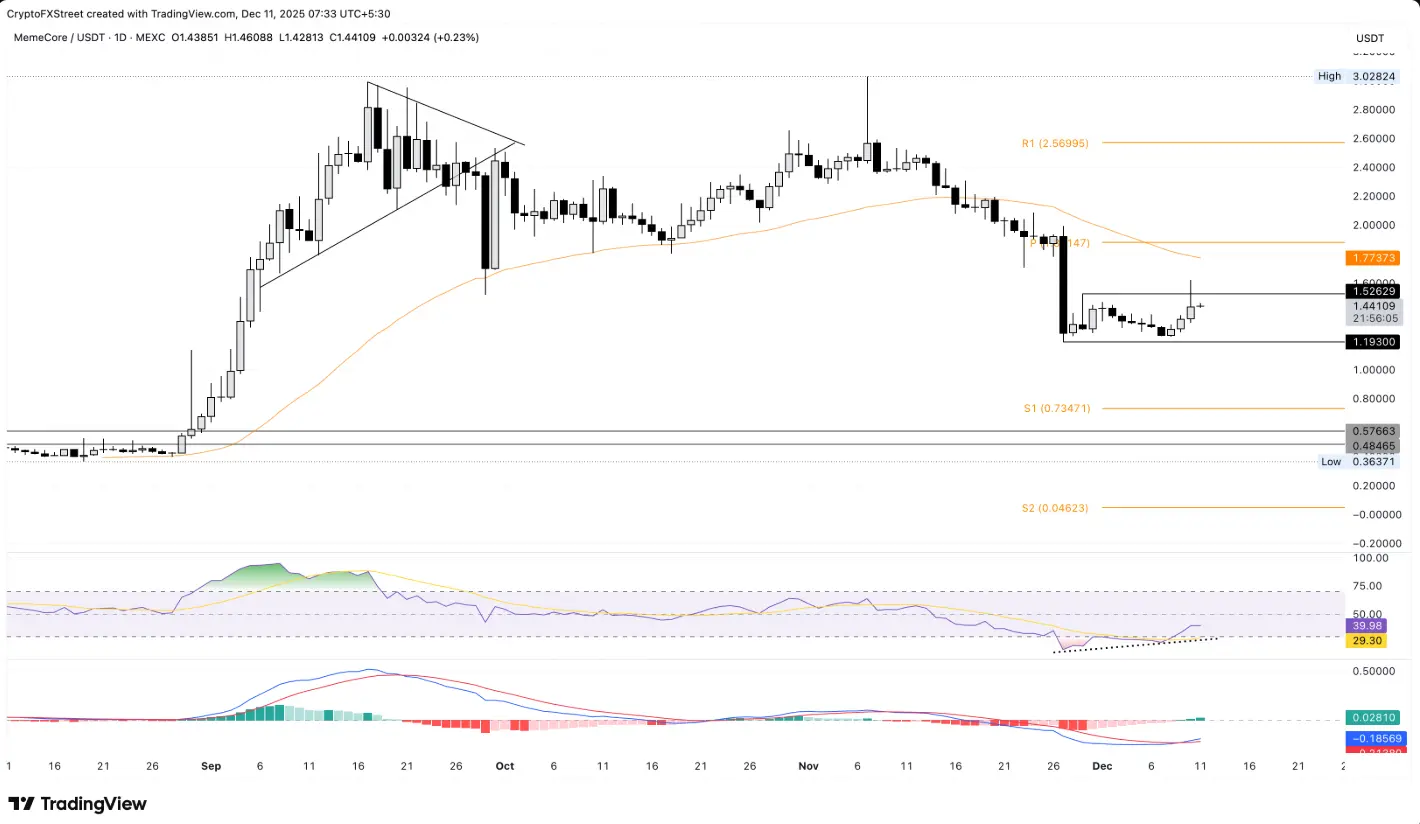 Daily M/USDT chart | Source: TradingView RSI is currently at 39 and rising from oversold territory, indicating a bullish divergence and reinforcing the reversal signal from the double bottom pattern — thereby increasing the likelihood of a new upward trend.
Additionally, the MACD supports the bullish outlook, as it crossed above the signal line on Tuesday, expanding buy signals for MemeCore and indicating strengthening bullish momentum.
XDC Network Faces Challenges at Key Psychological Level
XDC Network experienced a nearly 1% decline at the time of writing on Thursday, following a 3% rebound the previous day. The correction kept XDC below the psychological level of $0.05000 and failed to break above the long-term resistance line connecting the peaks on July 29 and October 6.
To resume its upward trend, XDC needs a clear breakout above $0.05000 before testing the next resistance zone at $0.05200. However, two major hurdles remain ahead: the 50-day EMA at $0.05502 and Pivot R1 at $0.06141.
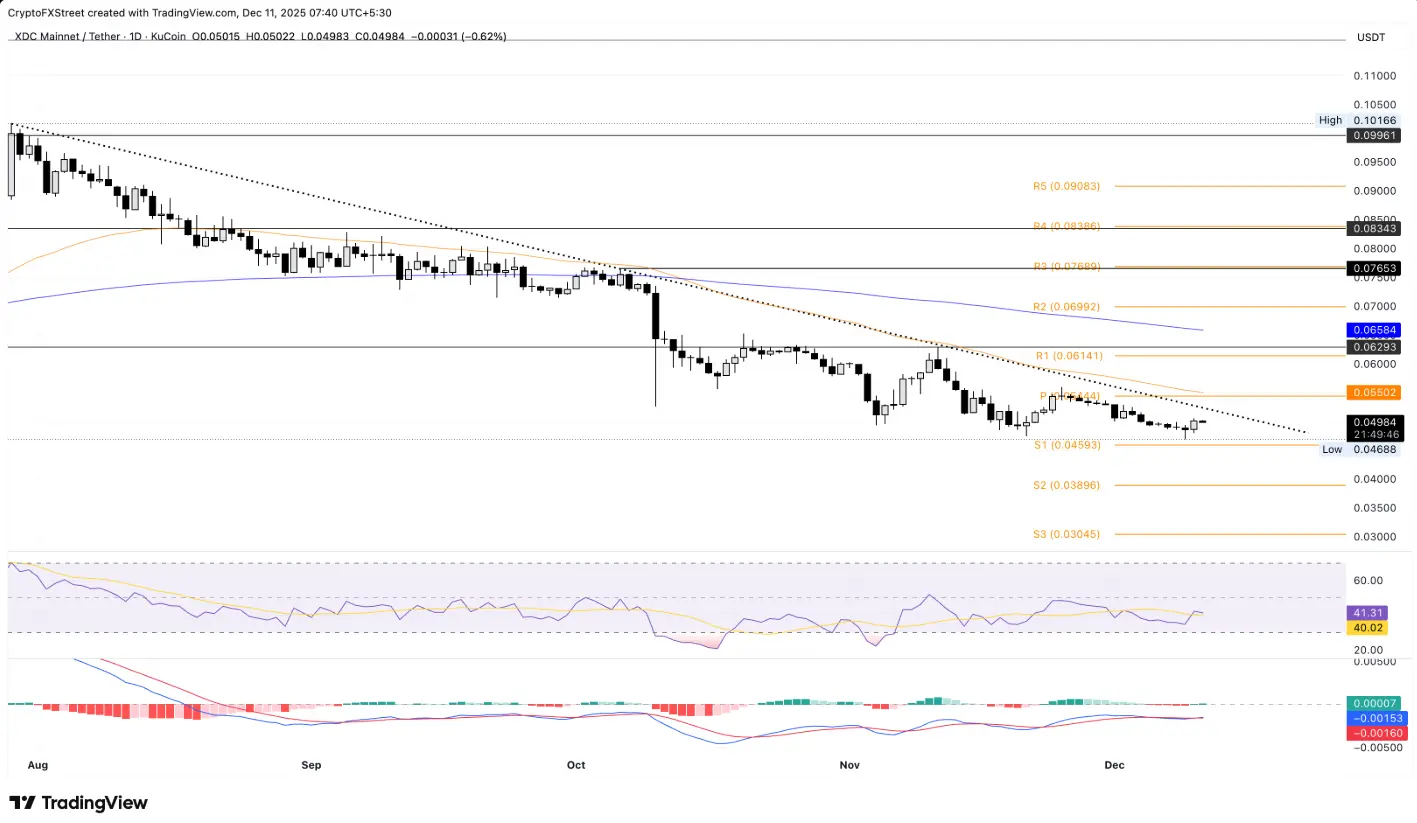 Daily XDC/USDT chart | Source: TradingViewFrom a technical perspective, the RSI at 41 is gradually moving toward oversold territory, reflecting persistent downward pressure. Conversely, the MACD indicates a positive signal with a bullish crossover — suggesting a potential recovery.
In a negative scenario, if XDC loses support at Pivot S1 (0.04593 USD), the price could continue to drop toward Pivot S2 at $0.03896.
Disclaimer: The information on this page may come from third parties and does not represent the views or opinions of Gate. The content displayed on this page is for reference only and does not constitute any financial, investment, or legal advice. Gate does not guarantee the accuracy or completeness of the information and shall not be liable for any losses arising from the use of this information. Virtual asset investments carry high risks and are subject to significant price volatility. You may lose all of your invested principal. Please fully understand the relevant risks and make prudent decisions based on your own financial situation and risk tolerance. For details, please refer to
Disclaimer.
Related Articles
XRP Today’s News: Institutional funds return, circulating inflow of 120 million exceeds Bitcoin
This week, XRP recorded a $119.6 million capital inflow, setting the highest mark since 2025 and becoming a major beneficiary in the crypto market. This round of funds returning was mainly driven by greater clarity in regulatory policy and XRP’s real-world use in cross-border payment infrastructure. Technically, it shows an initial recovery, but overall it is still in a downward channel. The support and resistance levels are $1.31 and $1.40, respectively; if it breaks through, it is expected to reach $1.50.
MarketWhisper1h ago
XRP drops to $1.33, with $3.32 million in ETF inflows still failing to reverse the downtrend; the key support to watch is $1.28
In April 2026, the XRP price pulled back to $1.33, down about 4%. Although there was capital inflow into Ripple-related products, selling pressure dominated the market, and increased trading volume signaled distribution. Declining liquidity further heightens volatility risk; watch the $1.33 support—if it breaks, prices will likely fall further. For a short-term rebound, it needs to break above $1.35; otherwise, it should remain in a weak range-bound consolidation.
GateNews1h ago
XRP Price Structure Signals More Downside — Key Levels to Watch
XRP fails to make new highs, confirming bearish market structure remains intact.
Price targets $1.13, $1.08, and potentially $0.87 support levels.
Traders should wait for confirmation instead of reacting to short-term price moves.
Short bursts of green candles can quickly shift market
CryptoNewsLand1h ago
Bitcoin is hovering around the $700,000 level; if oil prices fall below $100 or push toward $80,000
Bitcoin has recently been trading in a high-level range. The price rebounded from $67,000 to $70,900, driven by a U.S.-Iran ceasefire agreement. Market analysis suggests that weakness in oil prices—or easing inflation pressure—may support Bitcoin’s upside. If it breaks above $72,500, it could trigger short liquidations and push the price up to $80,000. However, instability in the Middle East and a rebound in oil prices could act as a drag. Volatility in the energy market will be a key factor influencing Bitcoin’s direction.
GateNews1h ago
Tom Lee: The stock market often hits bottom early in a war, bullish on Ethereum and tech stocks
Well-known analyst Tom Lee said in an interview that despite the U.S.-Iran conflict and rising oil prices, the stock market did not fall, showing that the market has strong resilience. He believes that most S&P constituents have undergone significant adjustments, that the worst-case scenario for the overall market may already be behind us, and that there is room for upside from here. He is bullish on Ethereum as well as technology, industrial, and mid- and small-cap stocks.
GateNews2h ago
Michael Saylor: Bitcoin may have already hit bottom, but quantum risks have been exaggerated
Strategy Executive Chairman Michael Saylor believes Bitcoin hit its bottom around $60,000 this February, because all forced sellers in the market have already exited. He said that the catalyst for the next bull market will be a bitcoin-based banking credit system, while he believes the threat from quantum computing is being exaggerated, and he pointed out that the technical community has enough time to deal with this threat.
MarketWhisper5h ago
