How to Use the Continuation Pattern—Rectangle Pattern
Gate Learn's intermediate-level futures series helps users build a structured framework for technical analysis, covering candlestick basics, chart patterns, moving averages and trendlines, as well as the application of technical indicators. In this lesson, we will explain the application of the consolidation pattern—the rectangle pattern—including the concept, characteristics, real BTC trading examples, and key considerations.
What Is a Rectangle Pattern
A rectangle pattern forms when the price repeatedly finds support at the same horizontal level during pullbacks and encounters resistance at the same horizontal level during rallies. Connecting these highs and lows creates a rectangular structure, as shown below:
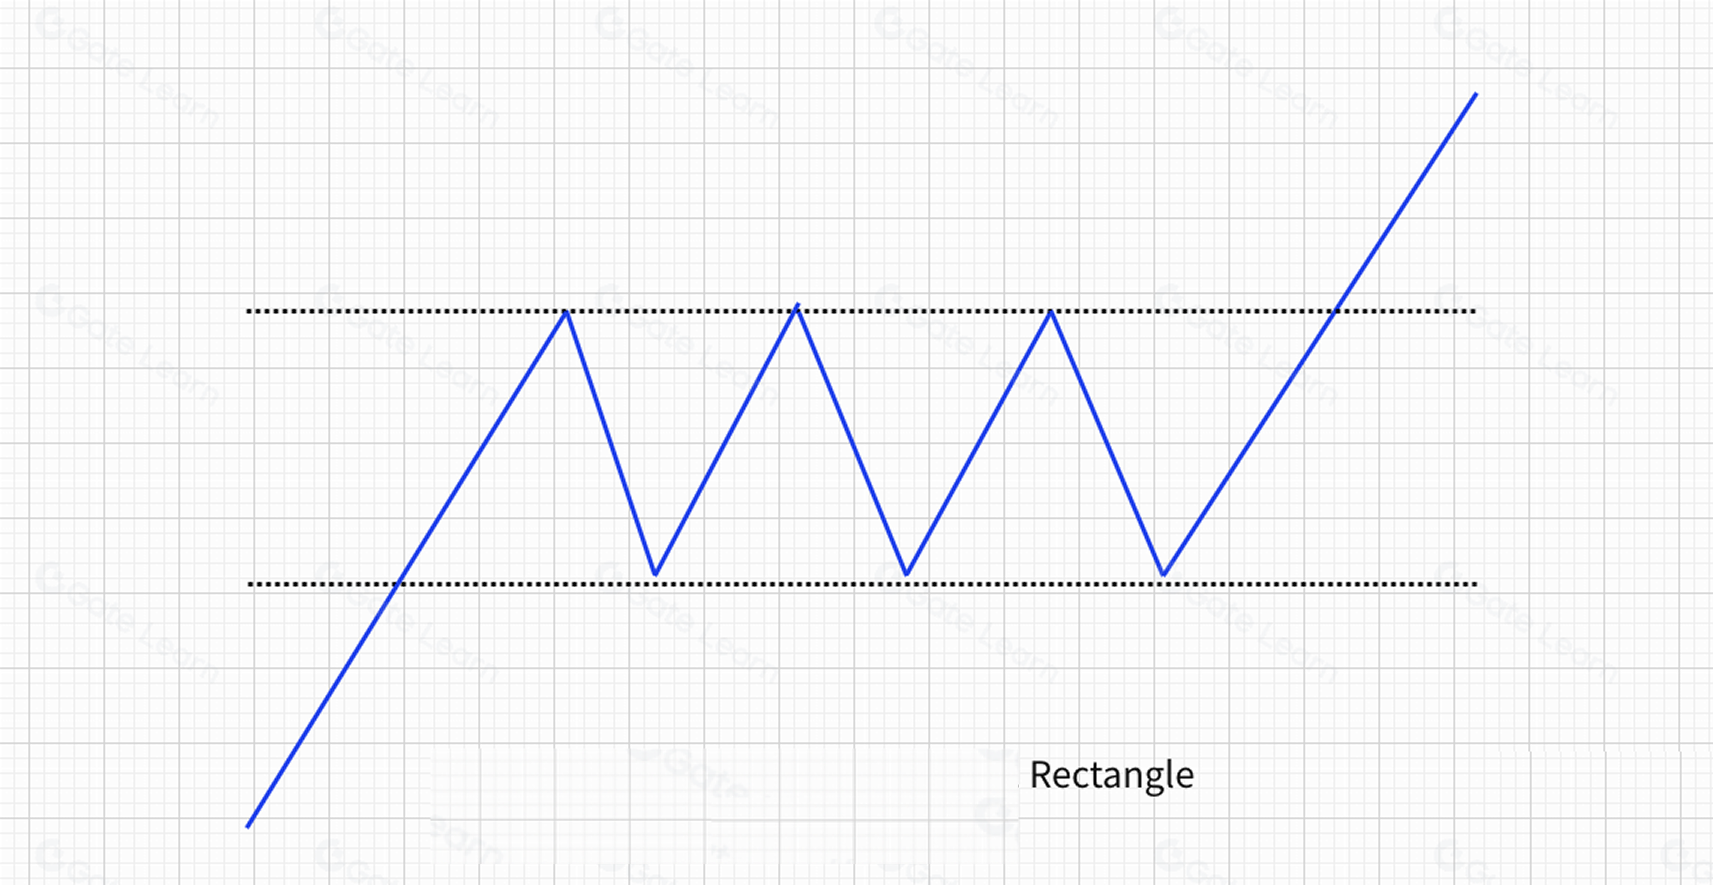
How to Identify a Rectangle Pattern
- It frequently appears in the middle of an uptrend or downtrend, and less often at major bottoms or tops.
- The price moves back and forth within a parallel range, with resistance above and support below.
- Trading volume increases during upward moves and declines during pullbacks, while overall volume gradually contracts over time.
- The rectangle pattern is considered complete once the price breaks above the upper boundary or below the lower boundary. The direction of the breakout usually indicates the direction of the subsequent move.
- A valid breakout is typically defined as a move exceeding 3% beyond the boundary line.
Technical Implications of a Rectangle Pattern
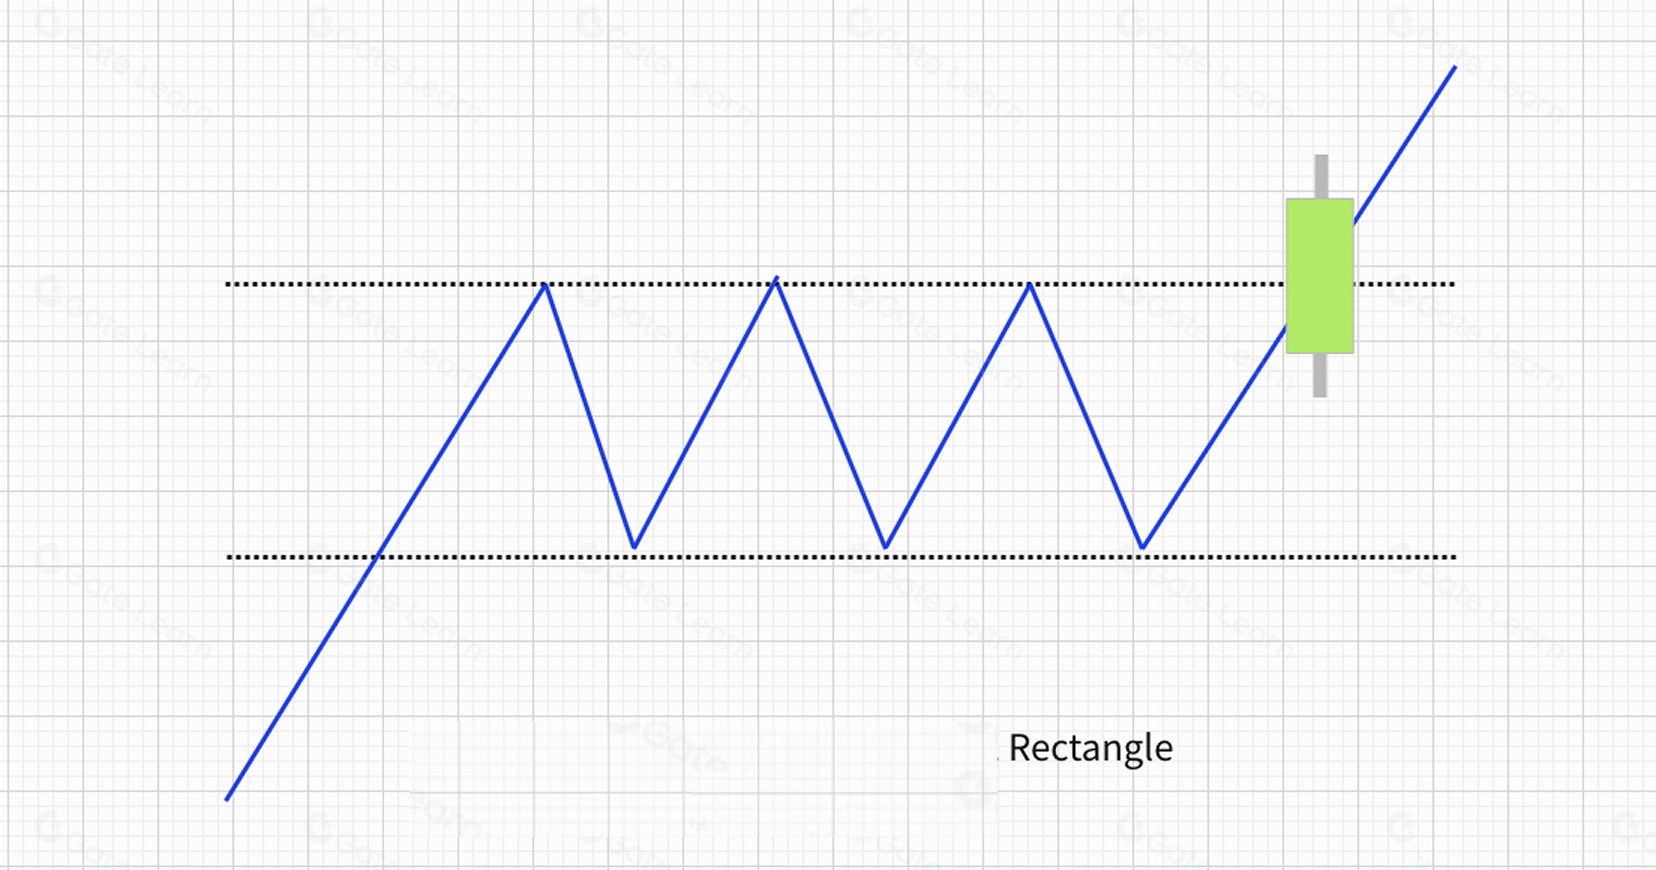
A rectangle that forms during an uptrend often breaks to the upside. A breakout above the upper boundary signals continued bullish momentum and a buy opportunity.
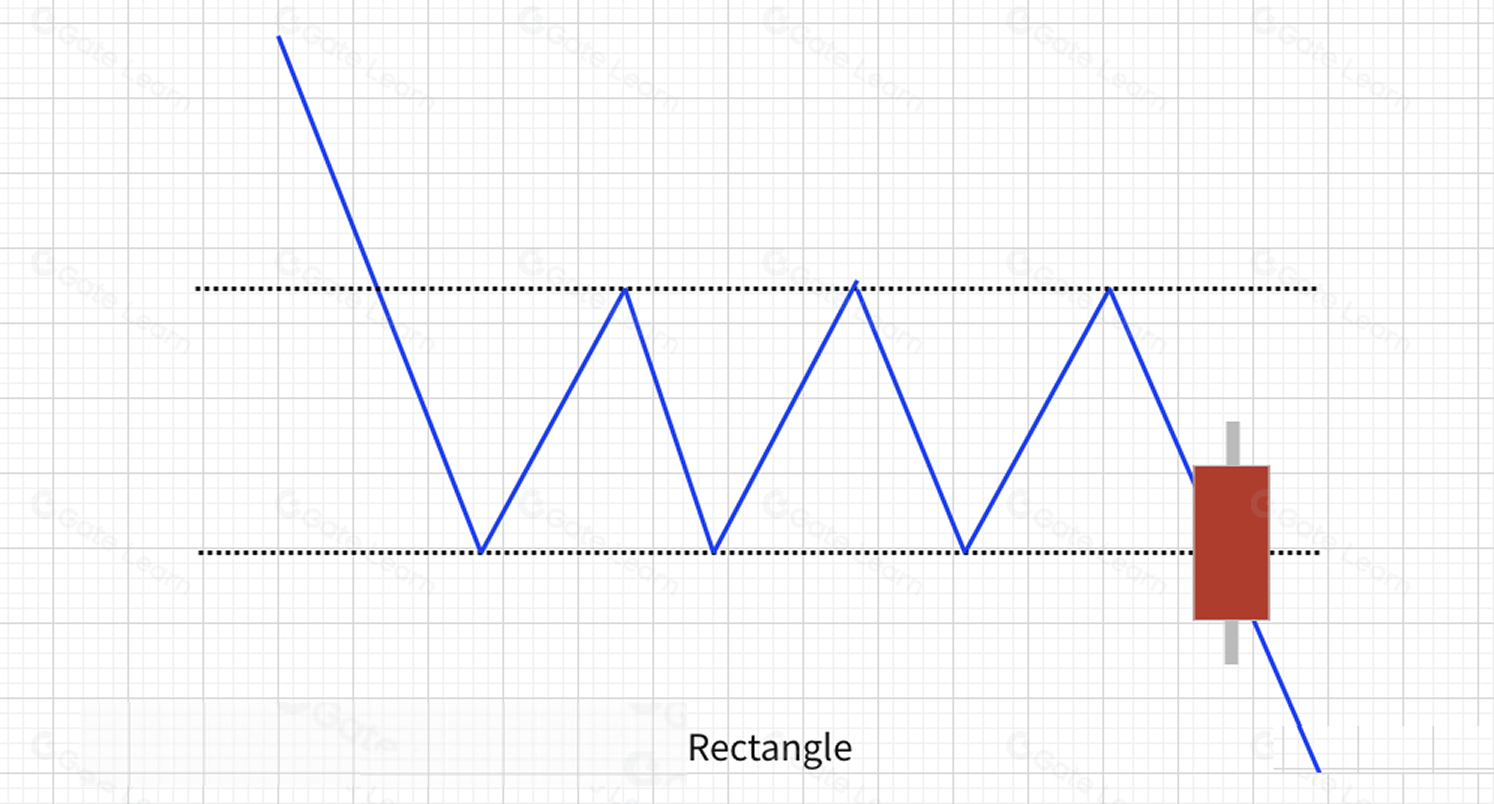
A rectangle that forms during a downtrend often breaks to the downside. A breakdown below the lower boundary signals continued bearish momentum and a sell opportunity.
Applications of the Rectangle Pattern
When a rectangle forms during an uptrend, it typically breaks upward. A breakout above the upper boundary suggests further upside and a buying opportunity.
When a rectangle forms during a downtrend, it typically breaks downward. A breakdown below the lower boundary suggests continued downside and a selling opportunity.
Real-Market Examples
- Bullish Breakout from a Rectangle
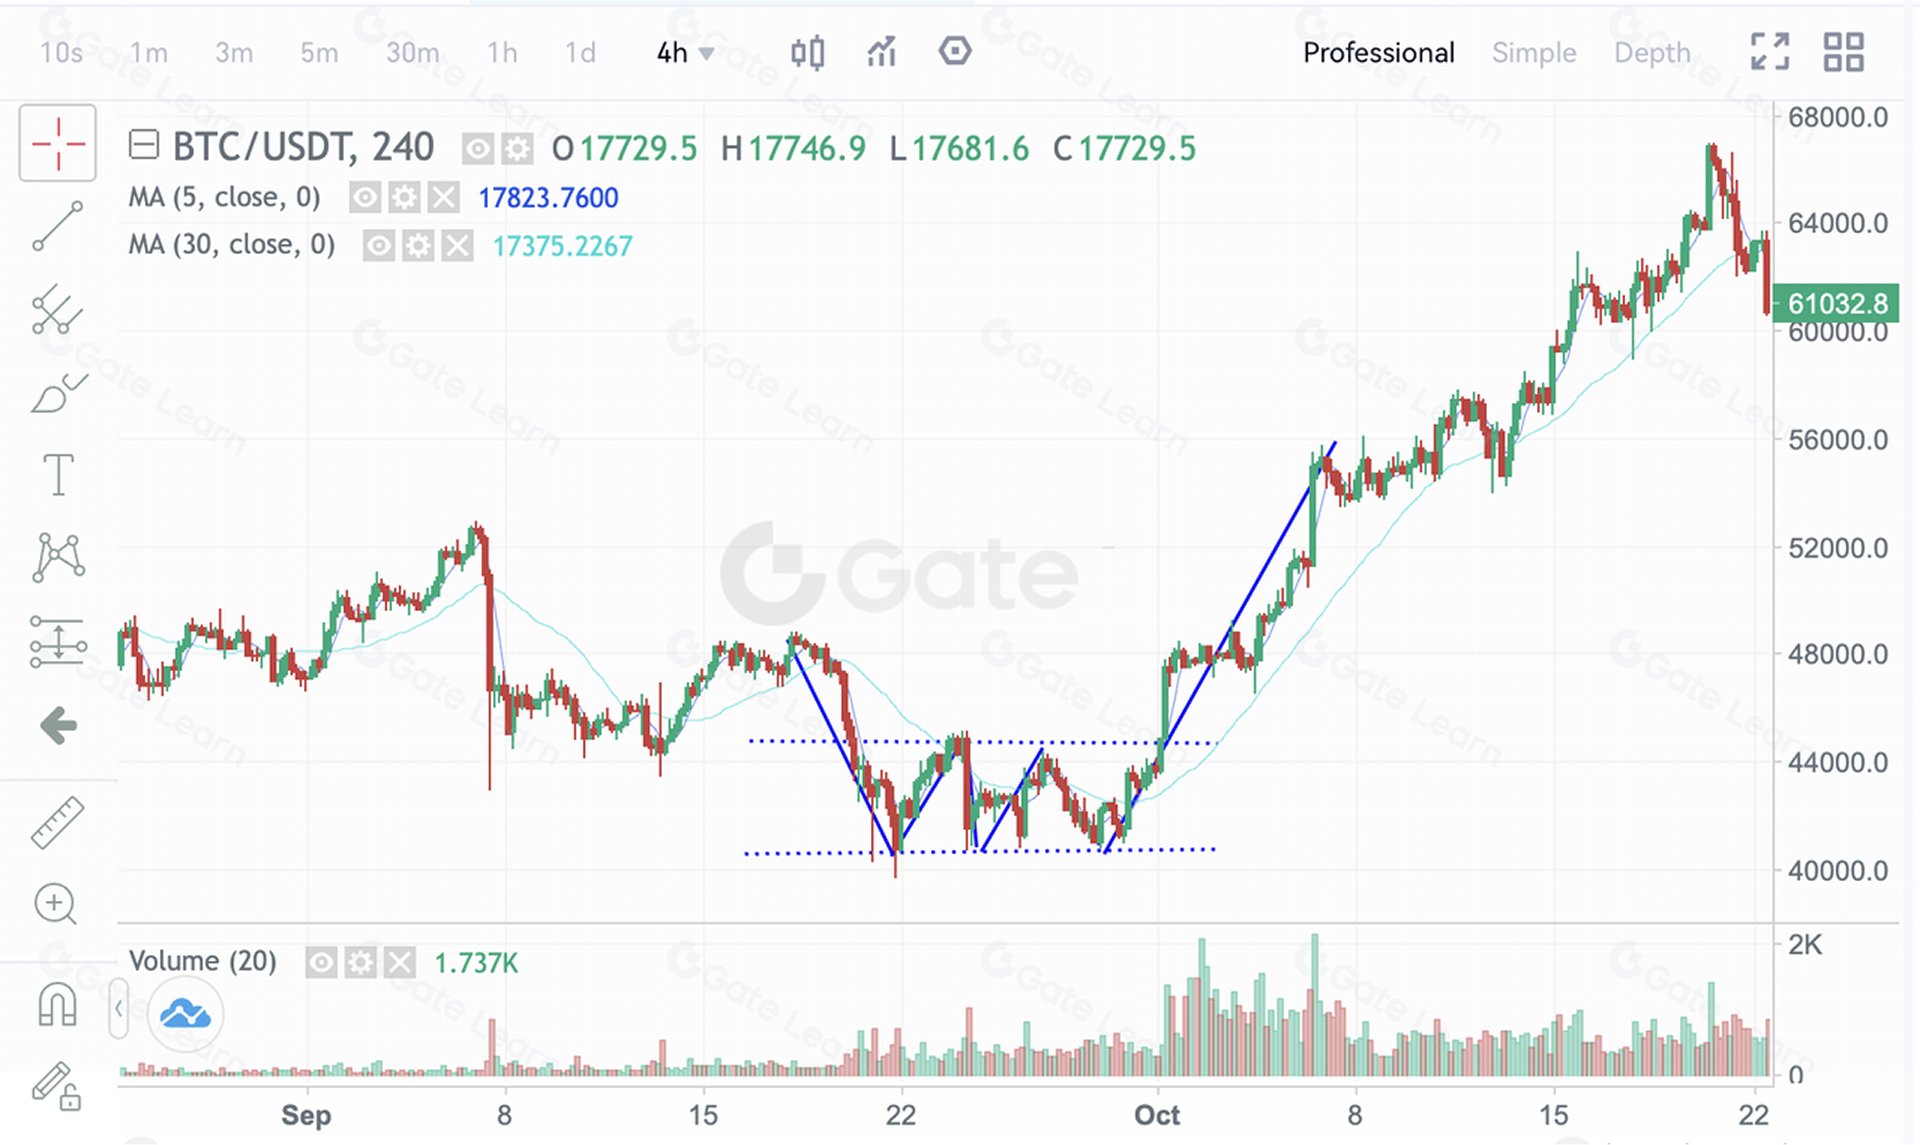
This figure above shows the BTCUSDT 4-hour chart on Gate futures from September 19 to October 1, 2021. BTC fell from $48,000 to $40,000 and then oscillated between $40,650 and $44,670. This range formed a rectangle pattern. When the price broke above the upper boundary at $44,670, a new upward trend began, eventually rising above $66,000, with an impressive gain of 47.7%.
- Bearish Breakdown from a Rectangle
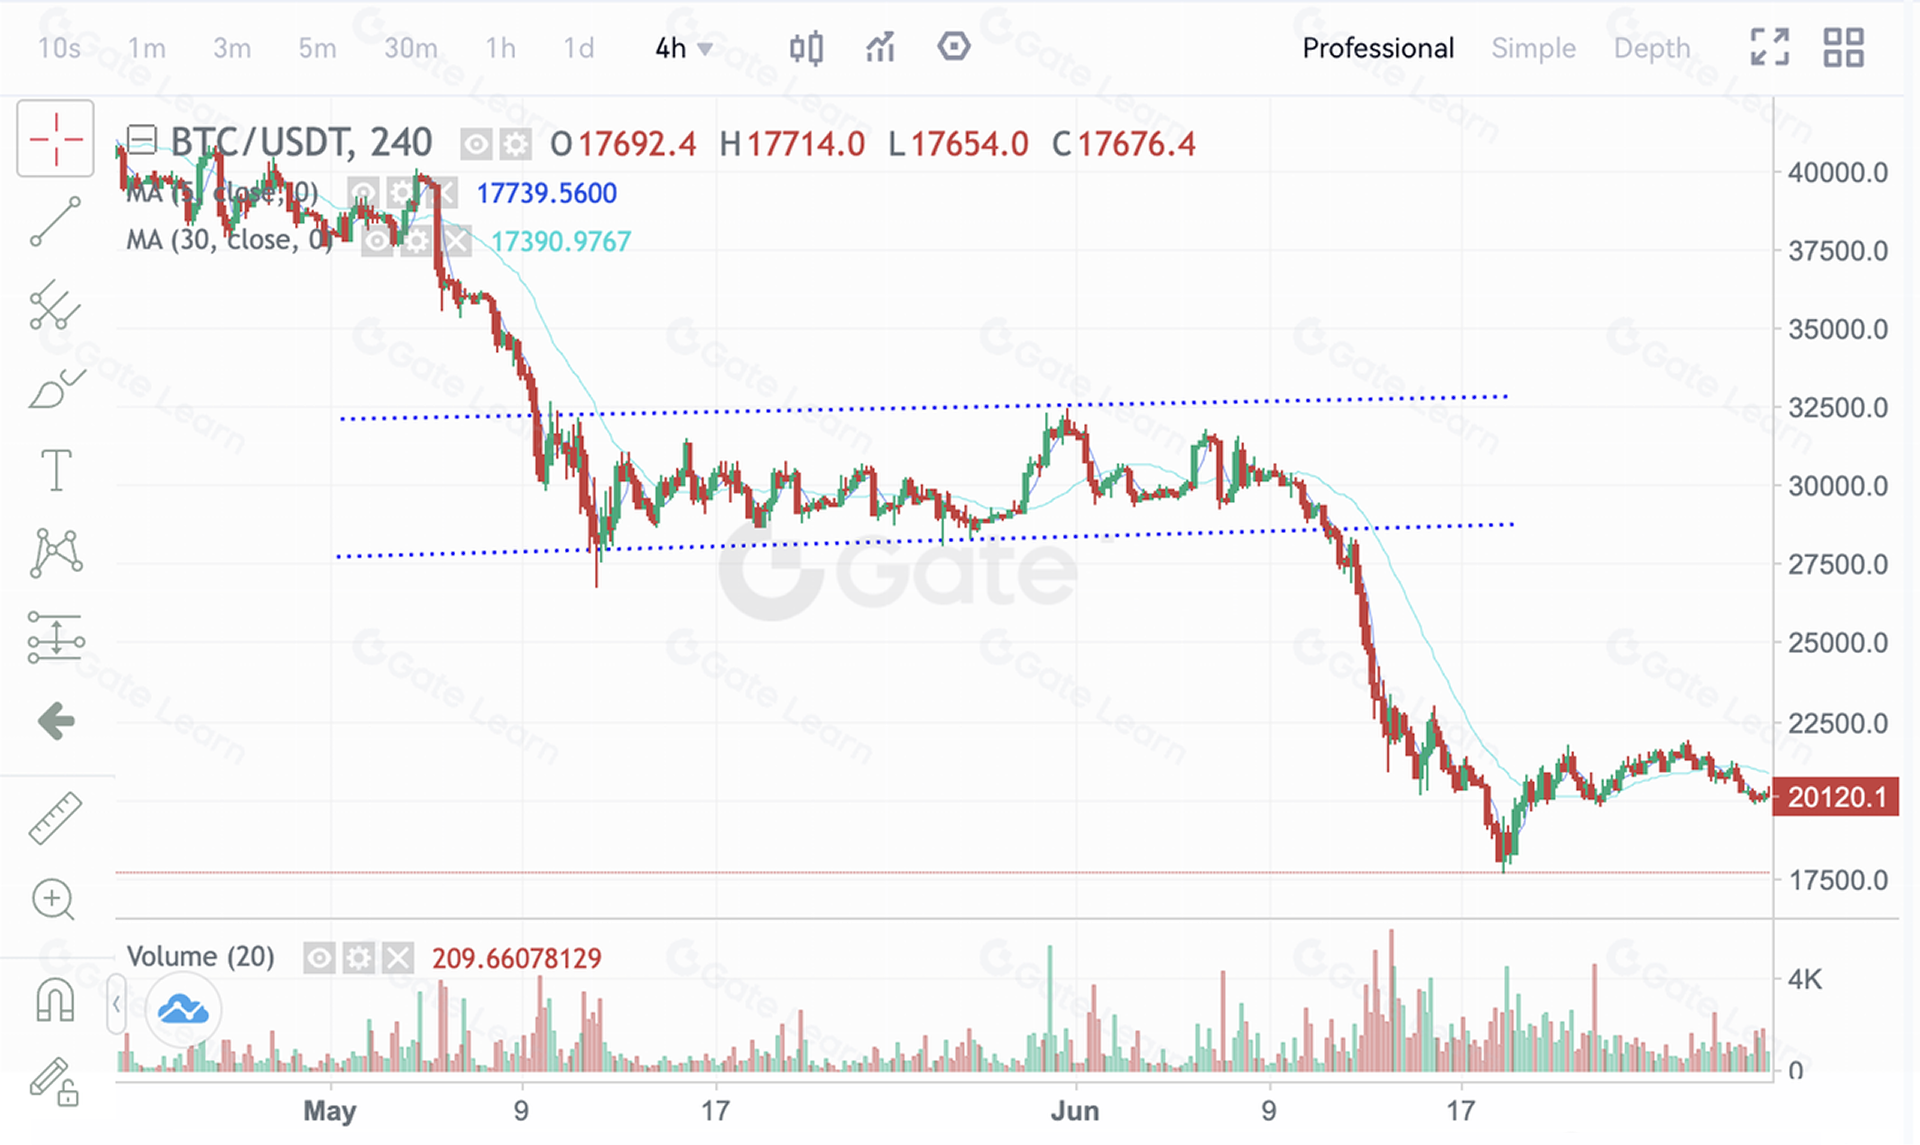
This figure above shows the BTCUSDT 4-hour chart on Gate futures from May 19 to June 11, 2022. After dropping rapidly from $39,000 to $26,000, BTC moved sideways between $28,000 and $32,000, forming a rectangle pattern. Once the price broke below the lower boundary at $28,500, it triggered a sharp decline, eventually bottoming near $18,000, with a drop of more than 40%.
Summary
If a rectangle happens to form at a market top or bottom, it can also resemble a rounding top or rounding bottom. In such cases, the pattern often signals a potential trend reversal in the following market move.
For more futures trading content, visit Gate futures and sign up to start your trading journey.
Disclaimer
This article is for reference only. Information provided by Gate does not constitute investment advice and Gate is not responsible for your investment decisions. Technical analysis, market judgment, trading strategies, and trader insights may involve potential risks, investment variability, and uncertainties. Nothing in this article guarantees returns or implies risk-free opportunities.
Lesson 1:What Is Technical Analysis in the Crypto Market?
Lesson 2:Common Bullish Candlestick Patterns
Lesson 3:Common Bearish Candlestick Patterns
Lesson 4:Bottom Reversal Pattern—Head and Shoulders Bottom
Lesson 5:How to Use the Top Reversal Pattern—Head and Shoulders Top
Lesson 6:How to Use the Bottom Reversal Pattern—Rounding Bottom
Lesson 7:How to Use the Top Reversal Pattern—Rounding Top
Lesson 8:How to Use the Bottom Reversal Pattern—Double Bottom (W-Shape)
Lesson 9:How to Use the Top Reversal Pattern—Double Top (M-Shape)
Lesson 10:How to Use the Bottom Reversal Pattern—V-Shaped Reversal
Lesson 11:How to Use the Consolidation Pattern—Ascending Triangle
Lesson 12:How to Use the Continuation Pattern—Descending Triangle
Lesson 13:How to Use the Continuation Pattern—Other Triangle Patterns
Lesson 14:How to Use the Continuation Pattern—Flag Pattern
Lesson 15:How to Use the Continuation Pattern—Wedge Pattern
Lesson 16:How to Use the Continuation Pattern—Rectangle Pattern
Lesson 17:Mastering Technical Analysis—Methodology Summary
Related Courses

Tools That Help You Trade Better: Moving Averages, Trend Lines, and Indicators

Gate Futures Trading Guide - A must-read for newbies

Futures Grid Trading User Guide
ETF Leveraged Tokens — Product Guide