How to Use the Continuation Pattern—Wedge Pattern
Gate Learn's intermediate-level futures series helps users build a structured framework for technical analysis, covering candlestick basics, chart patterns, moving averages and trendlines, as well as the application of technical indicators. In this lesson, we will explain the application of the consolidation pattern—the wedge pattern—including the concept, characteristics, real BTC trading examples, and key considerations.
What Is a Wedge Pattern
A wedge pattern forms when the price swings narrow over time. By connecting highs and highs, and lows and lows, two converging trendlines are drawn in the same direction. Because its shape resembles a wedge, it is referred to as a wedge pattern.
Wedges come in two types: the rising wedge and the falling wedge.
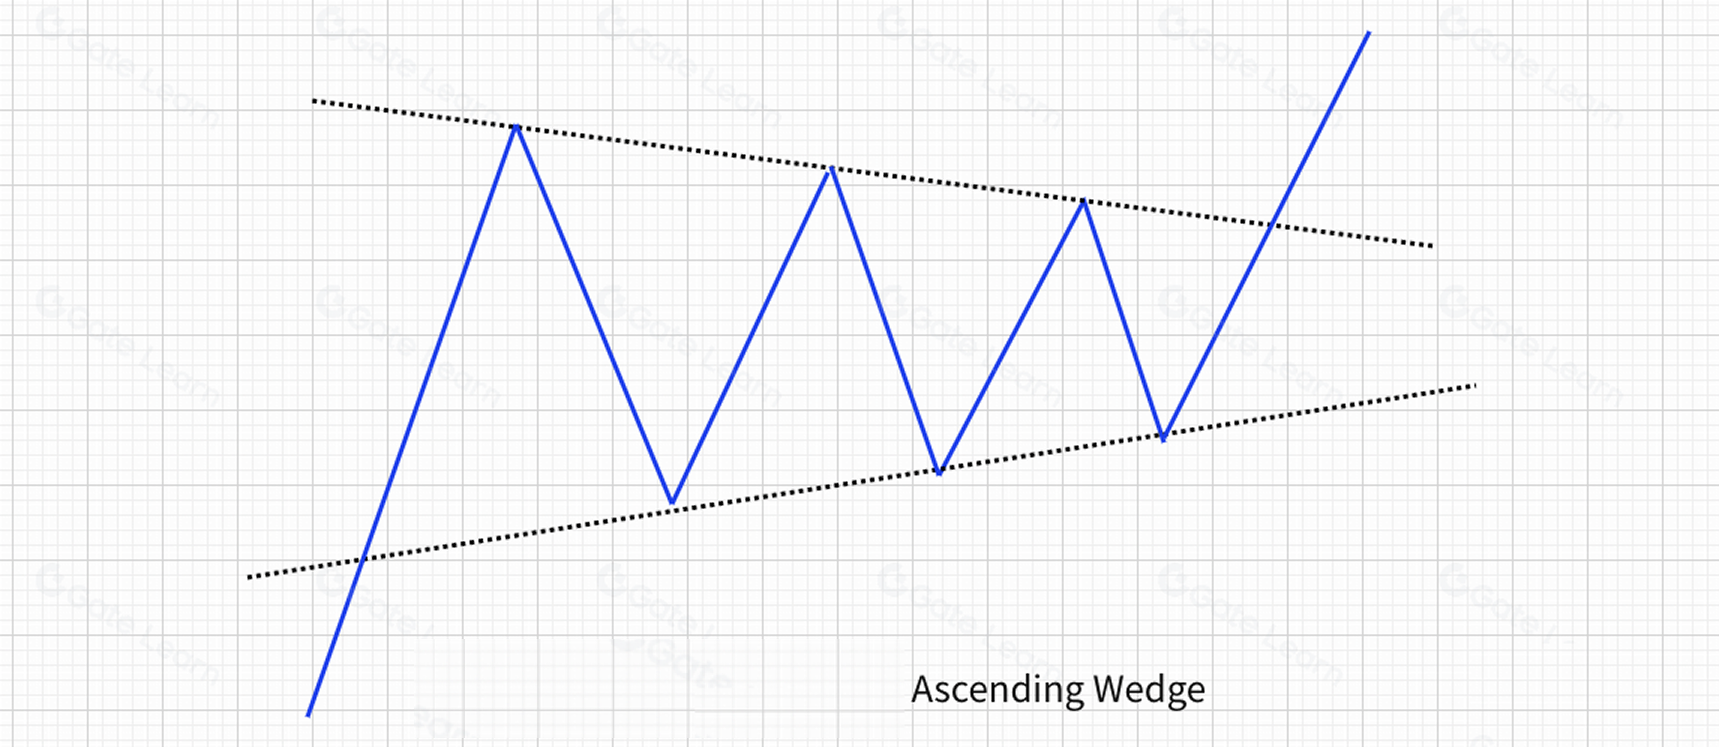
Rising Wedge
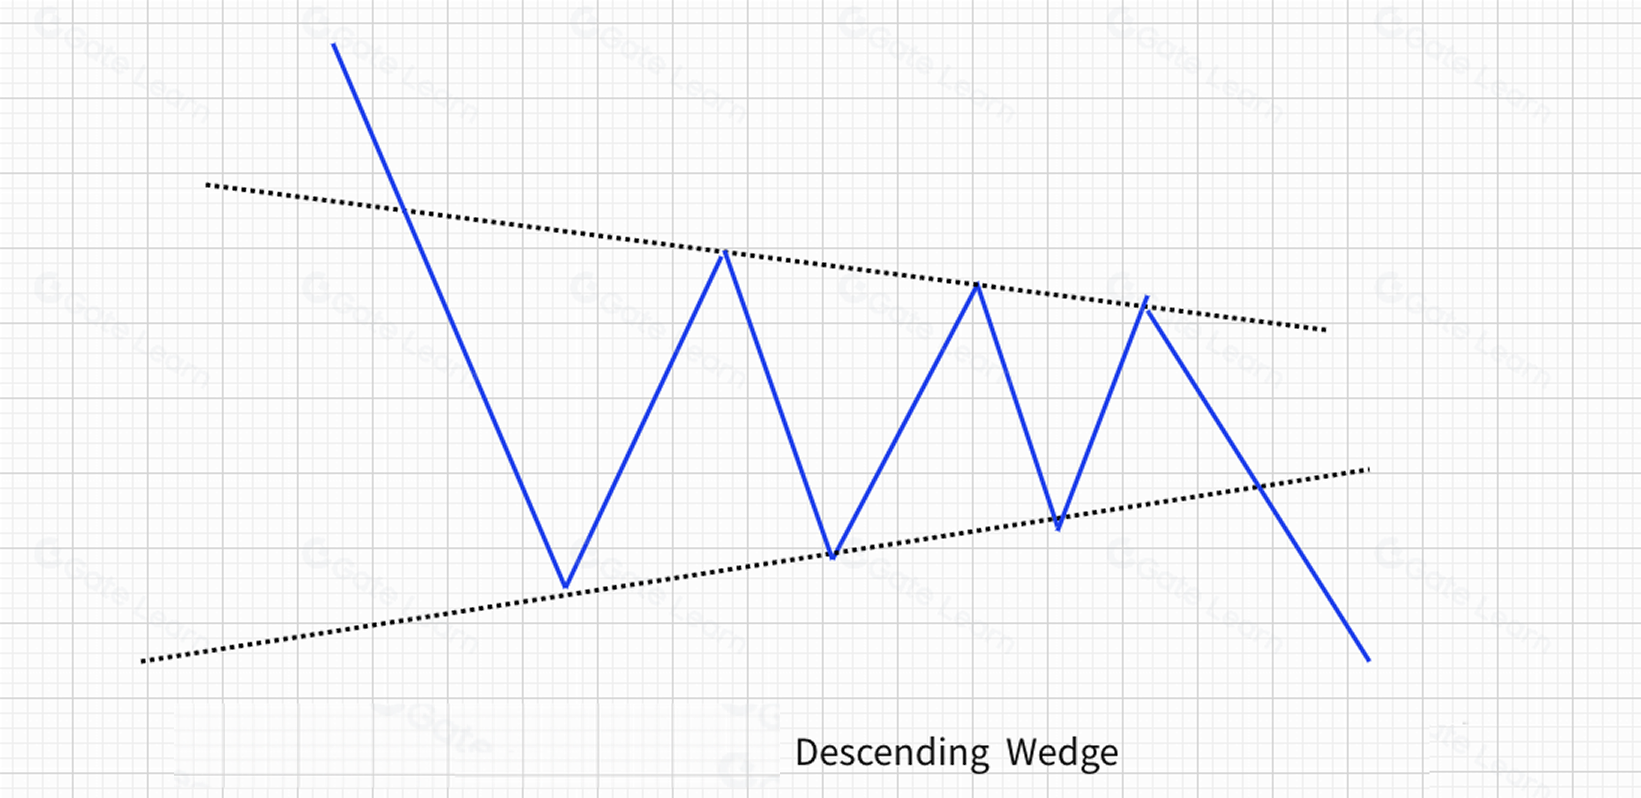
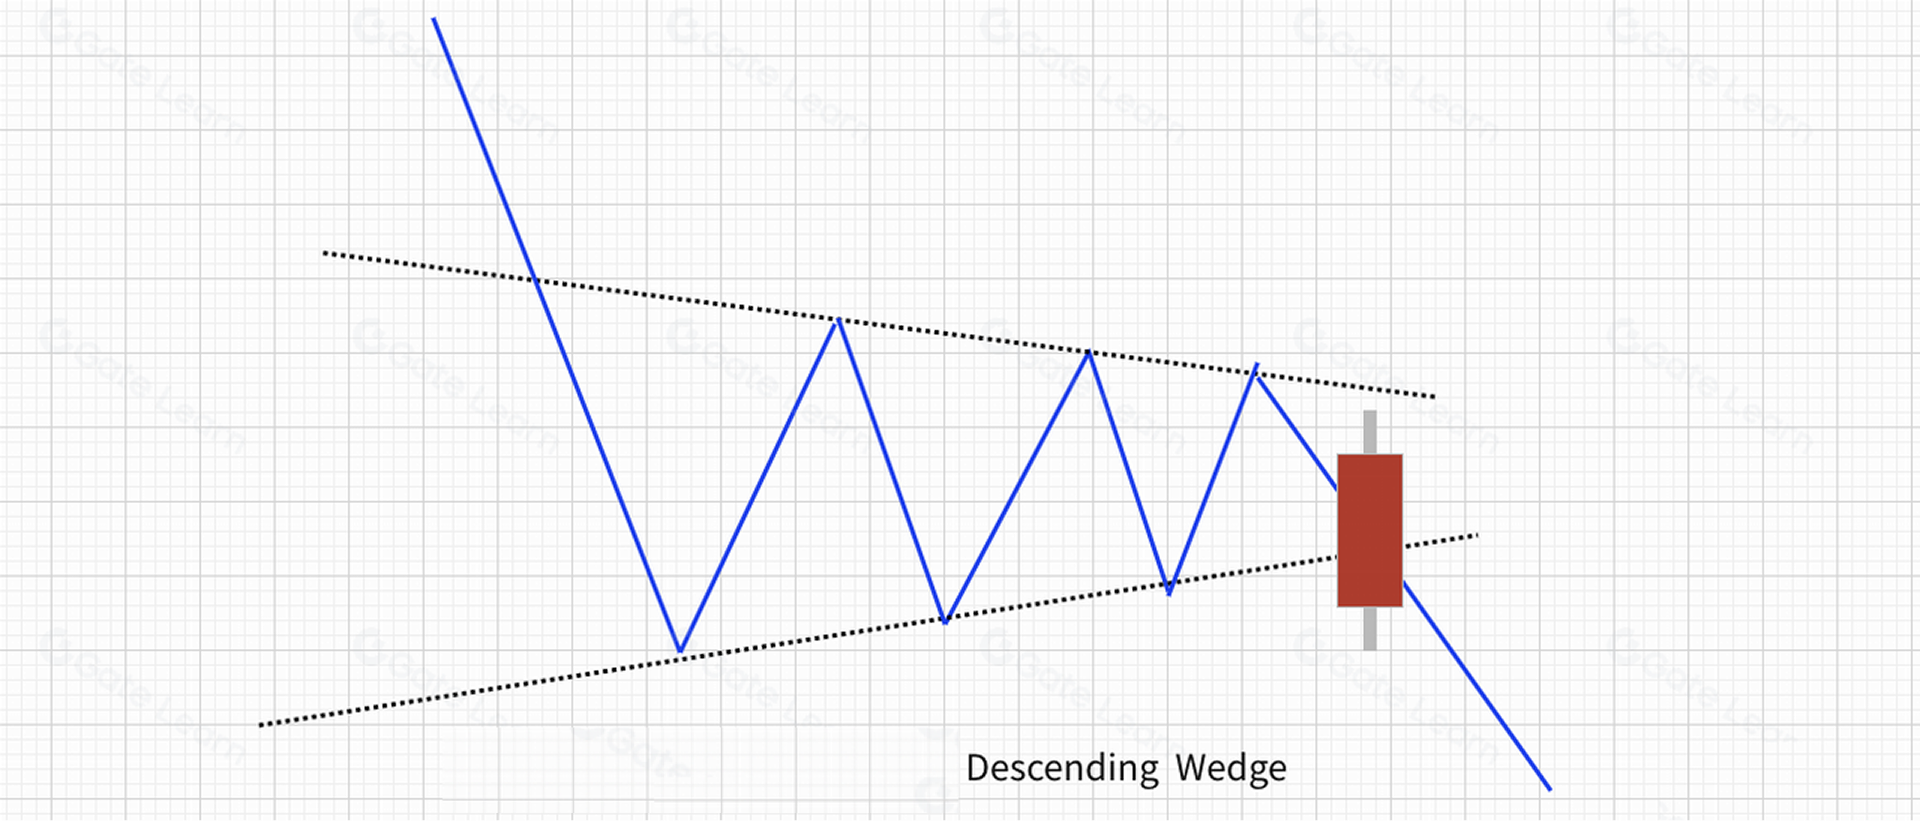
Falling Wedge
How to Identify a Wedge Pattern
From a geometric perspective, a wedge is also a type of triangle. However, unlike standard triangle formations, both trendlines of a wedge slope in the same direction—both upward or both downward.
- Rising Wedge
- Typically appears within an uptrend.
- Each rebound high is lower than the previous high, and each low is also lower than the previous low.
- Trading volume gradually contracts throughout the formation.
- Falling Wedge
- Typically appears within a downtrend.
- Each rebound high is higher than the previous high, and each low is also higher than the previous low.
- Trading volume gradually contracts throughout the formation.
Technical Implications of a Wedge Pattern
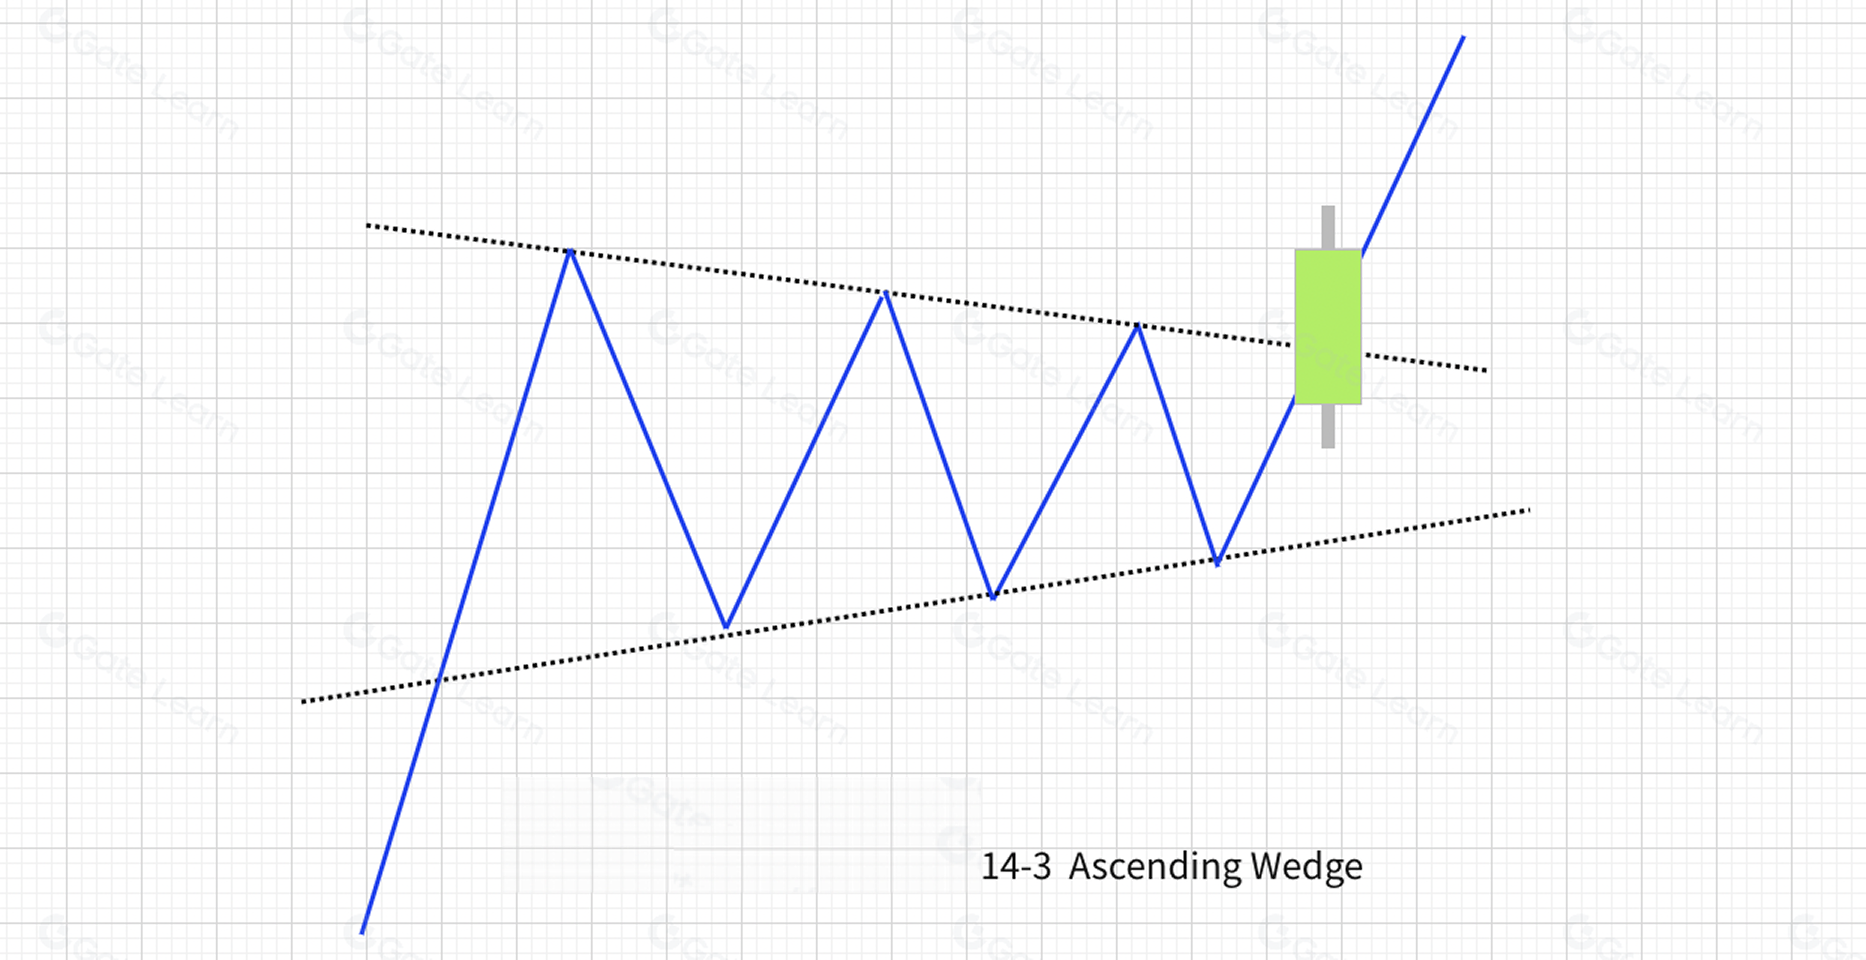
A breakout above the upper trendline signals a bullish outlook and a potential entry or long position.
A breakdown below the lower trendline signals a bearish outlook and a potential exit or short position.
Applications of the Wedge Pattern
When the price breaks above the upper trendline, the outlook turns bullish, suggesting an entry or long position.
When the price falls below the lower trendline, the outlook turns bearish, suggesting an exit or short position.
Real-Market Examples
Rising Wedge
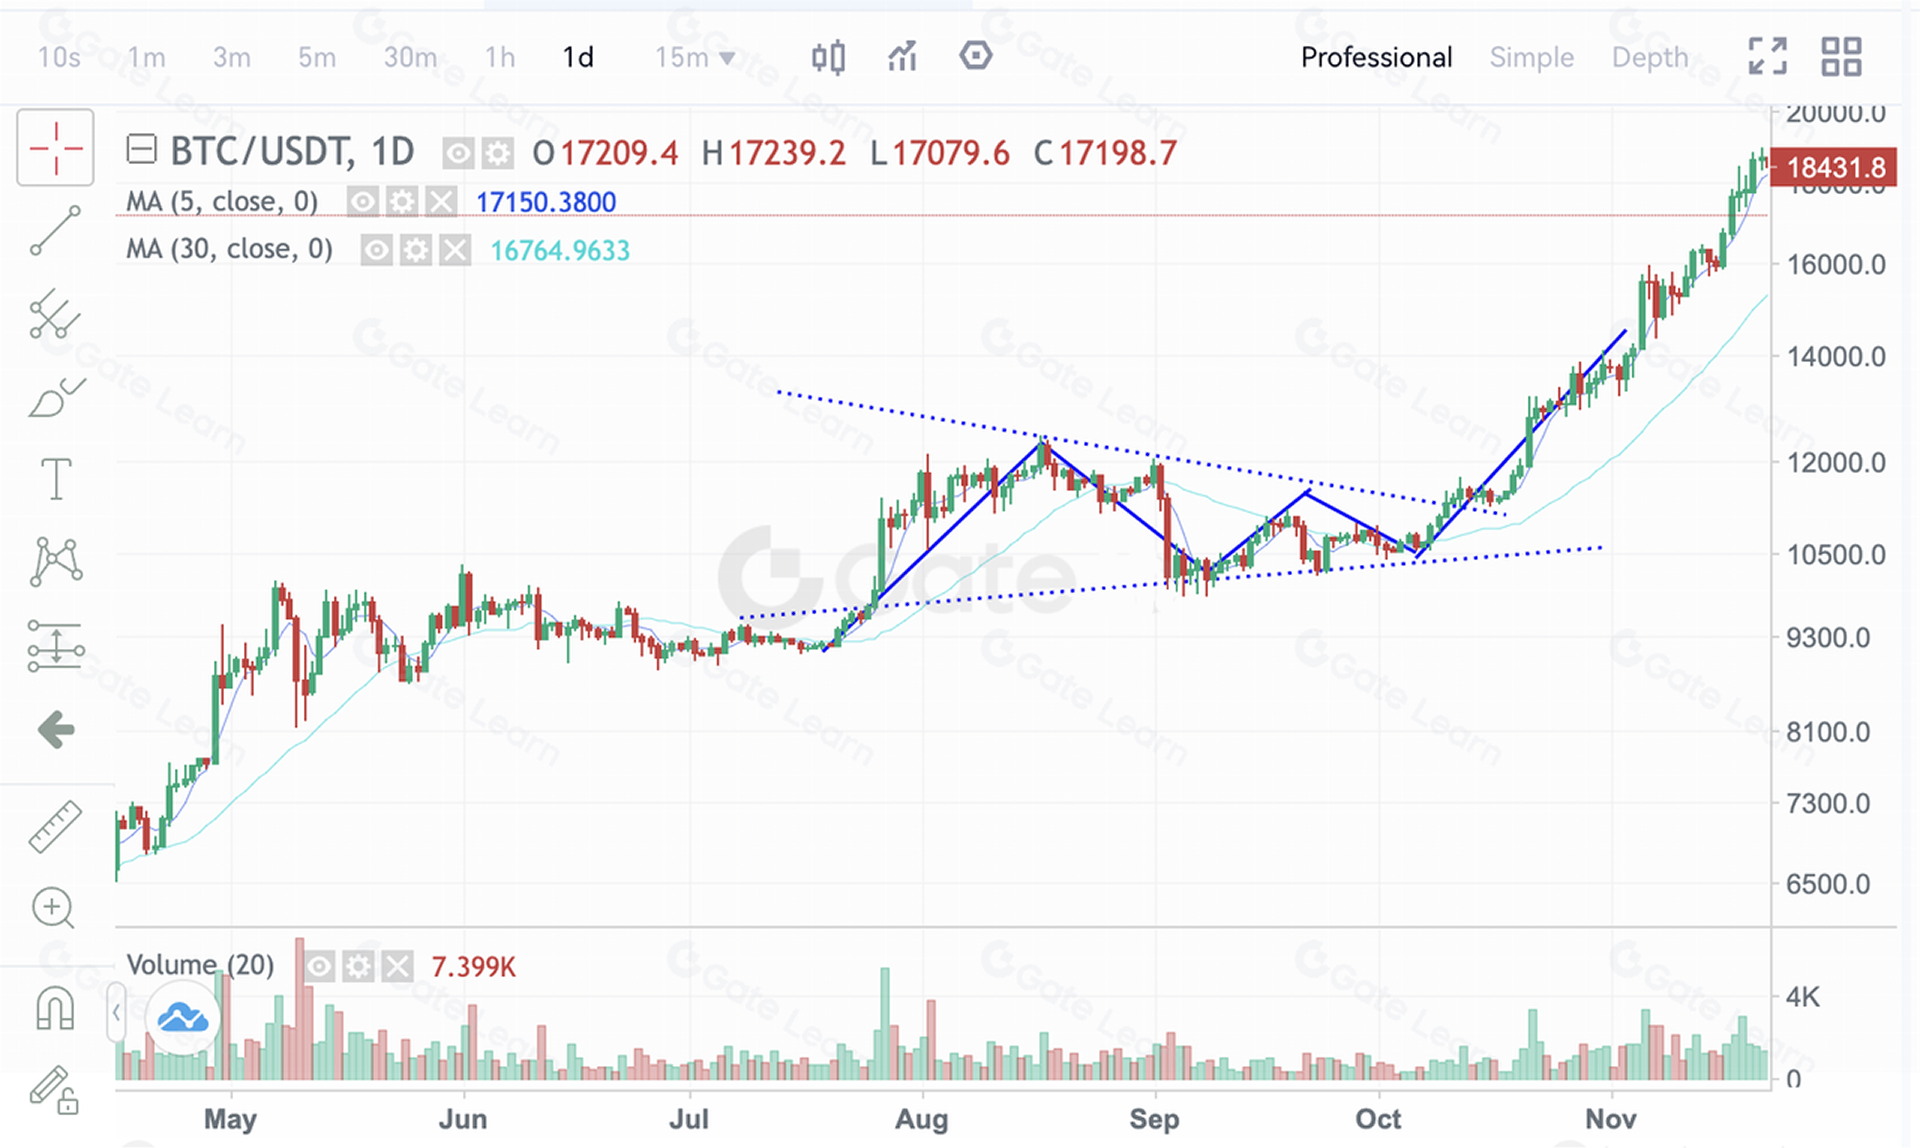
This figure above shows the BTCUSDT daily chart on Gate futures from June 1 to November 1, 2020. After a strong rally, BTC entered a consolidation phase and formed a rising wedge structure. The price then broke above $11,000 and the upper trendline of the wedge, initiating a new upward move that eventually surpassed $20,000, with an impressive gain of 107%.
Falling Wedge
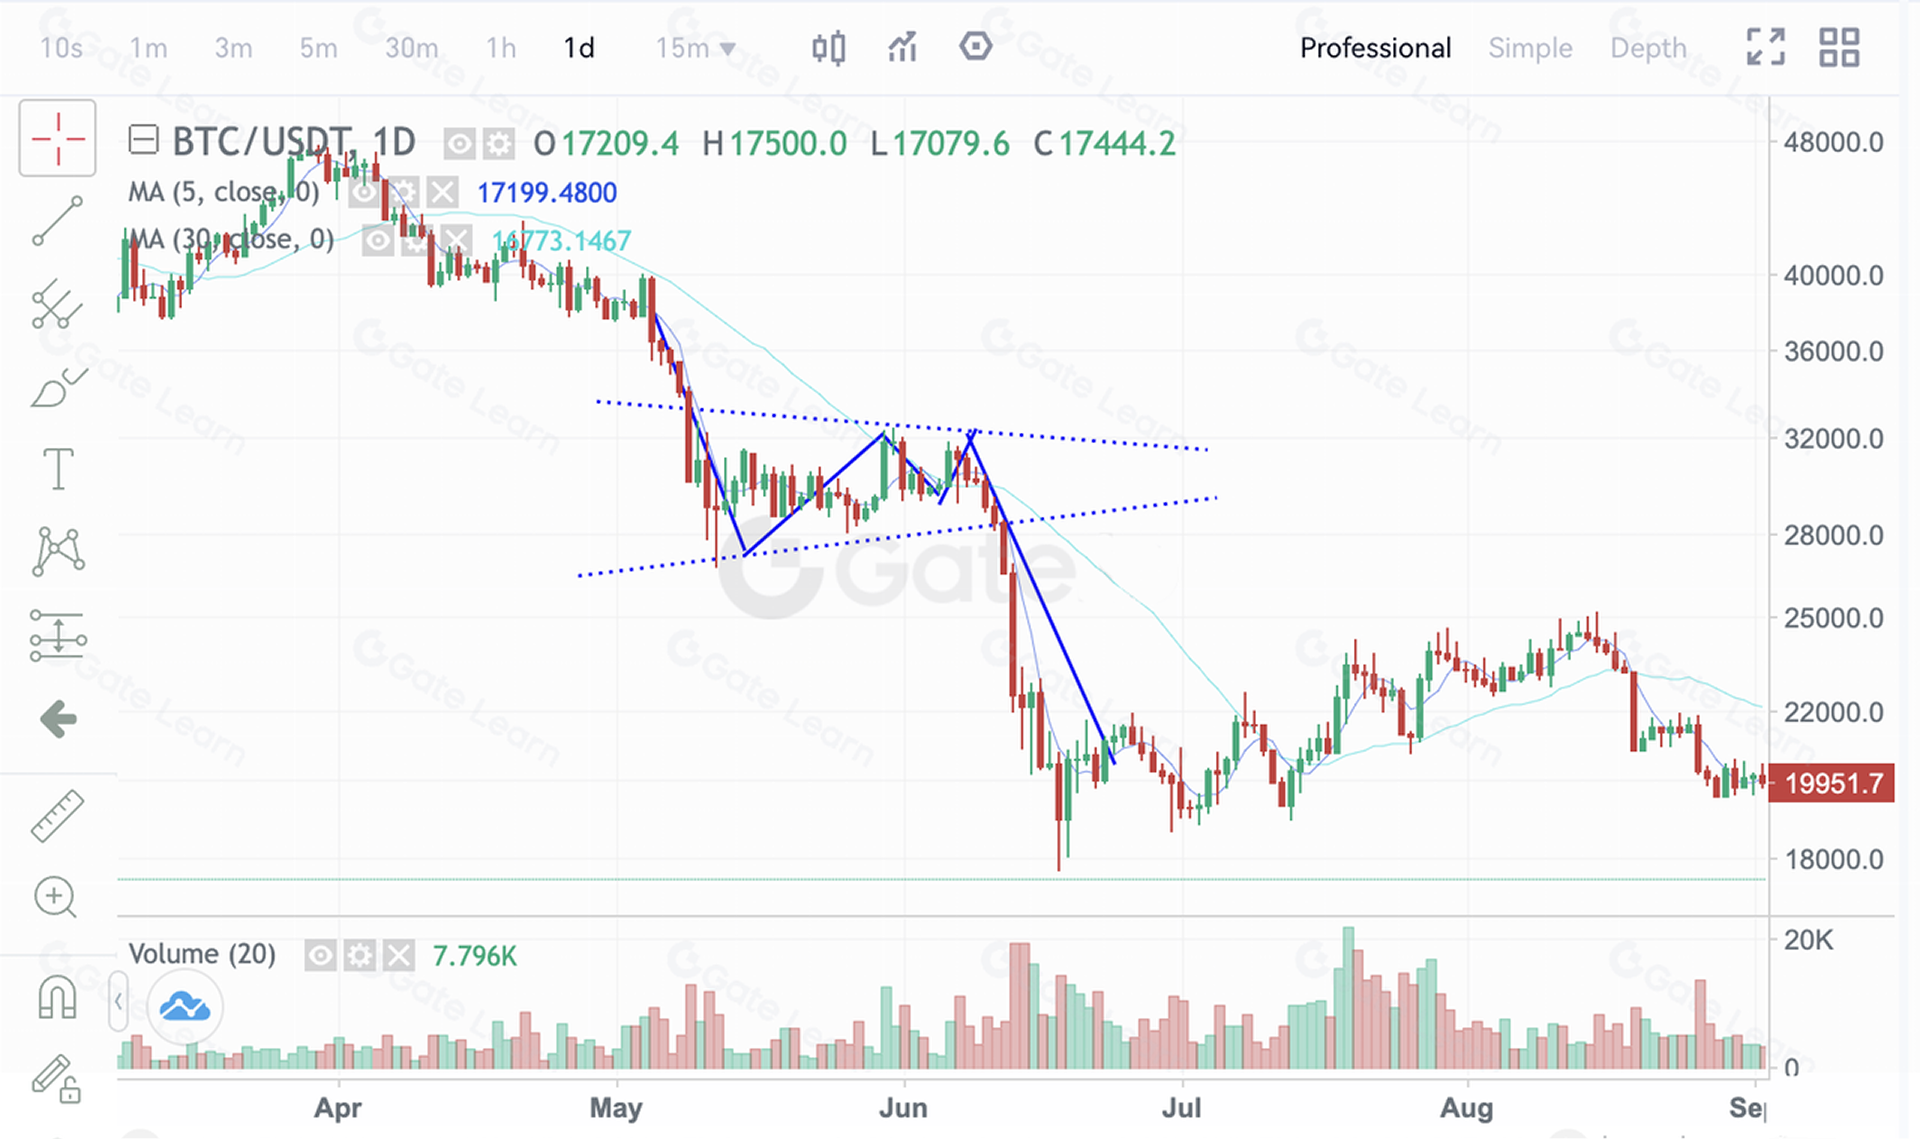
This figure above shows the BTCUSDT daily chart on Gate futures from May 5 to June 18, 2022. After a sharp decline, BTC entered a consolidation phase and formed a falling wedge. Once the price broke below the lower trendline at $29,500, a new downtrend began, bottoming near $17,800, with a 42% drop.
Summary
In practical trading, the approach to wedges, flags, and triangles follows a common principle: A breakout above the upper trendline—especially with volume confirmation—leans bullish and favors long setups, while a breakdown below the lower trendline favors short setups or exiting positions.
For more futures trading content, visit Gate futures and sign up to start your trading journey.
Disclaimer
This article is for reference only. Information provided by Gate does not constitute investment advice and Gate is not responsible for your investment decisions. Technical analysis, market judgment, trading strategies, and trader insights may involve potential risks, investment variability, and uncertainties. Nothing in this article guarantees returns or implies risk-free opportunities.
Lesson 1:What Is Technical Analysis in the Crypto Market?
Lesson 2:Common Bullish Candlestick Patterns
Lesson 3:Common Bearish Candlestick Patterns
Lesson 4:Bottom Reversal Pattern—Head and Shoulders Bottom
Lesson 5:How to Use the Top Reversal Pattern—Head and Shoulders Top
Lesson 6:How to Use the Bottom Reversal Pattern—Rounding Bottom
Lesson 7:How to Use the Top Reversal Pattern—Rounding Top
Lesson 8:How to Use the Bottom Reversal Pattern—Double Bottom (W-Shape)
Lesson 9:How to Use the Top Reversal Pattern—Double Top (M-Shape)
Lesson 10:How to Use the Bottom Reversal Pattern—V-Shaped Reversal
Lesson 11:How to Use the Consolidation Pattern—Ascending Triangle
Lesson 12:How to Use the Continuation Pattern—Descending Triangle
Lesson 13:How to Use the Continuation Pattern—Other Triangle Patterns
Lesson 14:How to Use the Continuation Pattern—Flag Pattern
Lesson 15:How to Use the Continuation Pattern—Wedge Pattern
Lesson 16:How to Use the Continuation Pattern—Rectangle Pattern
Lesson 17:Mastering Technical Analysis—Methodology Summary
Related Courses

Tools That Help You Trade Better: Moving Averages, Trend Lines, and Indicators

Gate Futures Trading Guide - A must-read for newbies

Futures Grid Trading User Guide
ETF Leveraged Tokens — Product Guide