Here’s Where Kaspa (KAS) Price Is Headed This Week
Kaspa (KAS) is moving through a rough market phase, but development on the network continues in the background.
A major hardfork is scheduled for May, introducing smart contracts and native assets through a covenant-focused upgrade. The goal is to bring programmability directly to Layer 1.
Kaspa has now processed over 600 million transactions, showing that people are still using the network and that its BlockDAG system is handling activity well.
Even with that progress, the broader market drop in late February, driven by geopolitical tension, pulled most crypto prices down, including KAS. The KAS price was not spared and is now trading around $0.02985 after testing support.
- What the Kaspa Chart Is Showing
- What the Indicators Are Saying
- Kaspa Price Targets to Watch This Week
What the Kaspa Chart Is Showing
On the 4H chart, KAS remains in a broader downtrend. Price has been forming lower highs for weeks, and each bounce has struggled to gain momentum.
The recent correction took the Kaspa price down to the range of $0.024 to $0.025, but the token has since traded sideways in the range of $0.028 to $0.031. That range now defines the short-term battle zone.
Right now, KAS is trading just under $0.03. The market is no longer falling aggressively, but it also hasn’t broken structure. It looks more like stabilization after a drop rather than a confirmed reversal.
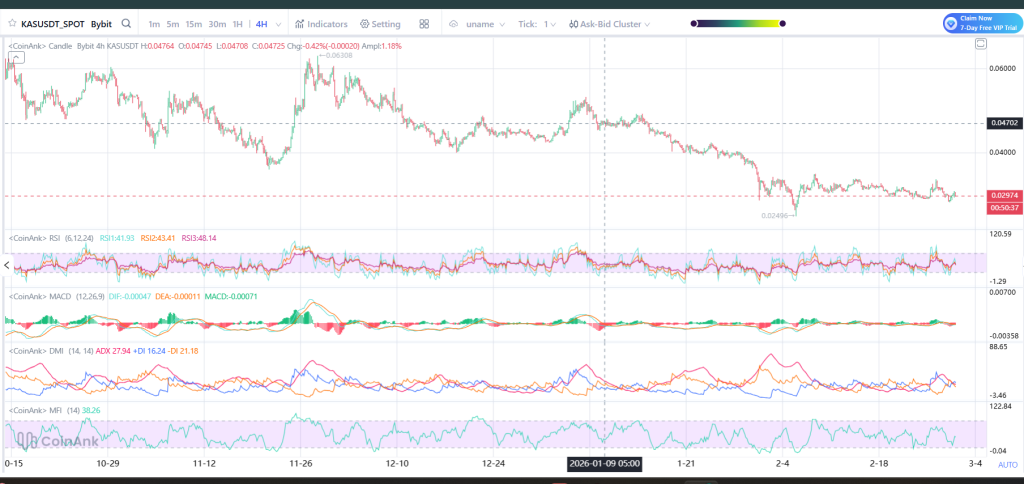
Source: Coinank
What the Indicators Are Saying
RSI is around the low 40s. That means the KAS price isn’t deeply oversold, but it’s not strong either. Buyers are not clearly in control.
MACD is flat with small bars, so there is no clear trend right now and no strong bullish signal.
DMI shows sellers slightly ahead, but not by much. The gap is small. MFI is also in the middle, which means money is flowing in and out evenly.
All of this points to one thing: the market is moving sideways, not making a big move yet.
_****Sei (SEI) Price at Historic Support as Experts Call It the “Final Gift”**
Kaspa Price Targets to Watch This Week
If KAS holds above $0.028, the next price to look at is $0.032. If it gets above $0.032, it can move toward $0.036–$0.038. After that, $0.047 is the next big level.
If the Kaspa price falls below $0.028, then $0.025 comes into view. If it drops under $0.025, the next area is around $0.022.
For now, KAS is trying to calm down after weeks of falling. The network news is positive, but the chart needs a move above $0.032 to look stronger. This week should show whether price starts climbing or tests lower levels again.
Gerelateerde artikelen
PEPE Jumps 2.3% With $337M Volume Surge — Is $0.054135 the Next Breakout Trigger?
Dogecoin Price Compresses Near $0.10 as Open Interest Drops
NEAR Surges 14.5% — Will a Break Above $1.25 Ignite a Run Toward $3–$4?
SHIB Tests $0.0560 Resistance as Broader Altcoin Cycle Extends Toward 2026
PIPPIN Surges Past $0.76 — $0.8472 Break or Pullback to $0.6715 Next?
PEPE Holds $0.053796 Support After 12% Drop Amid $580M Trading Spike