Injective (INJ) trades near $3 after 76% yearly drop, testing key support as RSI signals oversold conditions.
Injective (INJ) is trading near $3.27 on the weekly chart, following an extended decline from its 2024 highs above $40.
Market data shows the asset remains under pressure, while technical indicators suggest oversold conditions.
Weekly Price Structure Remains Bearish
The weekly INJ/USDT chart shows a clear pattern of lower highs and lower lows since early 2024.
A major top formed above $40, and price has trended downward since then. The broader structure remains bearish.
Price is now testing the $3.00 level, which serves as a psychological and recent reaction zone.
Below that, support levels are seen near $2.50 and $2.00. These areas previously acted as consolidation bases.
On the upside, resistance is visible near $5.00, followed by $8.00 to $10.00. A weekly close above $5 would mark the first structural improvement. Until then, the trend remains intact.
RSI and MACD Show Oversold Conditions
The weekly Relative Strength Index is near 29 to 32. This places INJ in oversold territory. However, during strong downtrends, RSI can remain low for extended periods.
A move above 40 on the weekly RSI would signal improving momentum. At present, no confirmed bullish divergence is visible. Price continues to respect the broader downward structure.
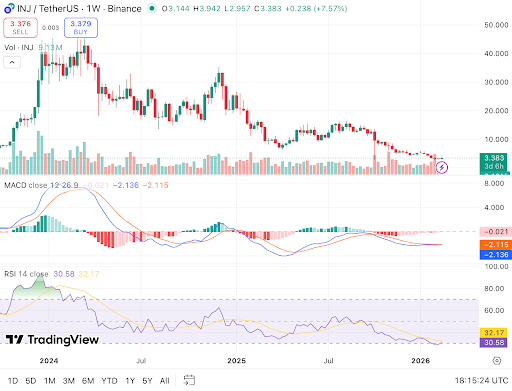
INJ tests critical $3 support amid persistent bearish momentum. Source: TradingView
The MACD indicator remains below the zero line. The histogram shows weakening bearish momentum, but no bullish crossover has formed.
This suggests downside pressure may be slowing, though confirmation is absent.
**Related Reading: **Bullish: New Injective Governance Vote Could Slash $INJ Supply By Half
Volume, Performance Metrics and DeFi Context
Trading volume has declined during the downtrend. There is no visible accumulation spike on the weekly chart.
A sustained reversal would require a strong green candle with higher volume.
Performance data shows short-term gains but longer-term weakness. INJ is up 4.30% over 24 hours and 6.70% over seven days.
However, it remains down 33.77% over 30 days and 76.94% over one year.
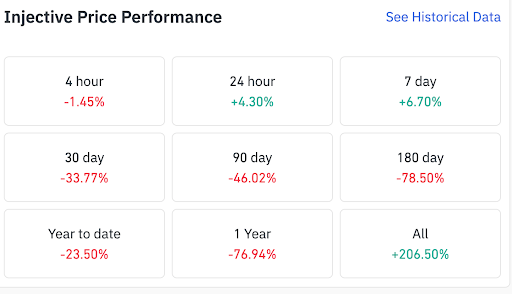
INJ shows mixed timeframes with short-term gains but deep longer-term drawdowns – Source: Coinglass data.
INJ shows mixed timeframes with short-term gains but deep longer-term drawdowns — Source: Coinglass data.
Total Value Locked across DeFi stands near $94.3 billion, down 1.79% in 24 hours. This remains below the 2021 peak near $180 billion, yet above 2022 lows.
While DeFi capital has stabilized, INJ price action has not confirmed accumulation.
Injective now trades at a critical level near $3.00. A sustained defense could lead to range formation between $3 and $5.
A breakdown below support may expose lower historical zones near $2.50 and $2.00.
Disclaimer: The information on this page may come from third parties and does not represent the views or opinions of Gate. The content displayed on this page is for reference only and does not constitute any financial, investment, or legal advice. Gate does not guarantee the accuracy or completeness of the information and shall not be liable for any losses arising from the use of this information. Virtual asset investments carry high risks and are subject to significant price volatility. You may lose all of your invested principal. Please fully understand the relevant risks and make prudent decisions based on your own financial situation and risk tolerance. For details, please refer to
Disclaimer.
Gerelateerde artikelen
比特币重回7万美元上方,亚洲科技股下跌与黄金走强施压
比特币价格在3月20日反弹至7万美元以上,市值约1.41万亿美元,但受科技股下跌和避险资产需求上升限制上涨。机构资金流出显示比特币需求减缓,投资者需关注市场动态以评估潜在风险。
GateNews26m geleden
比特币价格重现早前暴跌模式,65,800美元为关键支撑
比特币价格趋势与去年类似,当前约70,335美元,显示出潜在市场压力。若跌破65,800美元,可能迎来新一轮下跌;突破上轨则可望反弹。市场情绪谨慎,投资者需关注关键支撑和阻力位,警惕下行风险同时准备多头反弹。
GateNews27m geleden
Hyperliquid Price Jumps 22% as Commodity Trading Hits Record
Key Insights:
Hyperliquid surged over 20% weekly, driven by record commodity futures trading volumes, especially oil and silver contracts, gaining strong traction among traders.
Whale activity surpassed $3.6 billion in leveraged positions, boosting liquidity and reinforcing upward momentum a
CryptoFrontNews30m geleden
Pi Network (PI) phát tín hiệu phục hồi sớm sau nâng cấp mainnet mới
Pi Network's recent upgrade to mainnet version 20 enables smart contract deployment, boosting ecosystem development. However, PI token faces downward pressure, trading below resistance levels with bearish technical indicators. Recovery is dependent on surpassing the $0.1950–$0.2000 resistance zone.
TapChiBitcoin35m geleden
Bittensor Holds Strength but Faces Resistance Near $285 Level
Key Insights:
Bittensor maintains strong short-term momentum above key averages, while ETF developments and high staking levels continue shaping liquidity and investor demand dynamics.
Overbought technical indicators signal stretched conditions, even as bullish momentum persists,
CryptoFrontNews40m geleden
Cardano’s Chart Just Printed a “Black 9” – Here’s Where ADA Price Could Go Next
Ali Martinez highlights a significant technical signal for Cardano, specifically the TD Sequential indicator showing a "black 9," suggesting a potential price reversal after a prolonged downtrend. If ADA maintains support at $0.23, it could rise to $0.32 and $0.37. However, failure to hold this level might invalidate the bullish setup.
CaptainAltcoin51m geleden
