
**Date: **Wed, Jan 07, 2026 | 06:20 AM GMT
The broader cryptocurrency market continues to show strong New Year momentum, with Bitcoin (BTC) up around 4% and Ethereum (ETH) gaining over 9% on a weekly basis. This improving sentiment is gradually spilling over into major altcoins — including the DePIN-focused token Akash Network (AKT).
AKT has already posted an impressive 20% weekly gain. While this short-term strength has caught traders’ attention, the more important development is unfolding on the higher-timeframe chart. Recent price action suggests a meaningful shift in market structure, hinting that AKT may be transitioning out of a prolonged corrective phase and into the early stages of a bullish continuation.
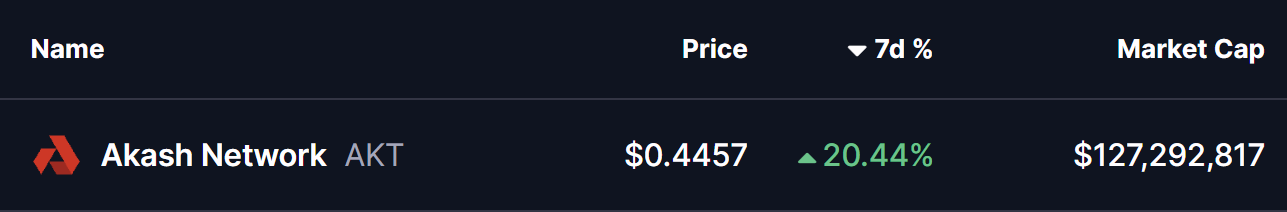
Source: Coinmarketcap
Falling Wedge and Rounding Bottom in Play
On the daily chart, AKT has been trading within a broader falling wedge — a structure that often precedes bullish reversals as selling pressure gradually weakens. Within this larger wedge, price action is also shaping a developing rounding bottom pattern, reflecting steady accumulation and seller exhaustion.
The formation began after AKT faced strong rejection near the $0.5441 resistance zone in late November. That rejection triggered a sharp sell-off, pushing price lower toward the $0.3465 region. However, bears failed to extend losses beyond this area. Instead, demand stepped in, downside momentum slowed, and price began to stabilize.
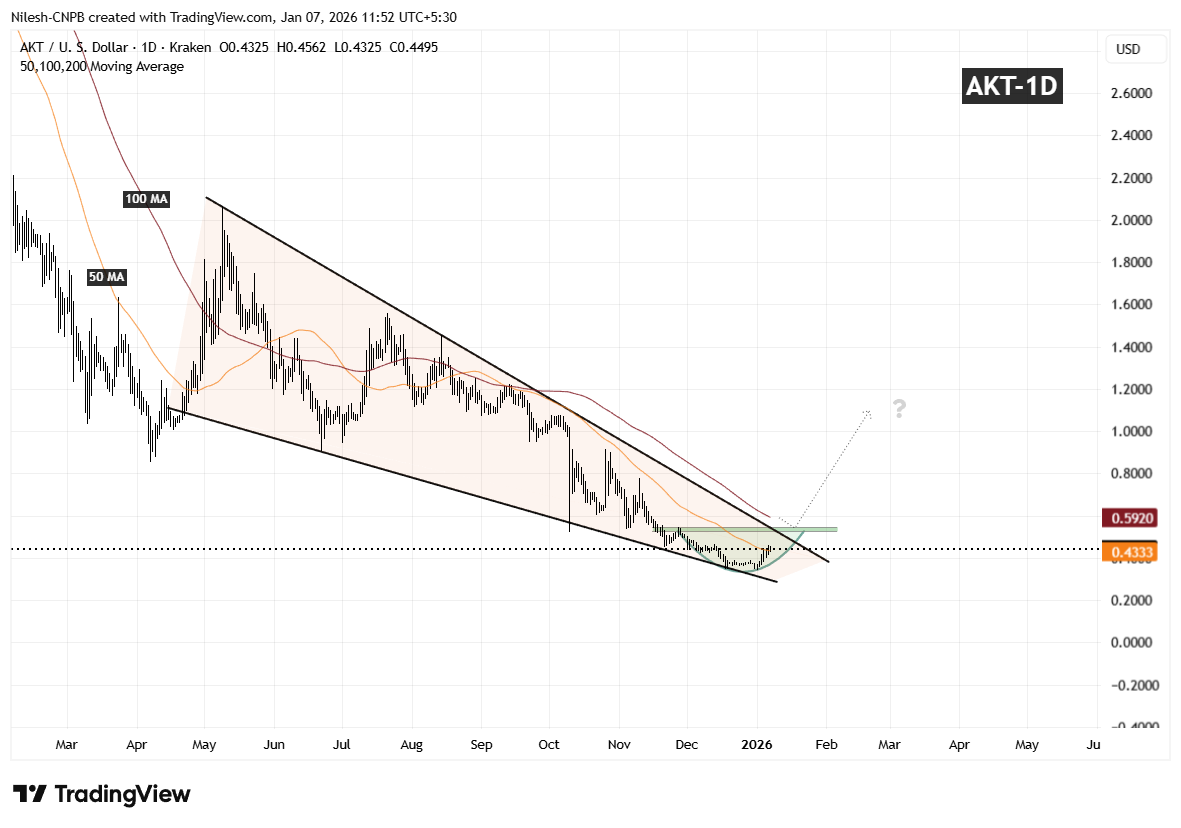
Akash Network (AKT) Daily Chart/Coinsprobe (Source: Tradingview)
Over the following weeks, volatility compressed and AKT started to curl higher in a smooth, rounded fashion — closely matching the textbook behavior of a rounding bottom. Importantly, the recent rebound has pushed price back above the 50-day moving average around $0.4333, a level that had previously acted as resistance and is now beginning to flip into support.
What’s Next for AKT?
If AKT can continue to hold above the 50-day moving average, this area may act as a solid base for further upside attempts. From here, attention shifts toward the descending resistance trendline of the falling wedge, which aligns closely with the $0.5441 resistance zone.
A clean and decisive breakout above this confluence area, followed by sustained acceptance, would confirm a broader bullish expansion phase and mark a clear trend reversal from the prior downtrend. Such a move would likely attract renewed momentum participation as the market recognizes the structural shift.
Until that breakout occurs, the pattern remains in development. Short-term consolidation or shallow pullbacks are still possible as price digests recent gains. However, as long as AKT continues to print higher lows above the established base, the broader technical structure remains constructive.
Overall, the chart suggests AKT is approaching a critical inflection point — one that could determine whether this recovery evolves into a sustained bullish trend as 2026 progresses.
Disclaimer: The views and analysis presented in this article are for informational purposes only and reflect the author’s perspective, not financial advice. Technical patterns and indicators discussed are subject to market volatility and may or may not yield the anticipated results. Investors are advised to exercise caution, conduct independent research, and make decisions aligned with their individual risk tolerance.
About Author: Nilesh Hembade is the Founder and Lead Author of Coinsprobe, with over 5 years of experience in the cryptocurrency and blockchain industry. Since launching Coinsprobe in 2023, he has been providing daily, research-driven insights through in-depth market analysis, on-chain data, and technical research.
Disclaimer: The information on this page may come from third parties and does not represent the views or opinions of Gate. The content displayed on this page is for reference only and does not constitute any financial, investment, or legal advice. Gate does not guarantee the accuracy or completeness of the information and shall not be liable for any losses arising from the use of this information. Virtual asset investments carry high risks and are subject to significant price volatility. You may lose all of your invested principal. Please fully understand the relevant risks and make prudent decisions based on your own financial situation and risk tolerance. For details, please refer to
Disclaimer.
Gerelateerde artikelen
Cathie Wood:BTC 已进入成熟阶段,85%-95% 深度暴跌或成为过去
Ark Invest 创始人 Cathie Wood 表示比特币已进入成熟阶段,历史上的大幅下跌可能已成过去,即使未来回撤50%也被视为进步。她指出,比特币已成长为成熟的货币体系和资产类别。
GateNews3m geleden
Ripple CTO Emeritus Challenges 'No-Freeze' Stablecoin Idea, What Are Risks? - U.Today
Ripple CTO Emeritus David Schwartz critiqued Omid Malekan's stablecoin prediction, questioning the feasibility of a non-intervention model in complying with legal obligations. Schwartz's inquiries highlighted potential challenges in redeeming stablecoins if issuers don't intervene, as well as implications for fractional reserve practices.
UToday5m geleden
BTC 在 67,000 美元附近窄幅盘整,SOL 期货未平仓合约创近两月新高
4月3日,加密市场持续震荡,比特币在67,000美元附近盘整,维持自去年10月的宏观下行趋势。期货市场交投清淡,Solana期货未平仓合约创高,波动率指数降至2月以来最低,市场结构显示空头持仓增加。
GateNews1u geleden
Crypto consolidates as volatility cools and futures markets tilt bearish
The crypto market continued to exhibit signs of choppiness on Friday, with bitcoin BTC$66,729.05 trading at $67,000 in the middle of a trading range that spans back to early February.
A selection of altcoins picked up during the lower liquidity Asia hours, prompting the likes of ALGO and RENDER to
CoinDesk1u geleden
Reputed Crypto Trader Calls the Bottom at $54,000 BTC Price, Bullish Expectations Grow
Reputed crypto trader calls the bottom at $54,000 BTC price.
This led to a massive surge in price pump expectations.
The price of BTC could rally towards new ATH prices after the bottom is set.
The price of Bitcoin (BTC) continues to trade in the $66,000 price range, hinting at
CryptoNewsLand2u geleden
比特币价格重复下跌模式开启第三波,BTC关键支撑65,636美元受考验
比特币价格在67,044美元附近震荡,处于下降通道中,第三波下跌已回调约5%。技术指标显示价格动能减弱,短期持有者面临亏损。关键支撑位在65,750和64,920美元,若跌破可能下探至57,883美元,投资者需关注市场动态,谨慎管理风险。
GateNews2u geleden
