
Date: Fri, Jan 02, 2026 | 09:15 AM GMT
The broader cryptocurrency market has started the new year on a stable footing, with both Bitcoin (BTC) and Ethereum (ETH) trading slightly higher and posting gains of over 1.5%. This modest strength across major assets has provided breathing room for risk-on sentiment, allowing several memecoins to show early signs of recovery — including Popcat (SOL) (POPCAT).
POPCAT is currently trading by solid 19% higher on the day, but the more important development lies in its broader technical structure. After months of consistent downside pressure, the price action is now beginning to hint at a potential trend reversal, supported by a well-defined bullish pattern forming on the daily chart.

Source: Coinmarketcap
Falling Wedge Pattern in Play
On the daily timeframe, POPCAT appears to be carving out a falling wedge formation — a classic bullish reversal pattern that often develops after extended downtrends. This structure is characterized by lower highs and lower lows that gradually converge, reflecting weakening selling pressure and growing buyer interest near the lows.
Following weeks of steady decline, POPCAT recently established a local bottom near the $0.0725 region. This area acted as a strong demand zone, where buyers stepped in aggressively and prevented further downside. The resulting rebound pushed price back toward the $0.088 level, placing POPCAT just beneath the wedge’s upper resistance trendline.
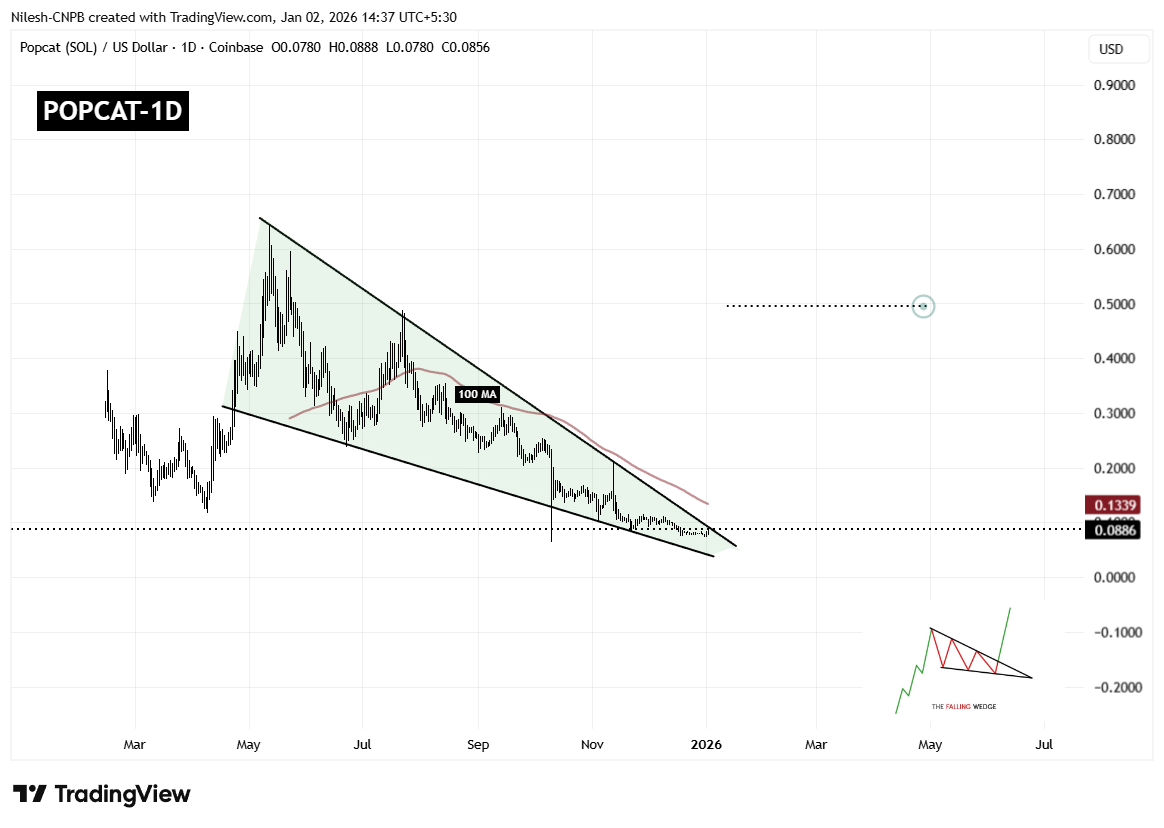
Popcat (POPCAT) Daily Chart/Coinsprobe (Source: Tradingview)
This compression near resistance is technically significant, as falling wedges tend to resolve with a sharp upside move once price breaks out of the structure. The longer price coils within the wedge, the stronger the eventual breakout tends to be.
However, overhead resistance remains notable. The 100-day moving average, currently hovering around $0.1339, represents a major technical barrier. This level has previously acted as dynamic resistance and will likely be a key area to watch if a breakout occurs.
What’s Next for POPCAT?
If buyers manage to push price decisively above the wedge resistance and reclaim the 100-day moving average with a strong daily close, POPCAT could confirm a bullish breakout. Such a move would mark a clear shift in trend structure and could open the door for a larger recovery rally.
Based on the measured move of the falling wedge pattern, the upside projection points toward the $0.49 region. Reaching this level would represent a substantial recovery from current prices and could attract renewed interest from momentum traders and sidelined participants.
That said, failure to break above resistance could result in continued consolidation. In a bearish scenario, POPCAT may revisit the $0.072 support zone once again. As long as this level continues to hold, the broader falling wedge structure would remain intact, keeping the bullish reversal thesis alive.
Overall, POPCAT is approaching a technically critical juncture. With price tightly compressed, selling pressure fading, and buyers defending key support levels, the coming sessions could prove decisive in determining whether this memecoin is ready to stage its next meaningful move higher.
Disclaimer: The views and analysis presented in this article are for informational purposes only and reflect the author’s perspective, not financial advice. Technical patterns and indicators discussed are subject to market volatility and may or may not yield the anticipated results. Investors are advised to exercise caution, conduct independent research, and make decisions aligned with their individual risk tolerance.
About Author: Nilesh Hembade is the Founder and Lead Author of Coinsprobe, with over 5 years of experience in the cryptocurrency and blockchain industry. Since launching Coinsprobe in 2023, he has been providing daily, research-driven insights through in-depth market analysis, on-chain data, and technical research.
Disclaimer: The information on this page may come from third parties and does not represent the views or opinions of Gate. The content displayed on this page is for reference only and does not constitute any financial, investment, or legal advice. Gate does not guarantee the accuracy or completeness of the information and shall not be liable for any losses arising from the use of this information. Virtual asset investments carry high risks and are subject to significant price volatility. You may lose all of your invested principal. Please fully understand the relevant risks and make prudent decisions based on your own financial situation and risk tolerance. For details, please refer to
Disclaimer.
Gerelateerde artikelen
Here’s What Happened the Last Time Bitcoin Price Had 6 “Red” Months in a Row
Bitcoin is about to do something it’s only done once before. Close its sixth consecutive month in the red. That’s not a typo. Six months. Straight. Red. The BTC price has been bleeding since October, and the monthly candles don’t lie. This has happened only one other time in Bitcoin’s entire hi
CaptainAltcoin6m geleden
Ondo Gains After Franklin Templeton ETF Tokenization Deal
Key Insights
Ondo gained eight percent after partnering with Franklin Templeton, boosting visibility and signaling deeper integration between traditional finance and blockchain-based investment products globally.
Tokenized ETFs will enable round-the-clock trading through crypto wallets,
CryptoNewsLand36m geleden
Dogecoin Holds Key Support as 23% YTD Drop Deepens
Key Insights:
Dogecoin has declined over 23% year to date, with broader macroeconomic pressure and weak crypto sentiment driving sustained selling across major digital assets.
The $0.07 to $0.08 range remains a historically strong support zone, previously triggering sharp recoveries and
CryptoNewsLand46m geleden
XRP Price Compresses Near $1.40 as Traders Brace for Breakout
Key Insights
XRP trades within a tightening triangle, with resistance at $1.40 and support near $1.30 shaping a decisive breakout setup expected in early April.
Rising derivatives volume and open interest indicate fresh positioning, while liquidation data highlights repeated failed breakout
CryptoNewsLand50m geleden
Bitcoin Price Prediction: Is $60K Inevitable for BTC Amid Market Weakness?
Bitcoin (BTC) continues in a broad consolidation phase following the steep declines earlier this year. The asset remains confined in a horizontal range that signals short-term indecision among market participants. While attempts to retest higher resistance levels around $75k have been met with
CryptoPotato53m geleden
This Oversold Signal Has Triggered 350%, 1,800%, and 2,700% Bitcoin Surges Before
Although it has performed relatively well since the war in the Middle East broke out nearly a month ago, and has dwarfed gold in terms of gains within this period, bitcoin is far from its best shape observed in October last year.
The cryptocurrency trades nearly 50% below its all-time high of
CryptoPotato1u geleden
