
The broader cryptocurrency market is showing modest strength, with both Bitcoin (BTC) and Ethereum (ETH) trading in the green. This stability among the majors has helped support sentiment across the altcoin space, and Curve DAO Token (CRV) is now beginning to flash early signs of a potential momentum shift.
CRV has managed to post around 3% gains, and more importantly, its daily chart is revealing a high-probability bullish setup that could hint at a much larger move ahead if momentum continues to build.
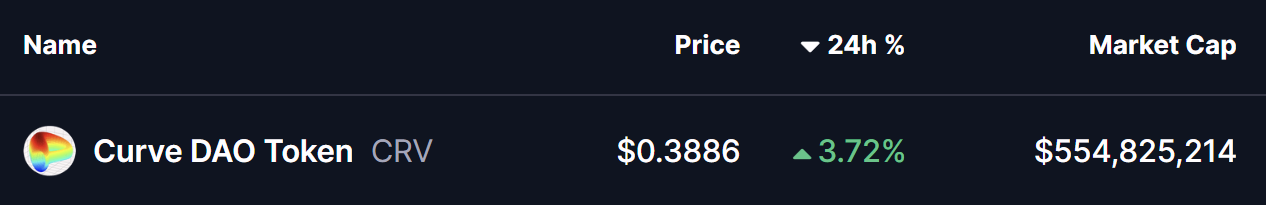
Source: Coinmarketcap
Power of 3 Pattern Takes Shape
On the daily timeframe, CRV appears to be forming a classic Power of 3 (PO3) pattern — a structure commonly associated with smart money behavior. This pattern typically unfolds in three stages: accumulation, manipulation, and expansion, often preceding a strong directional breakout.
Accumulation Phase Defined
During the accumulation phase, CRV spent several sessions trading sideways between $0.4314 resistance and $0.3773 support. This tight consolidation reflected equilibrium between buyers and sellers, allowing larger participants to build positions quietly while volatility remained compressed.
The flat price action within this range laid the foundation for the next phase, as liquidity gradually built up above and below the range boundaries.
Manipulation Flush Clears Weak Hands
CRV recently entered the manipulation phase when price briefly broke below the $0.3773 support, dropping sharply to a local low near $0.3321. This sudden downside move aligns with the typical stop-hunt behavior seen in Power of 3 setups, designed to shake out weak hands and trigger sell-side liquidity before a reversal.
Notably, the breakdown was short-lived, and sellers failed to maintain control — an early sign that downside momentum may be exhausting.
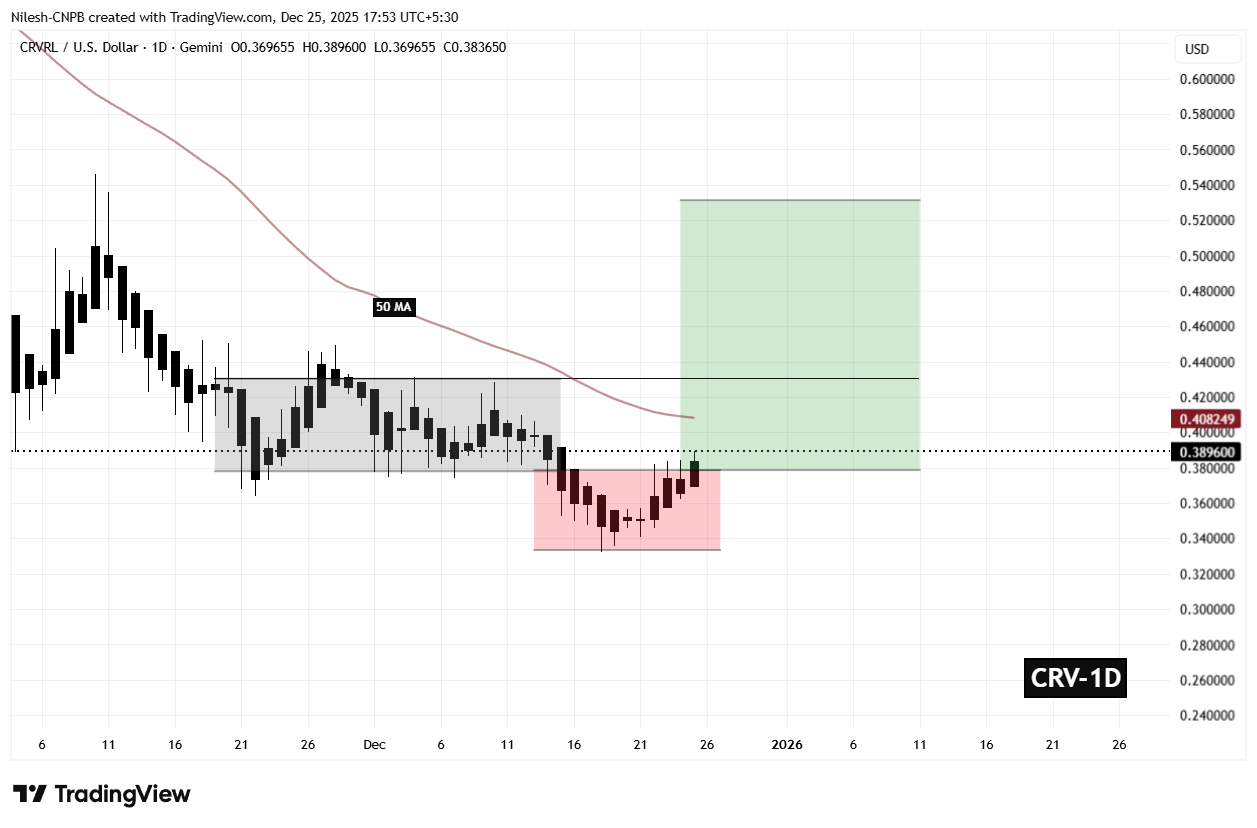
Curve DAO Token (CRV) Daily Chart/Coinsprobe (Source: Tradingview)
Expansion Phase Begins to Unfold
Following the sweep of lows, CRV rebounded decisively back above the $0.3773 level, reclaiming it as support. This recovery suggests that the expansion phase may now be underway, with buyers stepping back in and defending key structure levels.
Price is currently pushing higher toward the 50-day moving average near $0.4082, which has acted as dynamic resistance during the broader downtrend. A daily close above this level would mark an important technical shift and strengthen the bullish reversal narrative.
What’s Next for CRV?
If CRV manages to break and hold above the 50-day MA, the next key target sits at $0.4314, the upper boundary of the prior accumulation range. Reclaiming this zone with conviction would confirm a bullish breakout and likely attract fresh momentum buyers.
Based on the Power of 3 structure, a successful breakout could open the door toward the $0.52–$0.54 region, derived by projecting the height of the accumulation range from the breakout point — aligning closely with the upside zone highlighted on the chart.
However, caution remains warranted. A failure to hold above $0.3773 could invalidate the expansion phase and force CRV back into consolidation, delaying any meaningful upside continuation.
For now, CRV sits at a technically critical juncture, with price action suggesting that smart money positioning may already be underway ahead of a potential expansion move.
Disclaimer: The views and analysis presented in this article are for informational purposes only and reflect the author’s perspective, not financial advice. Technical patterns and indicators discussed are subject to market volatility and may or may not yield the anticipated results. Investors are advised to exercise caution, conduct independent research, and make decisions aligned with their individual risk tolerance.
Disclaimer: The information on this page may come from third parties and does not represent the views or opinions of Gate. The content displayed on this page is for reference only and does not constitute any financial, investment, or legal advice. Gate does not guarantee the accuracy or completeness of the information and shall not be liable for any losses arising from the use of this information. Virtual asset investments carry high risks and are subject to significant price volatility. You may lose all of your invested principal. Please fully understand the relevant risks and make prudent decisions based on your own financial situation and risk tolerance. For details, please refer to
Disclaimer.
Gerelateerde artikelen
Gate日報(4月27日):川普槍擊事件言論推升TRUMP幣;美財政部將Venmo納入債務捐贈支付
比特幣(BTC)短線急升反彈,4 月 27 日暫報 78,900 美元左右。川普對槍擊事件的挑釁性言論提升了 TRUMP、MAGA、DJT 等迷因幣價格,因為精心策劃的敘事再次浮出水面。美國財政部將 Venmo 納入債務捐贈支付管道,先前戰略性比特幣儲備法案陷入僵局。
MarketWhisper1u geleden
Ascending Triangle Breakout Loading? Top 5 Altcoins With 5x Upside Potential
Ascending triangles indicate growing buying pressure but need to be confirmed.
Toncoin and Fantom display better trends than others in consolidation.
Overall market conditions still play a crucial role in the success of breakouts.
A common technical pattern has begun to emerge among
CryptoNewsLand1u geleden
Crypto Fear and Greed Index Rises to 47, Signaling Neutral Market Sentiment
Gate News message, April 27 — According to Alternative.me, the Crypto Fear and Greed Index stands at 47 today, indicating a neutral market sentiment. The index rose from 33 yesterday (April 26), reflecting a shift toward more balanced market
GateNews2u geleden
Whale pension-usdt.eth's $110M Short on BTC and ETH Down $15.25M as April Rally Continues
Gate News message, April 27 — According to on-chain analyst Yujin's monitoring, whale pension-usdt.eth opened a 3x leveraged short position on $110 million worth of BTC and ETH near the start of April, but has since incurred a floating loss of $15.25 million as prices rallied throughout the month.
GateNews2u geleden
BNB Price Steady Above $633 as Bulls Face Strong Barriers
Key Insights:
BNB holds above the 50-day EMA near $633, supported by whale activity, while mixed derivatives data keep price action within a consolidation range.
Technical indicators, including RSI and MACD, show mild bullish momentum, though strong resistance levels near $662 and $680
CryptoNewsLand7u geleden
Chainlink Price Tightens as $10 Resistance Holds Firm
Key Insights:
Chainlink trades between $8.5 and $10 as a tightening range signals volatility expansion, with buyers showing early strength through higher lows formation.
Open interest drops to $380 million while persistent spot outflows indicate cautious sentiment, though declining selling p
CryptoNewsLand7u geleden