
**Date: **Tue, Jan 06, 2026 | 06:20 AM GMT
The broader cryptocurrency market continues to show fresh strength as 2026 unfolds. Bitcoin (BTC) and Ethereum (ETH) are both up more than 7% on the week, helping improve overall market sentiment. This renewed momentum is gradually spreading across major altcoins — including Pi Network (PI).
While PI has recorded a modest 5% gain over the past week, the more important development is taking shape on the chart. On lower timeframes, price action is compressing into a well-defined bullish structure, suggesting the token may be preparing for a meaningful breakout if resistance is reclaimed.
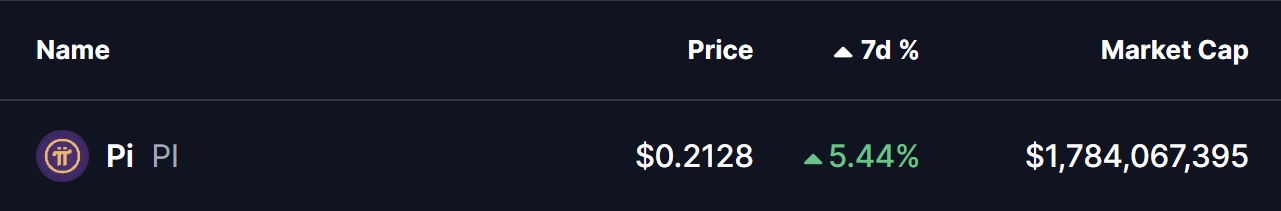
Source: Coinmarketcap
Ascending Triangle Taking Shape
On the 4-hour chart, Pi Network is forming a clear ascending triangle pattern. This structure is defined by a series of higher lows pressing steadily into a flat resistance zone, signaling persistent buying interest despite repeated rejections at the same level. Ascending triangles are widely considered bullish continuation patterns, particularly when they develop after an extended consolidation phase.
PI recently bounced cleanly from its rising support trendline, once again pushing price toward the upper boundary of the triangle around the $0.2129–$0.2160 region. The ability to repeatedly defend higher lows suggests that buyers remain in control and are willing to accumulate on dips rather than exit positions.
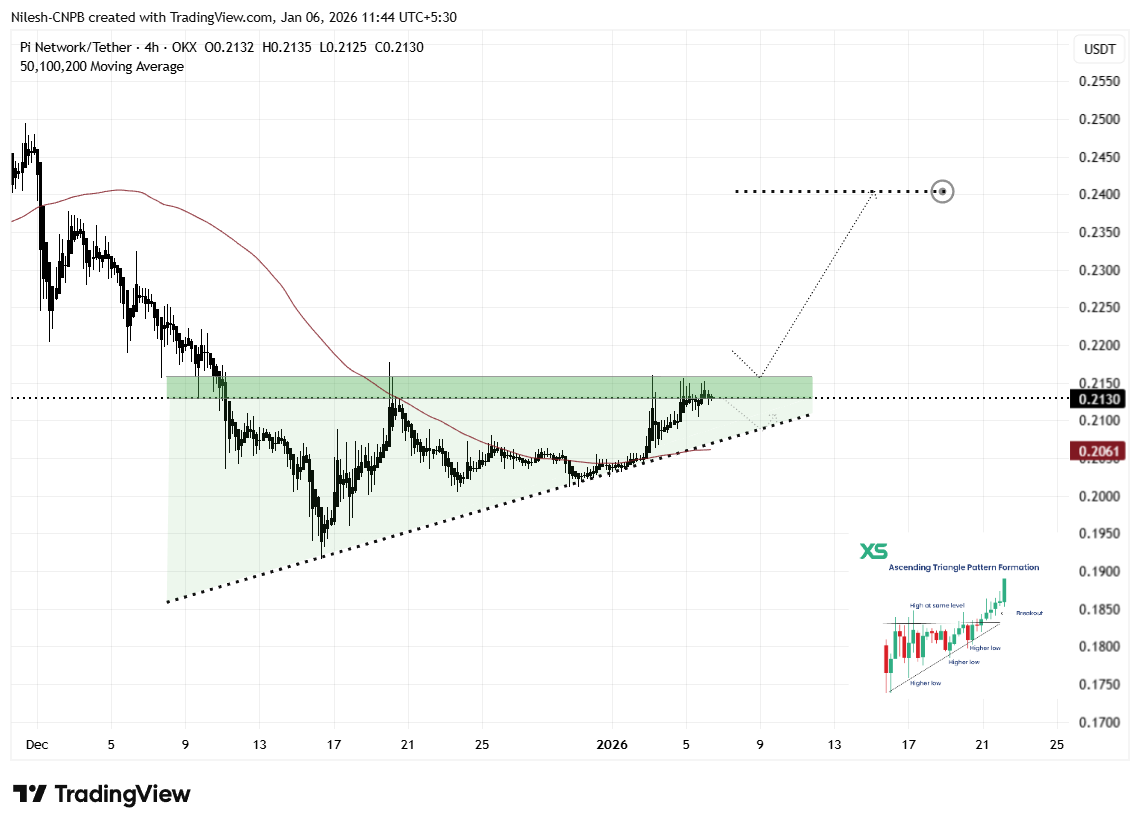
_ Pi Network (PI) 4H Chart/Coinsprobe (Source: Tradingview)_
Rather than signaling weakness, this sideways-to-higher price action reflects healthy consolidation. Volatility continues to compress, which often precedes a larger directional move as the market approaches a decision point.
What’s Next for PI?
From here, PI appears set for another test of the $0.2160 resistance zone. A decisive breakout above this level, followed by sustained acceptance and a successful retest as support, would confirm the ascending triangle structure and likely trigger a stronger bullish expansion.
Based on the measured move of the pattern, the technical upside projection points toward the $0.2404 area. This represents a potential upside of roughly 13% from current levels and also aligns with previous price structure, reinforcing the bullish case.
That said, caution remains important. If PI fails to break above resistance, price could rotate back toward the rising support trendline once again. As long as this ascending support holds, the broader bullish structure remains intact. A clear breakdown below the trendline, however, would invalidate the pattern and delay any breakout scenario.
For now, the combination of improving market sentiment and a tightening ascending triangle suggests Pi Network is approaching a critical inflection point — one that could define its next major move as the new year progresses.
Disclaimer: The views and analysis presented in this article are for informational purposes only and reflect the author’s perspective, not financial advice. Technical patterns and indicators discussed are subject to market volatility and may or may not yield the anticipated results. Investors are advised to exercise caution, conduct independent research, and make decisions aligned with their individual risk tolerance.
About Author: Nilesh Hembade is the Founder and Lead Author of Coinsprobe, with over 5 years of experience in the cryptocurrency and blockchain industry. Since launching Coinsprobe in 2023, he has been providing daily, research-driven insights through in-depth market analysis, on-chain data, and technical research.
Disclaimer: The information on this page may come from third parties and does not represent the views or opinions of Gate. The content displayed on this page is for reference only and does not constitute any financial, investment, or legal advice. Gate does not guarantee the accuracy or completeness of the information and shall not be liable for any losses arising from the use of this information. Virtual asset investments carry high risks and are subject to significant price volatility. You may lose all of your invested principal. Please fully understand the relevant risks and make prudent decisions based on your own financial situation and risk tolerance. For details, please refer to
Disclaimer.
Related Articles
Tokyo becomes the DeFi speed center? Hyperliquid trading latency difference reaches 200 milliseconds.
Glassnode’s research shows that on the decentralized exchange Hyperliquid, traders’ geographic locations significantly affect trading performance. Users in Tokyo have a notable latency advantage, and the global network distribution can’t overcome the physical limitations of infrastructure. This has sparked new discussions about decentralization fairness, pointing out that this is similar to low-latency competition in traditional finance. As institutional capital moves in, the market is shifting toward performance-driven dynamics.
GateNews2m ago
Gold plummets, "safe haven for funds" changes hands? JPMorgan: During the war, "Bitcoin becomes the new favorite for hedging."
JPMorgan pointed out that in the Middle East conflict, Bitcoin has shown strong resilience against declines, with significant capital inflows and active trading, while gold and silver are facing capital outflows. Under high interest rates and strong dollar pressure, gold prices have dropped by about 15%. With its borderless characteristics, Bitcoin has become a safe-haven choice, and institutional investors are also adjusting their positions, indicating a decrease in gold liquidity while Bitcoin liquidity is increasing.
区块客5m ago
Analyst: TD Sequential Flashes Buy Signals for These 2 Popular Altcoins
Two of the largest and most popular altcoins might be prone to big upward moves ahead, at least according to Ali Martinez, who outlined the TD Sequential as the indicator suggesting these breakouts.
Namely, those are DOGE, which continues to struggle well below $0.10, and ADA, which has fallen
CryptoPotato1h ago
ETH breaks below a key support level, forming a bear flag pattern
Ethereum has currently broken below a key support level, presenting a bearish flag pattern, indicating a potential continuation of the downward trend. Trading volume is sluggish, market participation is insufficient, and there is a continued net outflow from ETFs. The minting of USDC has slowed, liquidity recovery is unstable, and time is needed to repair demand.
GateNews1h ago
XRP Today News: CLARITY Bill Blocked, Bull and Bear Battle at $1.30
XRP fell 0.81% over the past 24 hours, trading at about $1.33, indicating insufficient bullish momentum. The 《CLARITY Act》 has again been stalled due to regulatory disputes over stablecoin yield rates, with the legislative process stalled for more than a year. XRP’s technical analysis shows downside pressure, with a key support level at $1.30 and a resistance level at $1.38. In the short term, market sentiment remains cautious due to regulatory uncertainty.
MarketWhisper1h ago
Iranian Parliament Speaker Warns Market Manipulation Using The US-Iran Conflict
Speaker MB Ghalibaf of the Iranian Parliament warned investors of market manipulation tied to the US-Iran war, advising them to trade against misleading narratives. His comments sparked mixed reactions online, highlighting the broader impact of geopolitical tensions on markets.
Blockzeit2h ago
