On-chain analyst NoLimitGains revealed a rare and critical market shift: long-term Bitcoin holders are distributing tokens rather than continuing to hoard. These Bitcoins that have been held for over 155 days typically remain dormant during periods of severe market fluctuation, but there has been a consistent net sell-off over the past three months. This dumping coincided with Bitcoin's price dropping from a high of $126,000 to around $88,000, a decline of 30%.
155 Threshold: The Watershed Between Speculators and Believers
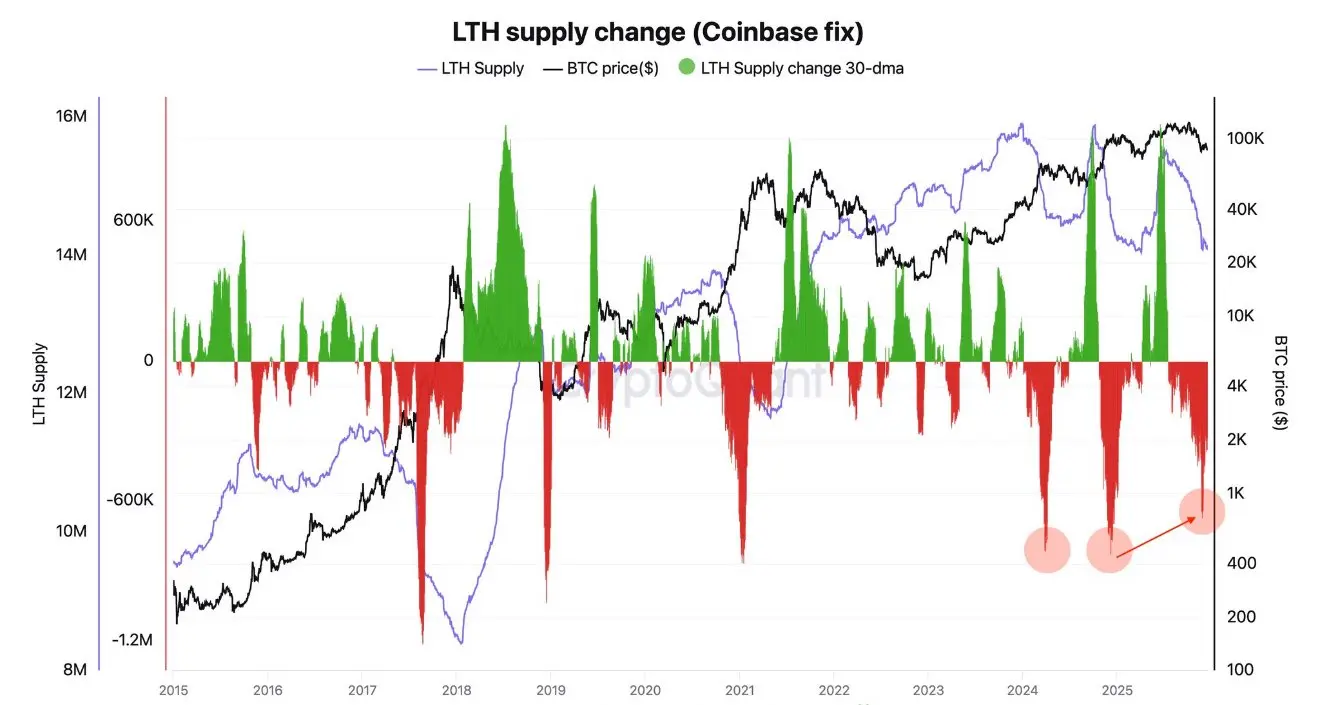
(Source: CryptoQuant)
The core indicator for on-chain data tracking is Bitcoin held for more than 155 days (about 5 months). This time threshold holds significant meaning in cryptocurrency analysis, as it effectively distinguishes between short-term speculators and long-term holders. Short-term speculators typically enter and exit the market within weeks or months and are highly sensitive to price fluctuations. In contrast, investors who hold for more than 155 days often represent a strong conviction, having experienced at least one complete market fluctuation cycle yet still choosing to hold.
Historical data shows that these long-term holders tend to remain subdued during periods of market uncertainty. They often hold on even during significant market fluctuations and only sell near the peak of a cycle. This behavior pattern makes the movements of long-term holders an important leading indicator of market sentiment. When they start to dump significantly, it often signals a major shift in market structure — either the arrival of a cycle top or the beginning of a long-term consolidation phase.
However, in the past three months, this traditional pattern has been broken. The on-chain charts clearly show that Bitcoin has been experiencing net selling, with long-term holders putting a large amount of Bitcoin back into the market. This shift has immediately attracted the attention of the market, as it contradicts the typical behavior of “diamond hands” long-term holders. These investors seldom react to market noise; they are more focused on structural changes. Their selling behavior indicates a decrease in confidence regarding the recent rise or the belief that the cycle has peaked.
Market Impact of 300 Billion USD in Dormant Supply
Analysts estimate that nearly $300 billion worth of previously inactive Bitcoin will be transferred during 2025. To understand the significance of this figure, it needs to be placed in the context of the total Bitcoin market capitalization. The current total market cap of Bitcoin is approximately $1.7 trillion, and $300 billion accounts for 17.6% of the total market cap. This represents one of the largest releases of dormant supply in recent cycles, with its market impact potentially lasting several quarters.
When long-term holders sell, the market requires strong new demand to absorb this supply. Without such demand, prices will come under pressure. This supply-demand dynamic can be explained by simple economic principles: when a large number of sell orders enter the market while buy orders cannot grow in sync, prices must inevitably fall to attract new buyers to enter the market. History shows that this dynamic often limits Bitcoin's upward trend in the medium to short term, even if the long-term trend remains upward.
Three Possible Reasons for Long-term Holder Dumping
Psychological Peak of the Cycle: Some investors believe that Bitcoin has risen from the bear market low of $15,000 in 2022 to $126,000, an increase of more than 8 times, completing the main rise of this cycle, and are choosing to take profits.
Expectations of Macroeconomic Pressure: Concerns about a global economic recession, a shift in Federal Reserve policy, or geopolitical risks lead to a choice to reduce risk exposure in advance by converting Bitcoin into fiat currency or other safe-haven assets.
Strategic Asset Rotation: Long-term investors may shift funds from Bitcoin to Ethereum, Solana, or other high-growth potential crypto assets in pursuit of higher returns.
The timing of this dumping further reinforces the aforementioned signals. The sell-off by long-term holders coincided with Bitcoin's price falling from nearly $126,000 in October to around $88,000 currently, a drop of 30%. This synchronicity suggests that they may have sensed a market turning point in advance, or that their dumping itself is one of the significant factors leading to the price decline.
Surrender or Strategic Rotation? Clues Provided by History
This dumping does not necessarily lead to a bear market. In past cycles, similar dumping phases have also appeared near local tops or cycle tops. They usually indicate a longer consolidation period, rather than an immediate crash. For example, from April to July 2021, Bitcoin fell from $64,000 to $29,000, a drop of over 50%, during which there was also a massive dumping by long-term holders. However, after several months of consolidation, Bitcoin reached a new high of $69,000 in November 2021.
The key lies in understanding the phase of the cycle. If we are currently at the cycle peak, then the selling by long-term holders may indicate a bear market lasting several months or even years. If it is just a local peak, then after a short-term adjustment and consolidation, the market may regain momentum and reach new highs. The basis for judgment includes the macro liquidity environment, the strength of institutional demand, and whether the technical support levels hold.
Once weak investors digest the dumping, the market will eventually stabilize. This process is called “distribution,” which refers to the transfer of chips from long-term holders to new buyers. The health of the distribution determines the subsequent trend. If the buyers are mainly short-term speculators, the market will become weak and the fluctuation will increase. If the buyers include long-term funds such as ETFs, institutions, and high-net-worth individuals, the market bottom will be more solid.
The current key variable remains the strength of demand from ETFs, institutions, and global liquidity. Since the launch of the US spot Bitcoin ETF in early 2024, cumulative net inflows have exceeded tens of billions of dollars, becoming an important force in absorbing long-term holder dumping. However, if ETF inflows slow down or turn into outflows, the market will lack sufficient buying support, and prices may fall further.
The key test the market is facing now
Bitcoin has now entered a critical phase. It must prove that it can absorb the supply from long-term holders without disrupting the structure. If demand increases, the allocation could bring about healthy rotation — old chips transferring to newcomers, allowing the market to reaccumulate upward momentum. If demand continues to be weak, the price may struggle to return to previous highs and could even test deeper support levels such as $70,000 or $60,000.
The behavior of long-term holders sets the tone, but subsequent actions determine the direction. Based on historical experience, when long-term holders complete their dumping and start to accumulate again, it often signifies the beginning of a new upward cycle. Key indicators include: whether the supply held by long-term holders has bottomed and rebounded, whether the on-chain exchange reserves have decreased (indicating withdrawals to cold wallets), and whether whale addresses have started accumulating again.
For investors, it is crucial to remain highly vigilant at this stage. Blindly bottom-fishing may catch the falling knife too early, but completely exiting could also mean missing the bottom rebound. A rational strategy is to closely monitor on-chain data changes, especially when the supply trend of long-term holders hits the bottom, as well as whether the funds from institutions and ETFs are reverting to net inflows.
Related Articles
Hyperliquid whale puts on a short position in Bitcoin worth 53 million, the market is wary of downside risk
On the decentralized sustainable derivatives exchange Hyperliquid, a whale trader opened a leveraged short Bitcoin position worth $53.0 million, with a liquidation price of $80,630. At the same time, the trader also holds short positions in silver and multiple altcoins, as well as a long position in Brent crude oil, reflecting its bearish outlook on the current market. Geopolitics, regulatory uncertainty, and the upcoming employment data make up the threefold pressure weighing on this week’s market.
MarketWhisper17m ago
BTC 15-minute surge 0.80%: spot incremental buy orders and changes in the order book structure drive a price breakout
From 2026-03-31 01:15 to 2026-03-31 01:30 (UTC), BTC showed a clear breakout move. The candlestick data indicates a return rate of +0.80%, with the price ranging between 67,241.1 and 67,884.3 USDT, and a recorded amplitude of 0.96%. During this period, trading activity in the market was active, risk appetite rebounded, and short-term bullish sentiment dominated, driving the price to break through local resistance.
The main driving forces behind this breakout were the synchronized rise in trading volume across the spot and derivatives (futures/perpetual) markets, along with a significant net inflow of funds into exchanges. The spot trading volume surged sharply compared with the average value of the previous hour.
GateNews42m ago
Bitcoin (BTC) Stuck in a ‘No Trade Zone:’ When Is the Next Big Move Coming?
The primary cryptocurrency has experienced significant volatility lately, mainly due to the geopolitical tension caused by the war in the Middle East.
One popular analyst described the current price area as a “no-trade zone,” arguing that a clear move in either direction will depend on how BTC
CryptoPotato1h ago
Why is Bitcoin up today? Trump pauses strikes on Iranian energy facilities, and the Fed signals support for risk markets
Bitcoin rebounded to above $67,000 on March 31, mainly driven by signals from U.S.-Iran diplomacy and the Federal Reserve’s decision to keep interest rates unchanged. Market sentiment temporarily improved, but Iran’s Ministry of Foreign Affairs said that the lack of direct negotiations could limit the rebound. The potential impact of the Strait of Hormuz toll bill on supply chains is pushing up oil prices and putting pressure on the market; it’s important to closely monitor future price movements.
MarketWhisper1h ago
Today’s Crypto Fear and Greed Index rose to 11, and the market is in a state of extreme fear
Gate News, March 31, according to Alternative.me data, today the crypto Fear and Greed Index rose to 11, putting the market in extreme fear. Yesterday, the index was 8, also in extreme fear.
GateNews1h ago
Why Higher XRP Prices Make Payments Cheaper, Ripple’s Schwartz Clarifies Misconception
A key misunderstanding around XRP is being clarified in a way that reframes its upside, showing that higher prices can enhance payment efficiency, strengthen liquidity dynamics, and position the asset more competitively for large-scale global transactions.
XRP Price Efficiency Liquidity
Coinpedia1h ago
