
Gold is under pressure, and the chart is starting to tell a clear story. Right now, price is in a steady downtrend, forming what traders often call a “waterfall” pattern.
Each bounce has been weak, and sellers keep stepping in to push the gold price lower. This kind of structure usually signals that the market isn’t done falling yet.
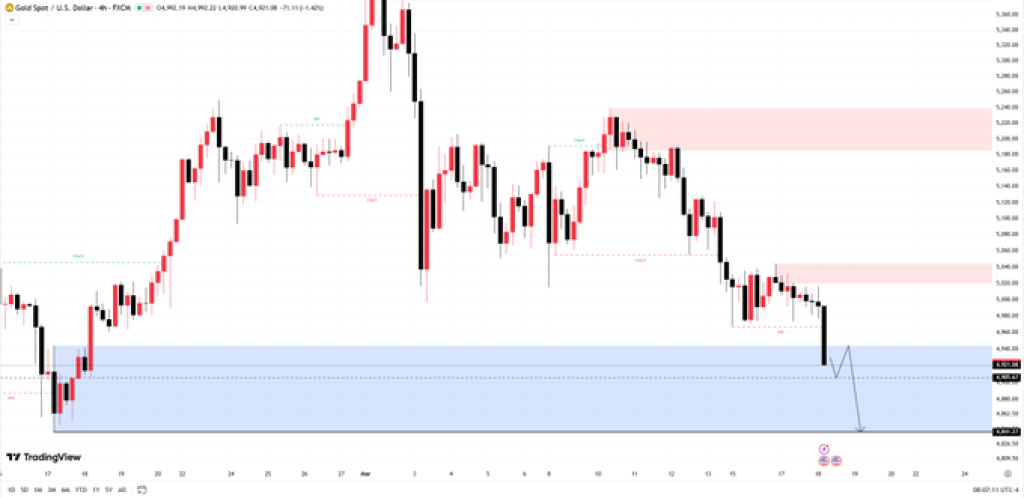
We took a look at the chart and gold has lower highs and lower lows, indicating that the price is indeed in a bearish trend. As we can see, the price has been declining since it was rejected at the upper supply zone, and it’s currently nearing the next support area, as indicated in the chart in blue.
This zone is important because it has acted as a reaction point before. You can already see price slowing down slightly as it enters this area, which suggests buyers are trying to step in. But so far, there’s no strong sign of a reversal, just a pause in the decline.
The small projected move on the chart shows a possible short-term bounce from this support, followed by another leg down. That aligns with the idea that the market may not be finished with its downward move.
_****How Much Could $2,000 in Stellar (XLM) Be Worth By 2027?**
Source: X/Mary Taylor
The Key Level Everyone Is Watching For Gold Price
The level to watch right now is 4905. If gold manages to hold above this level, we could see a brief relief bounce. But based on the current momentum, that bounce may not last long. It would likely be a temporary move before sellers regain control.
On the other hand, if the gold price breaks cleanly below 4905, it opens the door for a deeper drop toward 4841. That’s the next major downside target, and it’s where the market could head quickly if selling pressure increases.
The FOMC Factor
All of this is happening right before the FOMC announcement, which adds another layer of uncertainty.
Events like this often bring sharp volatility. The gold price can spike in both directions before choosing a clear trend. This is what traders call a “shakeout,” where sudden moves take out both buyers and sellers who are positioned too early.
This means that, even if the levels are clear, the way to them is messy.
However, the gold price remains bearish in the short term, and the chart indicates that it could go lower. The $4905 level is the line in the sand, as breaking it could lead to a quick drop down towards 4841.
With the FOMC decision in play, the market could move fast. So the real question isn’t just where gold is going, but how it gets there, and who manages to stay in the trade long enough to benefit.
Disclaimer: The information on this page may come from third parties and does not represent the views or opinions of Gate. The content displayed on this page is for reference only and does not constitute any financial, investment, or legal advice. Gate does not guarantee the accuracy or completeness of the information and shall not be liable for any losses arising from the use of this information. Virtual asset investments carry high risks and are subject to significant price volatility. You may lose all of your invested principal. Please fully understand the relevant risks and make prudent decisions based on your own financial situation and risk tolerance. For details, please refer to
Disclaimer.
