
RIVER has had one of the more compelling stories in crypto over the past week. After the recent airdrop and ecosystem announcements, the token attracted strong buying interest. that pushed it well above previous consolidation levels.
Now, as the initial hype settles, The chart is showing something that technical traders love to see: structure. Sjuul from AltCryptoGems indicated the move on X, noting that the RIVER price is still pushing higher after that textbook move. His assessment is simple but meaningful: it is a bullish chart
- The RIVER 12-Hour Chart Reveals Clean Structure
- Current Price Action and Key Levels
- What Comes Next for RIVER
The RIVER 12-Hour Chart Reveals Clean Structure
Looking at the 12-hour chart, the setup is clear. The RIVER price had been trading in a range between approximately $16.00 and $20.00 for several weeks, building a base after the initial launch volatility. The breakout from this range came with the recent airdrop news, pushing the RIVER price above $20.00 for the first time.
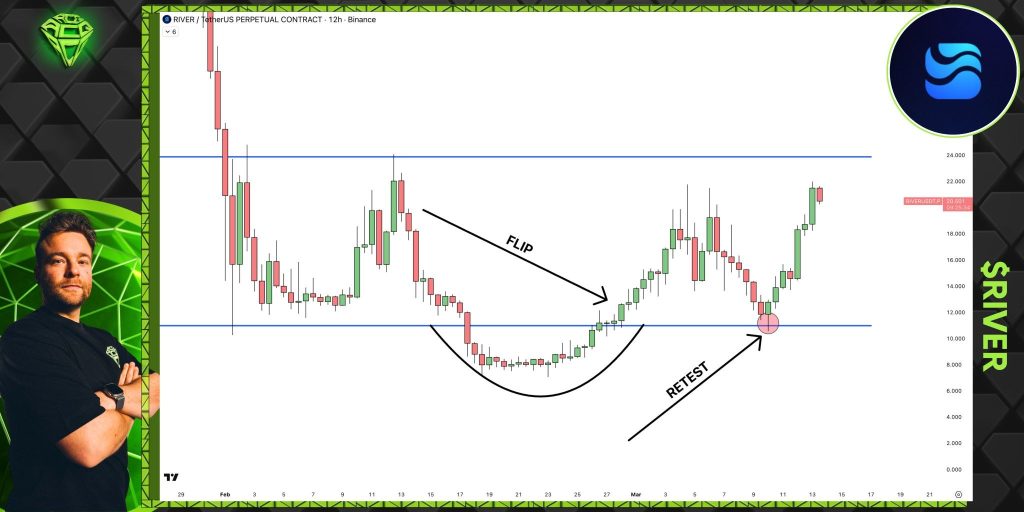
Source: X/@altcryptogems
What matters now is what happened next. Instead of reversing back into the range, the RIVER price held above the breakout level and began consolidating in a new, higher range. This is the textbook behavior that Sjuul references.
The chart labels a clear FLIP level where former resistance near $20.00 has now become support. Below this, a zone labeled RETEST appears, which shows where the price retraced to retest the breakout before proceeding with its uptrend. This shows that buyers are ready to buy the asset.
Current Price Action and Key Levels
The RIVER price currently trades at a level around $20.50, a level slightly above the turned support level. This price move took the token to a new high of around $24.00, a move that indicates the buyers’ commitment to taking River to new heights.
However, the current pullback from the new price high has been minor, and River currently trades significantly above the breakout level. The token currently faces resistance at the fresh price high of around $24.00. If the price breaks through this level, it could target the level of around $26.00 to $28.00.
On the other hand, the turned support level of around $20.00 currently acts as the token’’s initial support level. If the River price fails to stay above the level of $20.00, it could target the level of around $18.50, the former range high.
RIVER needs to stay significantly above the level of $20.00 for the bullish scenario to remain valid. If the price fails to stay above the level of $20.00, the breakout could be a false breakout.
Read Also: The Math Behind XRP Price Hitting $1,000+: Analyst Breaks Down the Numbers
**What Comes Next for RIVER **
The RIVER price now sits at a decision point. The trend still appears to favor the higher end as long as the level of $20.00 acts as support. If the price does rise, the next level to target would likely be around the level of $24.00, and then a breach of that level could lead to the level of $26.00 or more.
On the other hand, a breach of the level of $20.00 could jeopardize the current scenario, potentially taking the price back to the level of $18.50. For now, Sjuul’s assessment holds. The RIVER price is pushing higher after a textbook move, and the bullish structure remains intact.
Penafian: Informasi di halaman ini dapat berasal dari pihak ketiga dan tidak mewakili pandangan atau opini Gate. Konten yang ditampilkan hanya untuk tujuan referensi dan bukan merupakan nasihat keuangan, investasi, atau hukum. Gate tidak menjamin keakuratan maupun kelengkapan informasi dan tidak bertanggung jawab atas kerugian apa pun yang timbul akibat penggunaan informasi ini. Investasi aset virtual memiliki risiko tinggi dan rentan terhadap volatilitas harga yang signifikan. Anda dapat kehilangan seluruh modal yang diinvestasikan. Harap pahami sepenuhnya risiko yang terkait dan buat keputusan secara bijak berdasarkan kondisi keuangan serta toleransi risiko Anda sendiri. Untuk detail lebih lanjut, silakan merujuk ke
Penafian.
Artikel Terkait
Bitcoin Kembali di Atas $70,000, Saham Teknologi Asia Turun dan Emas Menguat Memberi Tekanan
Harga Bitcoin memantul di atas $70,000 pada 20 Maret, dengan kapitalisasi pasar sekitar $1.41 triliun, tetapi kenaikan dibatasi oleh penurunan saham teknologi dan peningkatan permintaan aset safe-haven. Arus dana institusional keluar menunjukkan permintaan Bitcoin melambat, dan investor perlu memperhatikan dinamika pasar untuk mengevaluasi risiko potensial.
GateNews13menit yang lalu
Harga Bitcoin kembali menunjukkan pola penurunan tajam sebelumnya, dengan $65.800 sebagai level dukungan utama
Tren harga Bitcoin serupa dengan tahun lalu, saat ini sekitar 70.335 dolar, menunjukkan potensi tekanan pasar. Jika menembus di bawah 65.800 dolar, mungkin akan menghadapi putaran penurunan baru; terobosan ke atas dapat diharapkan untuk rebound. Sentimen pasar berhati-hati, investor perlu memperhatikan level support dan resistance kunci, waspada terhadap risiko penurunan sekaligus bersiap untuk rally bullish.
GateNews15menit yang lalu
Harga Hyperliquid Melompat 22% saat Perdagangan Komoditas Mencapai Rekor
Key Insights:
Hyperliquid melonjak lebih dari 20% mingguan, didorong oleh volume perdagangan futures komoditas rekor, terutama kontrak minyak dan perak, mendapatkan traksi kuat di kalangan trader.
Aktivitas whale melampaui $3.6 miliar dalam posisi leverage, meningkatkan likuiditas dan memperkuat momentum naik.
CryptoFrontNews18menit yang lalu
Pi Network (PI) menunjukkan sinyal pemulihan awal setelah upgrade mainnet baru
Upgrade terbaru Pi Network ke mainnet versi 20 memungkinkan deployment smart contract, mendorong pengembangan ekosistem. Namun, token PI menghadapi tekanan menurun, berdagang di bawah level resistansi dengan indikator teknis bearish. Pemulihan tergantung pada melampaui zona resistansi $0.1950–$0.2000.
TapChiBitcoin23menit yang lalu
Bittensor Mengalami Penguatan tetapi Menghadapi Resistansi Dekat Level $285
Key Insights:
Bittensor mempertahankan momentum jangka pendek yang kuat di atas rata-rata kunci, sementara perkembangan ETF dan tingkat staking tinggi terus membentuk dinamika likuiditas dan permintaan investor.
Indikator teknis overbought menandakan kondisi yang terlalu terentang, bahkan ketika momentum bullish terus berlanjut.
CryptoFrontNews28menit yang lalu
Chart Cardano Baru Saja Mencetak "Hitam 9" – Inilah Kemungkinan Harga ADA Selanjutnya
Ali Martinez menyoroti sinyal teknis yang signifikan untuk Cardano, khususnya indikator TD Sequential menunjukkan "black 9," yang menunjukkan potensi pembalikan harga setelah tren turun yang berkepanjangan. Jika ADA mempertahankan support di $0.23, dapat naik ke $0.32 dan $0.37. Namun, kegagalan untuk mempertahankan level ini mungkin membatalkan setup bullish.
CaptainAltcoin38menit yang lalu
