ybaser
🎰 每日觀看直播 — 別浪費你的積分
觀看賺錢獎金嘉年華 | 剩餘3天
🏆 排行榜獎勵 按熱度積分排名前10的用戶將獲得2份額外的Gate周邊禮物
📌 今日必做任務
1️⃣ 訪問頁面 +5: www.gate.com/live
2️⃣ 觀看直播5分鐘 +10
3️⃣ 留下評論 +10
4️⃣ 複製主播的交易策略並完成跟單 +50
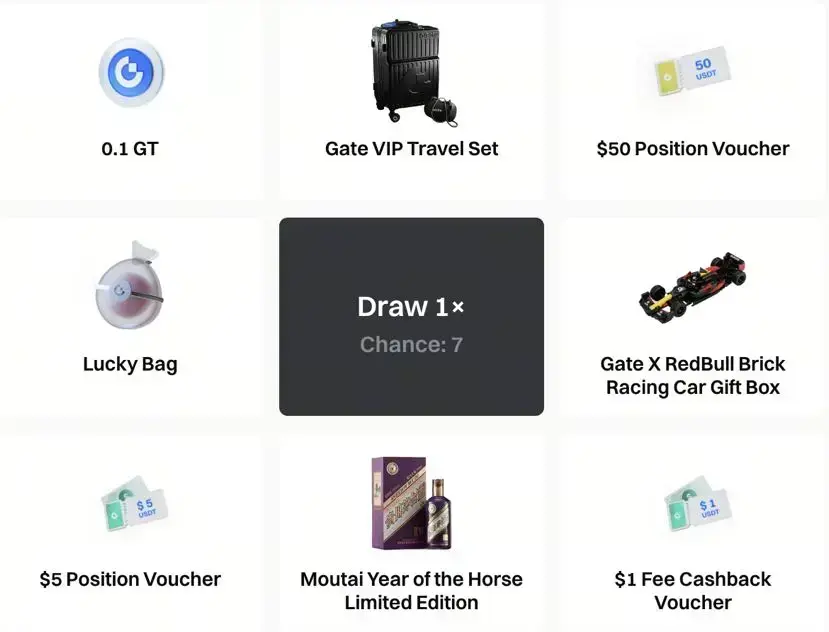
🎰 80熱度積分 = 1次抽獎
🎁 大獎 本輪馬年限定茅台Gate VIP獨家旅行禮盒Gate × Red Bull磚塊賽車禮盒
👉 立即抽獎 https://www.gate.com/activities/watch-to-earn?now_period=17
查看原文觀看賺錢獎金嘉年華 | 剩餘3天
🏆 排行榜獎勵 按熱度積分排名前10的用戶將獲得2份額外的Gate周邊禮物
📌 今日必做任務
1️⃣ 訪問頁面 +5: www.gate.com/live
2️⃣ 觀看直播5分鐘 +10
3️⃣ 留下評論 +10
4️⃣ 複製主播的交易策略並完成跟單 +50
🎰 80熱度積分 = 1次抽獎
🎁 大獎 本輪馬年限定茅台Gate VIP獨家旅行禮盒Gate × Red Bull磚塊賽車禮盒
👉 立即抽獎 https://www.gate.com/activities/watch-to-earn?now_period=17
- 讚賞
- 5
- 2
- 轉發
- 分享
楚老魔:
堅定HODL💎查看更多

- 讚賞
- 2
- 2
- 轉發
- 分享
大美无量天尊:
馬上爆炸式出貨。。你們會灰飛煙滅查看更多
2026.3.15📊 今日行情分析(BTC/ETH 1小時級別)
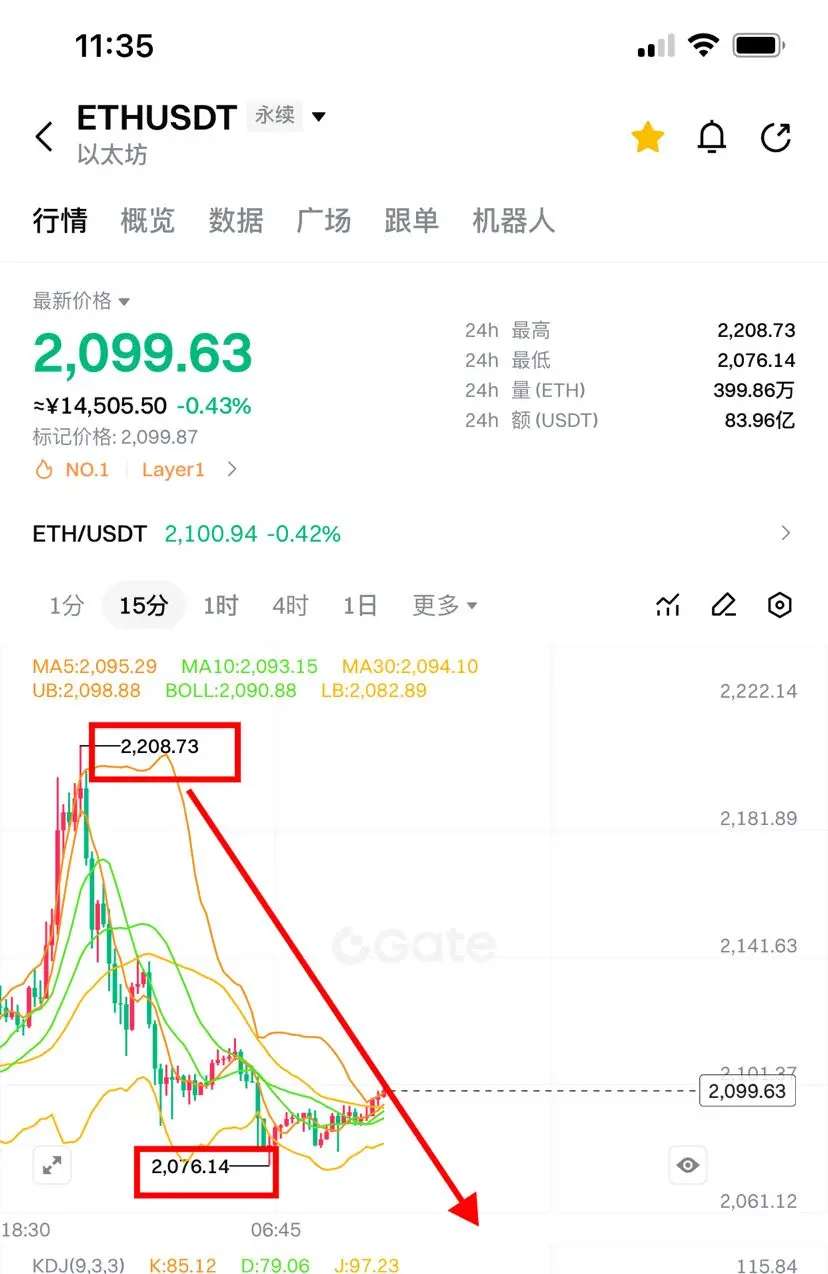
1. ETHUSDT 走勢分析
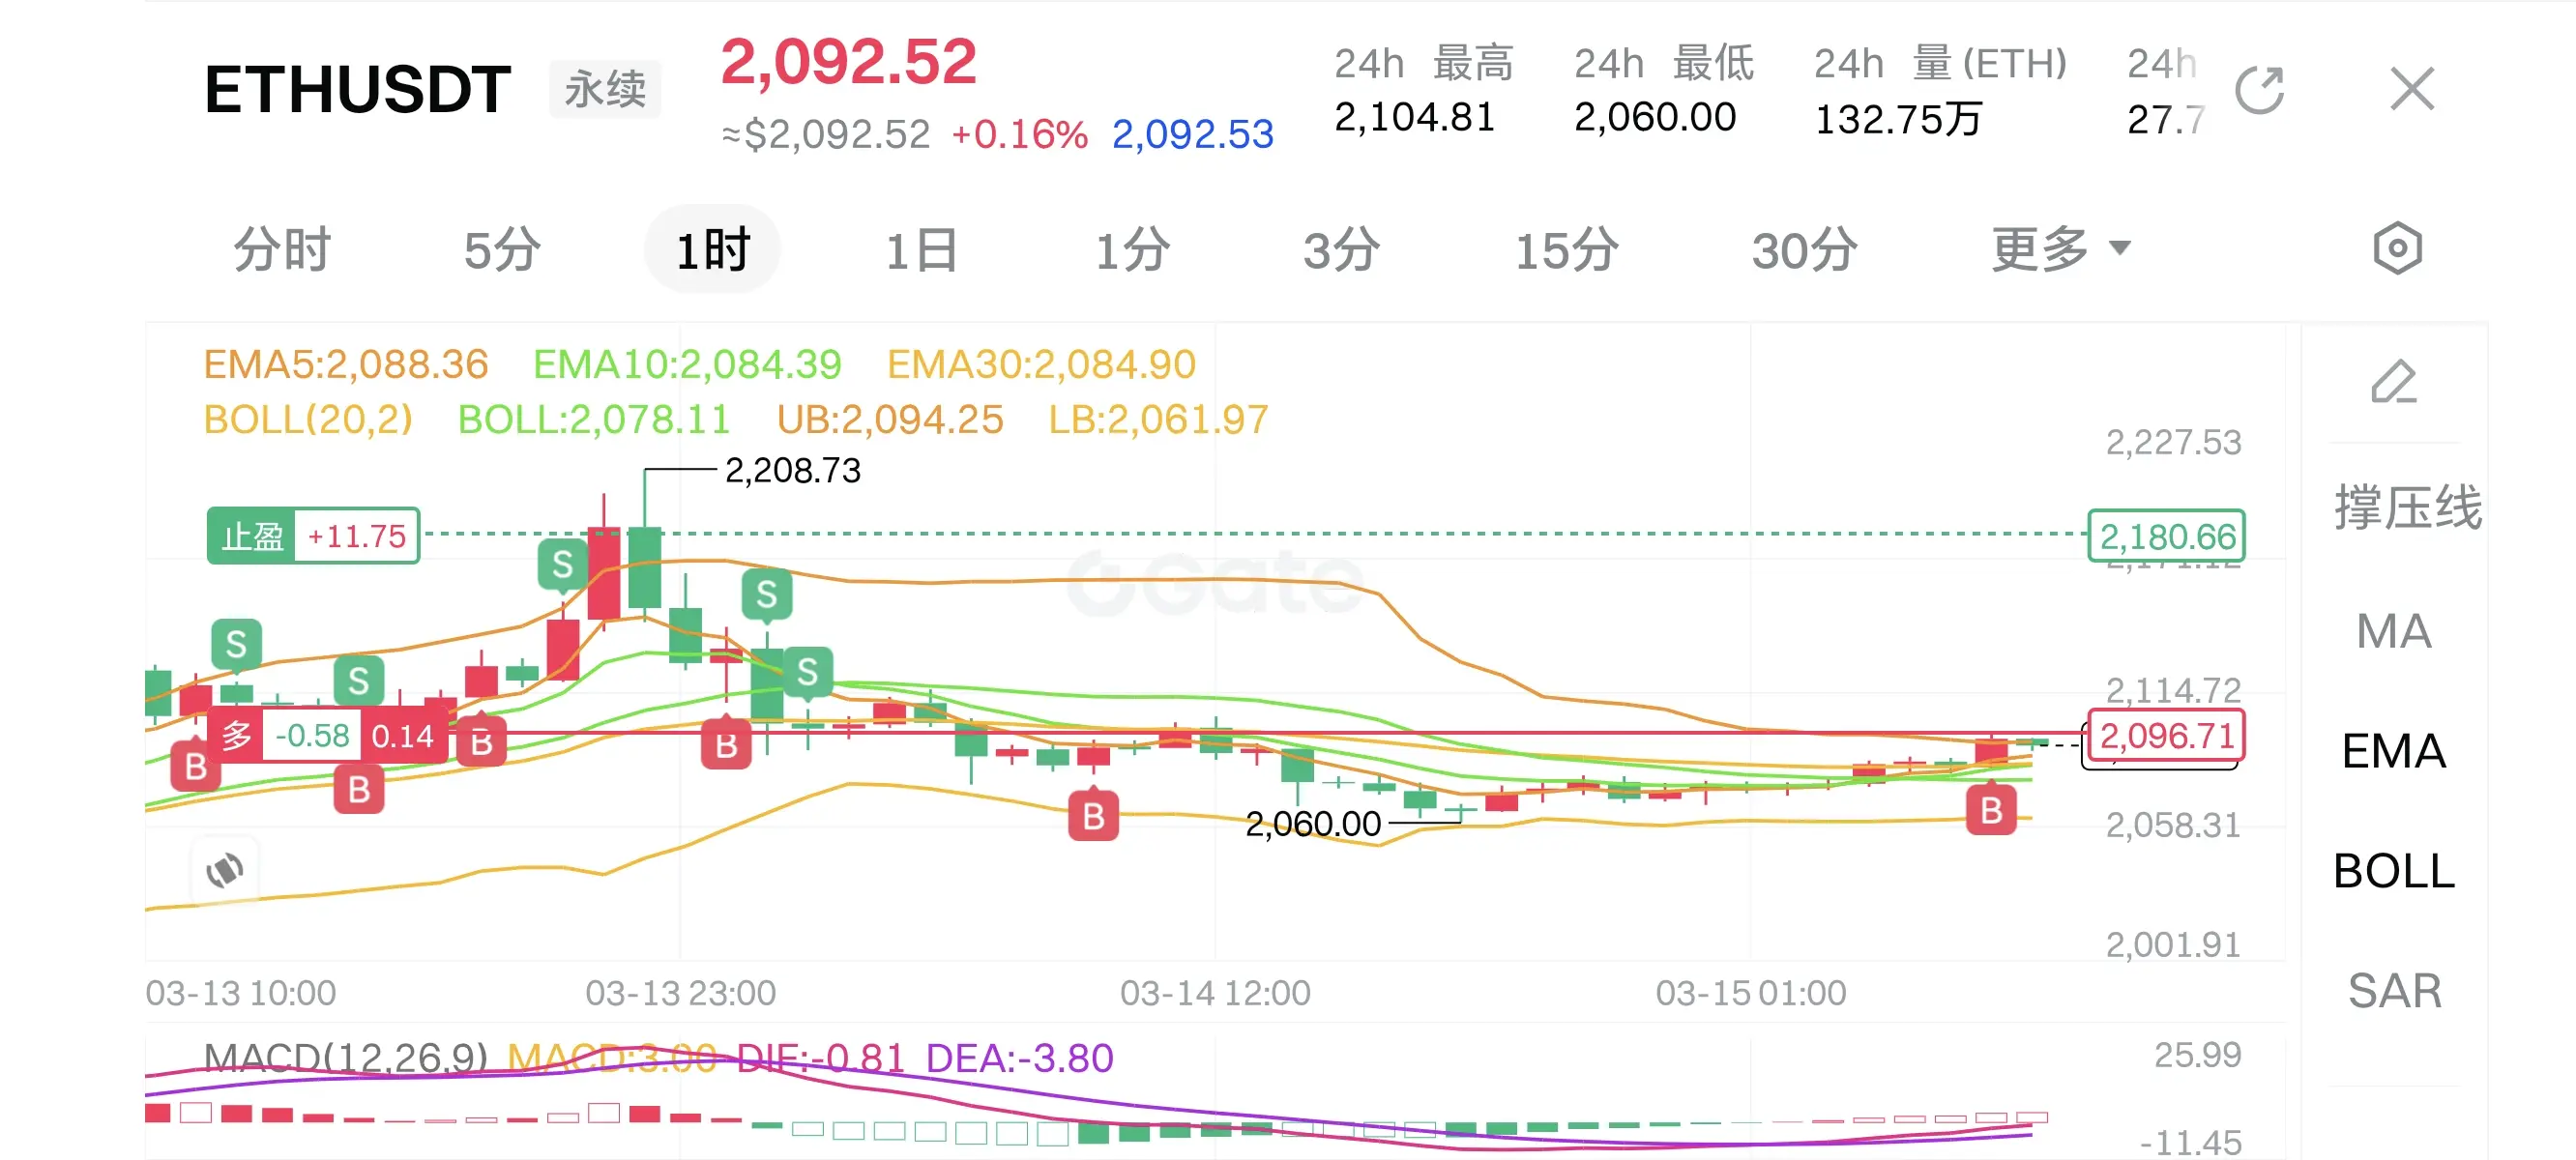
- 價格與指標:當前價格 $2,092.52,位於 EMA5($2,088.36) 上方、EMA10/30($2,084.39/2,084.90) 上方,短期偏強;布林帶(BOLL)中軌 $2,078.11,上軌 $2,094.25,下軌 $2,061.97,價格貼近上軌,短期有上衝動能但接近阻力。
- MACD:DIF(-0.81)、DEA(-3.80),MACD柱為正且在收窄,空頭動能減弱,多頭開始蓄力,但尚未形成金叉,趨勢反轉信號較弱。
- 關鍵價位:
- 阻力:$2,094.25(布林上軌)、$2,100、$2,114.72(EMA30 前高)
- 支撐:$2,088(EMA5)、$2,084(EMA10/30)、$2,061.97(布林下軌)
2. BTCUSDT 走勢分析
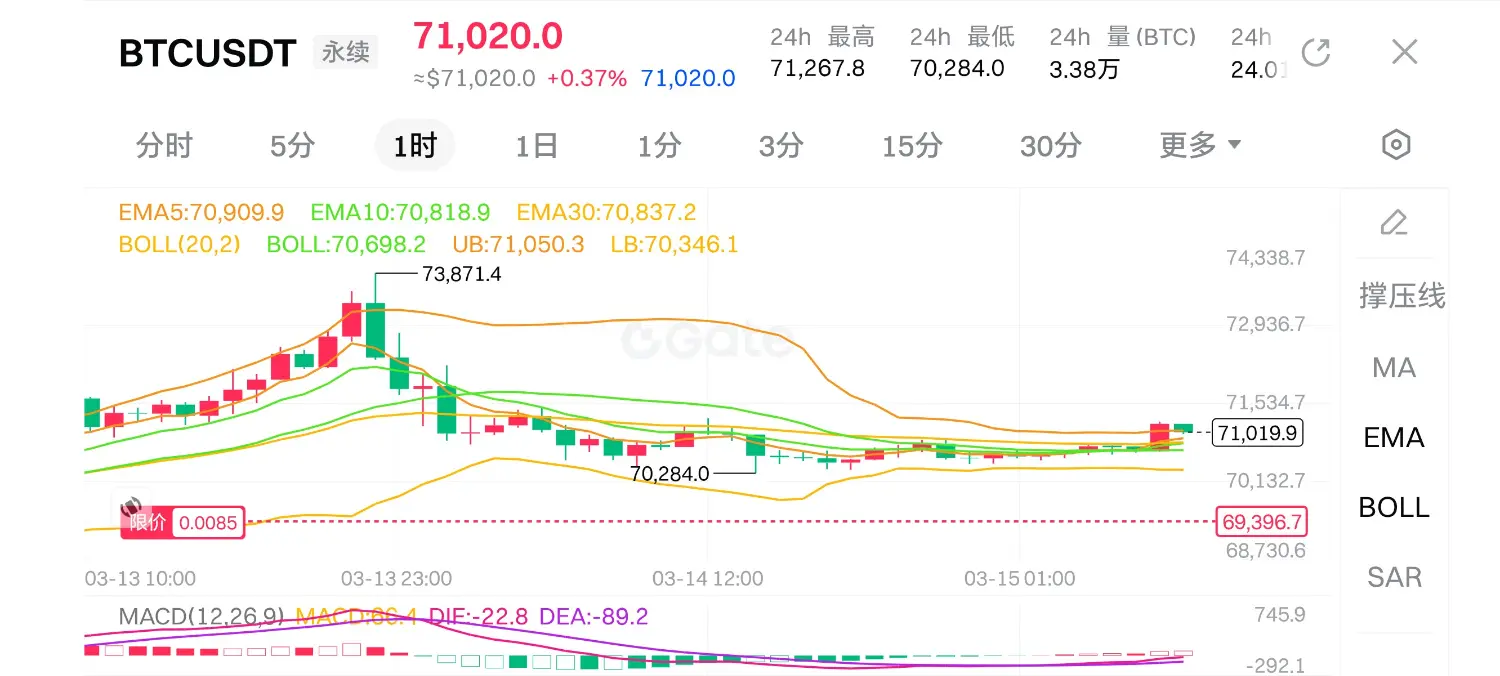
- 價格與指標:當前價格 $71,020,位於 EMA5($70,910) 上方、EMA10/30($70,818.9/70,837.2) 上方,短期偏強;布林帶中軌 $70,698.2,上軌 $71,050.3,下軌 $70,346.1,價格貼近上軌,同樣接近短期阻力。
- MACD:DIF(-22.8)、DEA(-89.2),MACD柱為正且在收窄,空頭動能減弱,多頭嘗試修復,但整體仍在
查看原文1. ETHUSDT 走勢分析
- 價格與指標:當前價格 $2,092.52,位於 EMA5($2,088.36) 上方、EMA10/30($2,084.39/2,084.90) 上方,短期偏強;布林帶(BOLL)中軌 $2,078.11,上軌 $2,094.25,下軌 $2,061.97,價格貼近上軌,短期有上衝動能但接近阻力。
- MACD:DIF(-0.81)、DEA(-3.80),MACD柱為正且在收窄,空頭動能減弱,多頭開始蓄力,但尚未形成金叉,趨勢反轉信號較弱。
- 關鍵價位:
- 阻力:$2,094.25(布林上軌)、$2,100、$2,114.72(EMA30 前高)
- 支撐:$2,088(EMA5)、$2,084(EMA10/30)、$2,061.97(布林下軌)
2. BTCUSDT 走勢分析
- 價格與指標:當前價格 $71,020,位於 EMA5($70,910) 上方、EMA10/30($70,818.9/70,837.2) 上方,短期偏強;布林帶中軌 $70,698.2,上軌 $71,050.3,下軌 $70,346.1,價格貼近上軌,同樣接近短期阻力。
- MACD:DIF(-22.8)、DEA(-89.2),MACD柱為正且在收窄,空頭動能減弱,多頭嘗試修復,但整體仍在
【當前用戶分享了他的交易卡片,若想瞭解更多優質交易資訊,請到 App 版查看】
市值:$2471.32持有人數:2
0.06%
- 讚賞
- 3
- 1
- 轉發
- 分享
幻林 :
:
吉祥如意 🧧XM
XM
創建人@每日50u问题很大嘛
認購進度
0.00%
市值:
$0
更多代幣


🌹guan和平 轮家人们给U‼️不知不觉订阅已第4个年头,订阅人数已超450人,6.5gt半价优惠开三天‼️订阅的朋友谁也不傻,不赚谁定你😄苹果可点击👇也可复制到网页端订阅:
https://www.gate.com/zh/profile/秋雨何时了
————————————————
🌹 上周63000/1840+1925/65300多2200/74600吃肉
🌹 反手2195/74000空1910/65500再吃肉
————————————————
🌹本周1915/65900多2205/73900再吃肉
🌹反手2180/73000空现2060/70300吃肉
————————————————
🌹4月7号布局现货全部完美进场吃肉📈
1、20gt最低19.9拉涨24.2涨幅21%
2、1.9xrp最低1.61拉涨2.3涨幅21%
3、110sol最低95拉涨155涨幅41%
4、0.13doge最低0.129拉涨0.185涨幅43%
5、4.7uni最低4.55拉涨6.1涨幅30%
6、12.5附近etc最低12.6拉涨17.5涨幅39%
7、1250people最低975拉涨1740涨幅40%
8、14附近avax最低14.6拉涨23涨幅57.5%
9、510ada最低510拉涨725涨幅42%
10、2sui最低1.7拉涨4.1涨幅105%
11、120aave

- 讚賞
- 11
- 11
- 轉發
- 分享
跟上时代节奏 :
:
新年快樂 🧨查看更多


追踪币圈实时热点、把握最佳成交机会,今天是2026年3月15日星期日,我是王毅博!各位币友早上好☀ 铁粉打卡👍 点赞发大财🍗🍗🌹🌹
==================================
💎
💎
==================================
昨日美股、贵金属、原油均休市,加密市场整体维持窄幅震荡。周末国际层面主要受中东地缘冲突升级、美联储降息预期再度推迟影响,美元走强、风险偏好回落,叠加加密本身短线波动,市场情绪偏谨慎。下周加密行情将以 **FOMC 会议(3 月 18 日)** 为核心拐点,在此之前大概率延续宽幅震荡,议息释放鹰派信号则易承压测试支撑,偏鸽则有望反弹,同时需持续跟踪地缘局势与 BTC ETF 资金流向,关注毅博将持续追踪美联储政策落地、机构资金流向、链上数据变化等核心信号,实时更新布局策略与标的动态。
==================================
💎
💎
==================================
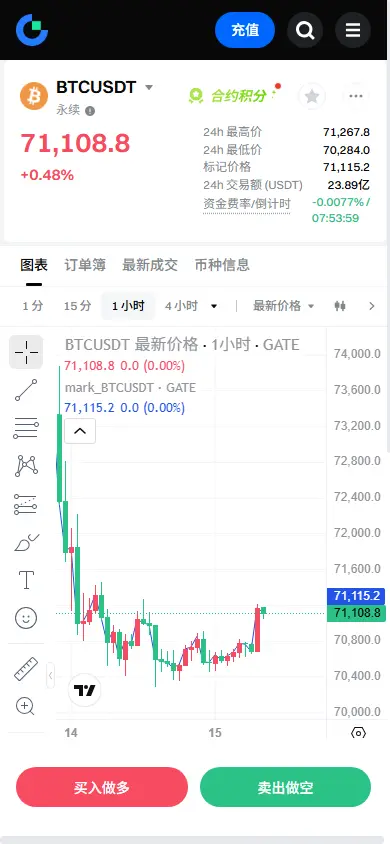
比特币自前期高点 73800 一线承压回落,价格进入阶段性回调结构。昨日早间下探至 70470 获得短时支撑,午盘出现技术性反抽,反弹至 71300 区域后承压回落,午后二次回踩测试低点 70300,确认短期支撑区间有效性,随后进入低位窄幅震荡整理,多空博弈趋于谨慎
==================================
💎
💎
==================================
昨日美股、贵金属、原油均休市,加密市场整体维持窄幅震荡。周末国际层面主要受中东地缘冲突升级、美联储降息预期再度推迟影响,美元走强、风险偏好回落,叠加加密本身短线波动,市场情绪偏谨慎。下周加密行情将以 **FOMC 会议(3 月 18 日)** 为核心拐点,在此之前大概率延续宽幅震荡,议息释放鹰派信号则易承压测试支撑,偏鸽则有望反弹,同时需持续跟踪地缘局势与 BTC ETF 资金流向,关注毅博将持续追踪美联储政策落地、机构资金流向、链上数据变化等核心信号,实时更新布局策略与标的动态。
==================================
💎
💎
==================================
比特币自前期高点 73800 一线承压回落,价格进入阶段性回调结构。昨日早间下探至 70470 获得短时支撑,午盘出现技术性反抽,反弹至 71300 区域后承压回落,午后二次回踩测试低点 70300,确认短期支撑区间有效性,随后进入低位窄幅震荡整理,多空博弈趋于谨慎


- 讚賞
- 3
- 6
- 轉發
- 分享
招财金宝133 :
:
2026衝衝衝 👊2026衝衝衝 👊2026衝衝衝 👊2026衝衝衝 👊查看更多
【$SOL 信號】做空 | 反彈衰竭,空頭主導格局確立
$SOL 1H級別反彈在關鍵阻力位戛然而止,價格被死死壓制在EMA20下方,多頭反攻無力。4H級別更是連續收陰,整體結構呈現震盪下行態勢。
🎯方向:做空
⚡入場/掛單:當前價88.03附近即可入場,或等待反彈至88.10-88.20區域加倉。
🛑止損:88.66(前高上方)
🚀目標1:86.40(前低支撐)
🚀目標2:85.00(4H級別強支撐區)
🛡️交易管理:
- 執行策略:價格觸及第一目標後,將剩餘倉位止損下移至入場價附近,鎖定利潤,讓剩餘倉位去博取更大空間。若反彈無力,可考慮在目標1附近部分止盈。
深度邏輯:盤口數據揭示了真相。雖然最新一根1小時K線買盤比例高達0.75,但價格紋絲不動,典型的「買盤虛胖」。更關鍵的是,賣盤深度在88.10上方急劇增厚,形成一道堅固的拋壓牆。這種「買盤熱鬧,價格不動」的現象,往往是主力在掩護出貨或誘多,真正的下跌動能正在積蓄。市場邏輯提示的「反彈無力,空頭再次佔據主導」與數據完美契合。
查看實時行情 👇 $SOL
---
關注我:獲取更多加密市場實時分析與洞察! $BTC $ETH $SOL
#Gate广场AI测评官 #Gate2月衍生品市场份额创新高 #加密市场上涨
查看原文$SOL 1H級別反彈在關鍵阻力位戛然而止,價格被死死壓制在EMA20下方,多頭反攻無力。4H級別更是連續收陰,整體結構呈現震盪下行態勢。
🎯方向:做空
⚡入場/掛單:當前價88.03附近即可入場,或等待反彈至88.10-88.20區域加倉。
🛑止損:88.66(前高上方)
🚀目標1:86.40(前低支撐)
🚀目標2:85.00(4H級別強支撐區)
🛡️交易管理:
- 執行策略:價格觸及第一目標後,將剩餘倉位止損下移至入場價附近,鎖定利潤,讓剩餘倉位去博取更大空間。若反彈無力,可考慮在目標1附近部分止盈。
深度邏輯:盤口數據揭示了真相。雖然最新一根1小時K線買盤比例高達0.75,但價格紋絲不動,典型的「買盤虛胖」。更關鍵的是,賣盤深度在88.10上方急劇增厚,形成一道堅固的拋壓牆。這種「買盤熱鬧,價格不動」的現象,往往是主力在掩護出貨或誘多,真正的下跌動能正在積蓄。市場邏輯提示的「反彈無力,空頭再次佔據主導」與數據完美契合。
查看實時行情 👇 $SOL
---
關注我:獲取更多加密市場實時分析與洞察! $BTC $ETH $SOL
#Gate广场AI测评官 #Gate2月衍生品市场份额创新高 #加密市场上涨

- 讚賞
- 2
- 留言
- 轉發
- 分享

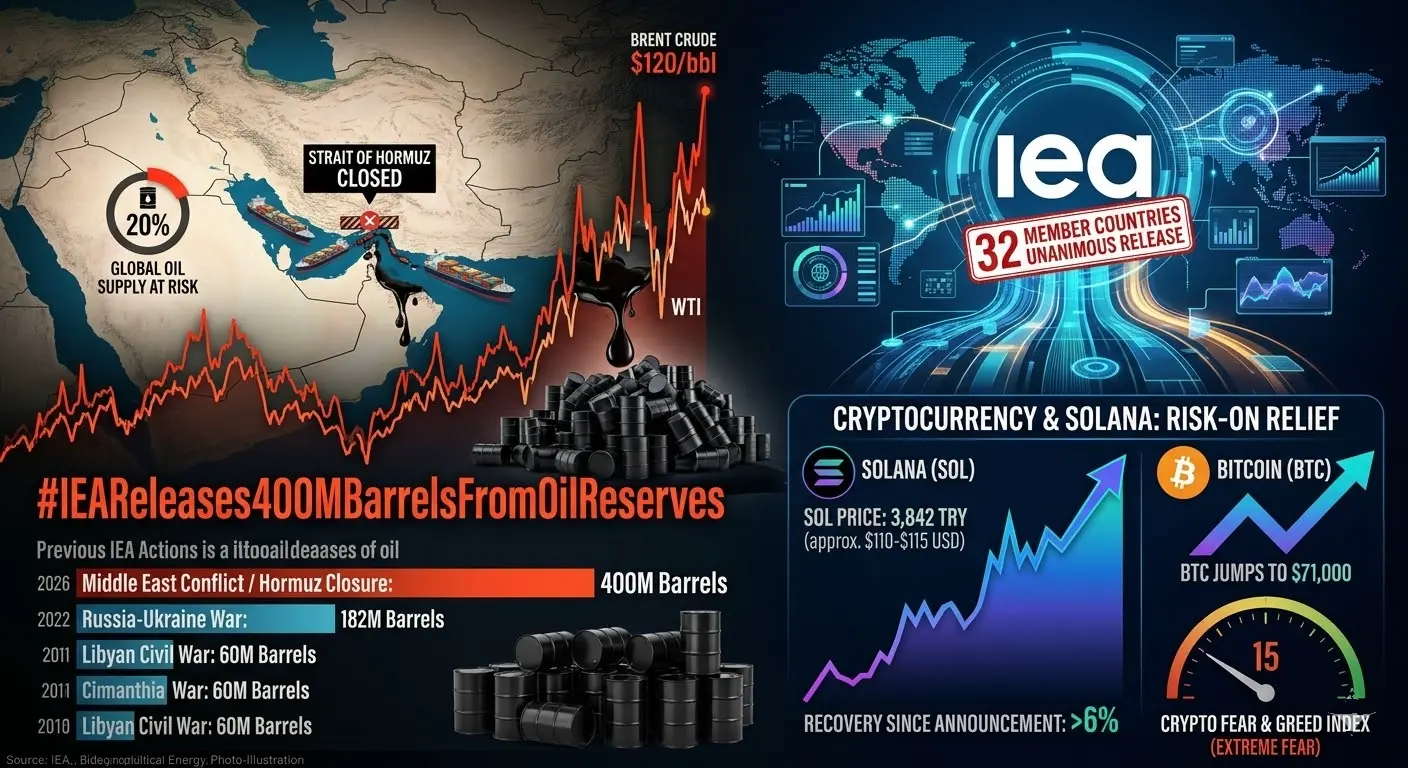
#IEAReleases400MBarrelsFromOilReserves
2026年3月11日,國際能源署(IEA)宣布其32個成員國一致同意從應急儲備中釋放4億桶石油。這是該機構歷史上最大規模的協調釋放,是2022年釋放的1.82億桶的兩倍多。
此次干預是對中東衝突造成的供應衝擊的直接應對,該衝突有效地關閉了霍爾木茲海峽,該海峽是全球約20%石油供應的運輸點。
釋放的關鍵細節
釋放的目的是充當"橋樑",在解決運輸中斷的同時穩定市場。
主要貢獻國:* 美國:1.72億桶((來自戰略石油儲備))。
日本:8,000萬桶。
韓國:2,250萬桶。
德國:1,950萬桶。
英國:1,350萬桶。
成員國在公共應急儲備中持有約12億桶,工業儲備中還有6億桶。此次釋放約佔政府儲備總量的三分之一。
市場背景:在2月28日衝突開始後,油價上升至每桶約$120 。伊朗警告稱,如果封鎖繼續,油價可能達到每桶$200 。
與以往國際能源署行動的比較
這是國際能源署自1974年成立以來第六次執行集體行動。
2026年中東衝突/霍爾木茲海峽關閉 4億桶
2022年俄烏戰爭 1.82億桶
2011年利比亞內戰 6,000萬桶
2005年卡特里娜颶風 6,000萬桶
1991年海灣戰爭 1,700萬桶
當前狀況
成員國正按照適合其國家後勤的時間框架提供這些儲備。例如,美國預計其1.72億桶的貢獻將在約1
查看原文2026年3月11日,國際能源署(IEA)宣布其32個成員國一致同意從應急儲備中釋放4億桶石油。這是該機構歷史上最大規模的協調釋放,是2022年釋放的1.82億桶的兩倍多。
此次干預是對中東衝突造成的供應衝擊的直接應對,該衝突有效地關閉了霍爾木茲海峽,該海峽是全球約20%石油供應的運輸點。
釋放的關鍵細節
釋放的目的是充當"橋樑",在解決運輸中斷的同時穩定市場。
主要貢獻國:* 美國:1.72億桶((來自戰略石油儲備))。
日本:8,000萬桶。
韓國:2,250萬桶。
德國:1,950萬桶。
英國:1,350萬桶。
成員國在公共應急儲備中持有約12億桶,工業儲備中還有6億桶。此次釋放約佔政府儲備總量的三分之一。
市場背景:在2月28日衝突開始後,油價上升至每桶約$120 。伊朗警告稱,如果封鎖繼續,油價可能達到每桶$200 。
與以往國際能源署行動的比較
這是國際能源署自1974年成立以來第六次執行集體行動。
2026年中東衝突/霍爾木茲海峽關閉 4億桶
2022年俄烏戰爭 1.82億桶
2011年利比亞內戰 6,000萬桶
2005年卡特里娜颶風 6,000萬桶
1991年海灣戰爭 1,700萬桶
當前狀況
成員國正按照適合其國家後勤的時間框架提供這些儲備。例如,美國預計其1.72億桶的貢獻將在約1

- 讚賞
- 7
- 4
- 轉發
- 分享
楚老魔:
堅定HODL💎查看更多
【$BTC Signal】Long + 1H Breakout Retest Confirmation
$BTC The 1H level completed a breakout above the key resistance zone, with price precisely retesting EMA20 before surging higher with strong buying support.
🎯 Direction: Long
⚡ Entry/Pending Order: 70681.50 - 70826.55
🛑 Stop Loss: 70826.55
🚀 Target 1: 69575.26
🚀 Target 2: 69128.37
🛡 ️Trade Management:
- Execution Strategy: Once price reaches the first target, it's recommended to close half the position and move the stop loss of the remaining position closer to the entry price, locking in profits while preserving the opportunity to captu
查看原文$BTC The 1H level completed a breakout above the key resistance zone, with price precisely retesting EMA20 before surging higher with strong buying support.
🎯 Direction: Long
⚡ Entry/Pending Order: 70681.50 - 70826.55
🛑 Stop Loss: 70826.55
🚀 Target 1: 69575.26
🚀 Target 2: 69128.37
🛡 ️Trade Management:
- Execution Strategy: Once price reaches the first target, it's recommended to close half the position and move the stop loss of the remaining position closer to the entry price, locking in profits while preserving the opportunity to captu
- 讚賞
- 2
- 1
- 轉發
- 分享
ybaser:
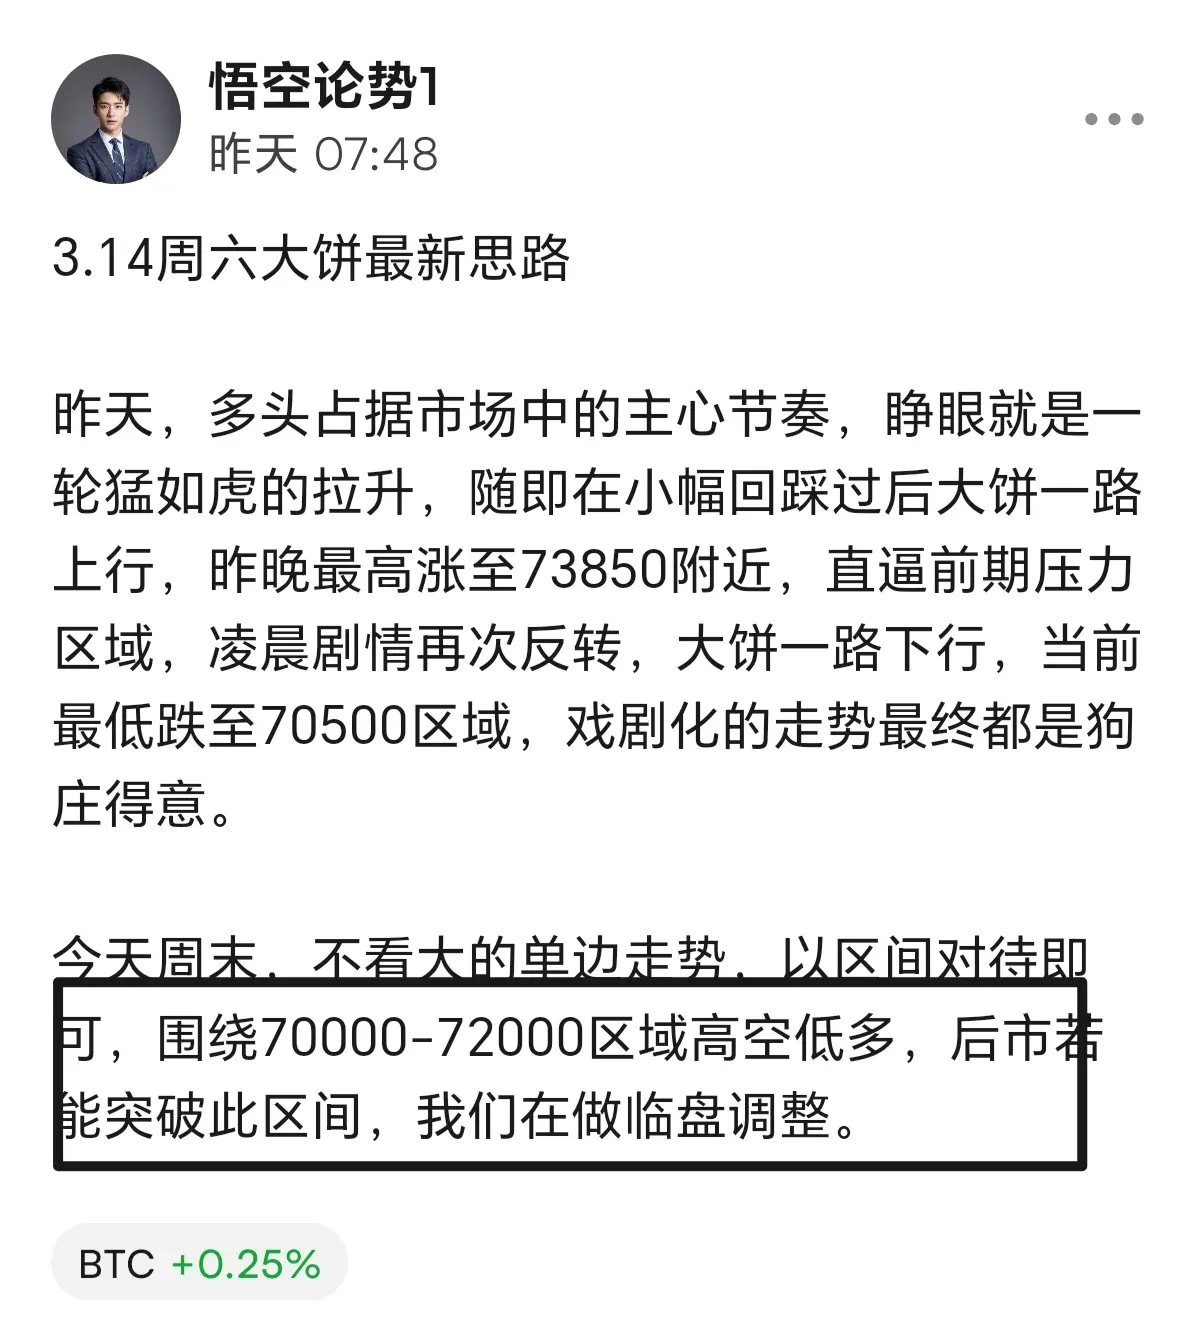
感謝您的資訊與分享💜🌹3.15 Sunday Bitcoin Latest Thoughts
The weekend market remains unchanged as usual, without much volatility. Yesterday, I provided a high short and low long strategy in the 70000-72000 range for Bitcoin, and the price movement basically matched expectations. There is certain space in the short term, and those who grasped it well can enjoy a nice profit over the weekend.
For today, the short term is in an oscillation repair phase, with low probability of a one-sided move, so today we should continue to treat it as a range-bound market. As long as the 70000-72000 range doesn't break, we maintain
BTC0.33%
- 讚賞
- 3
- 留言
- 轉發
- 分享
TKC
ToKenCoin
創建人@究极蓝星人
上市進度
0.00%
市值:
$2458.62
更多代幣
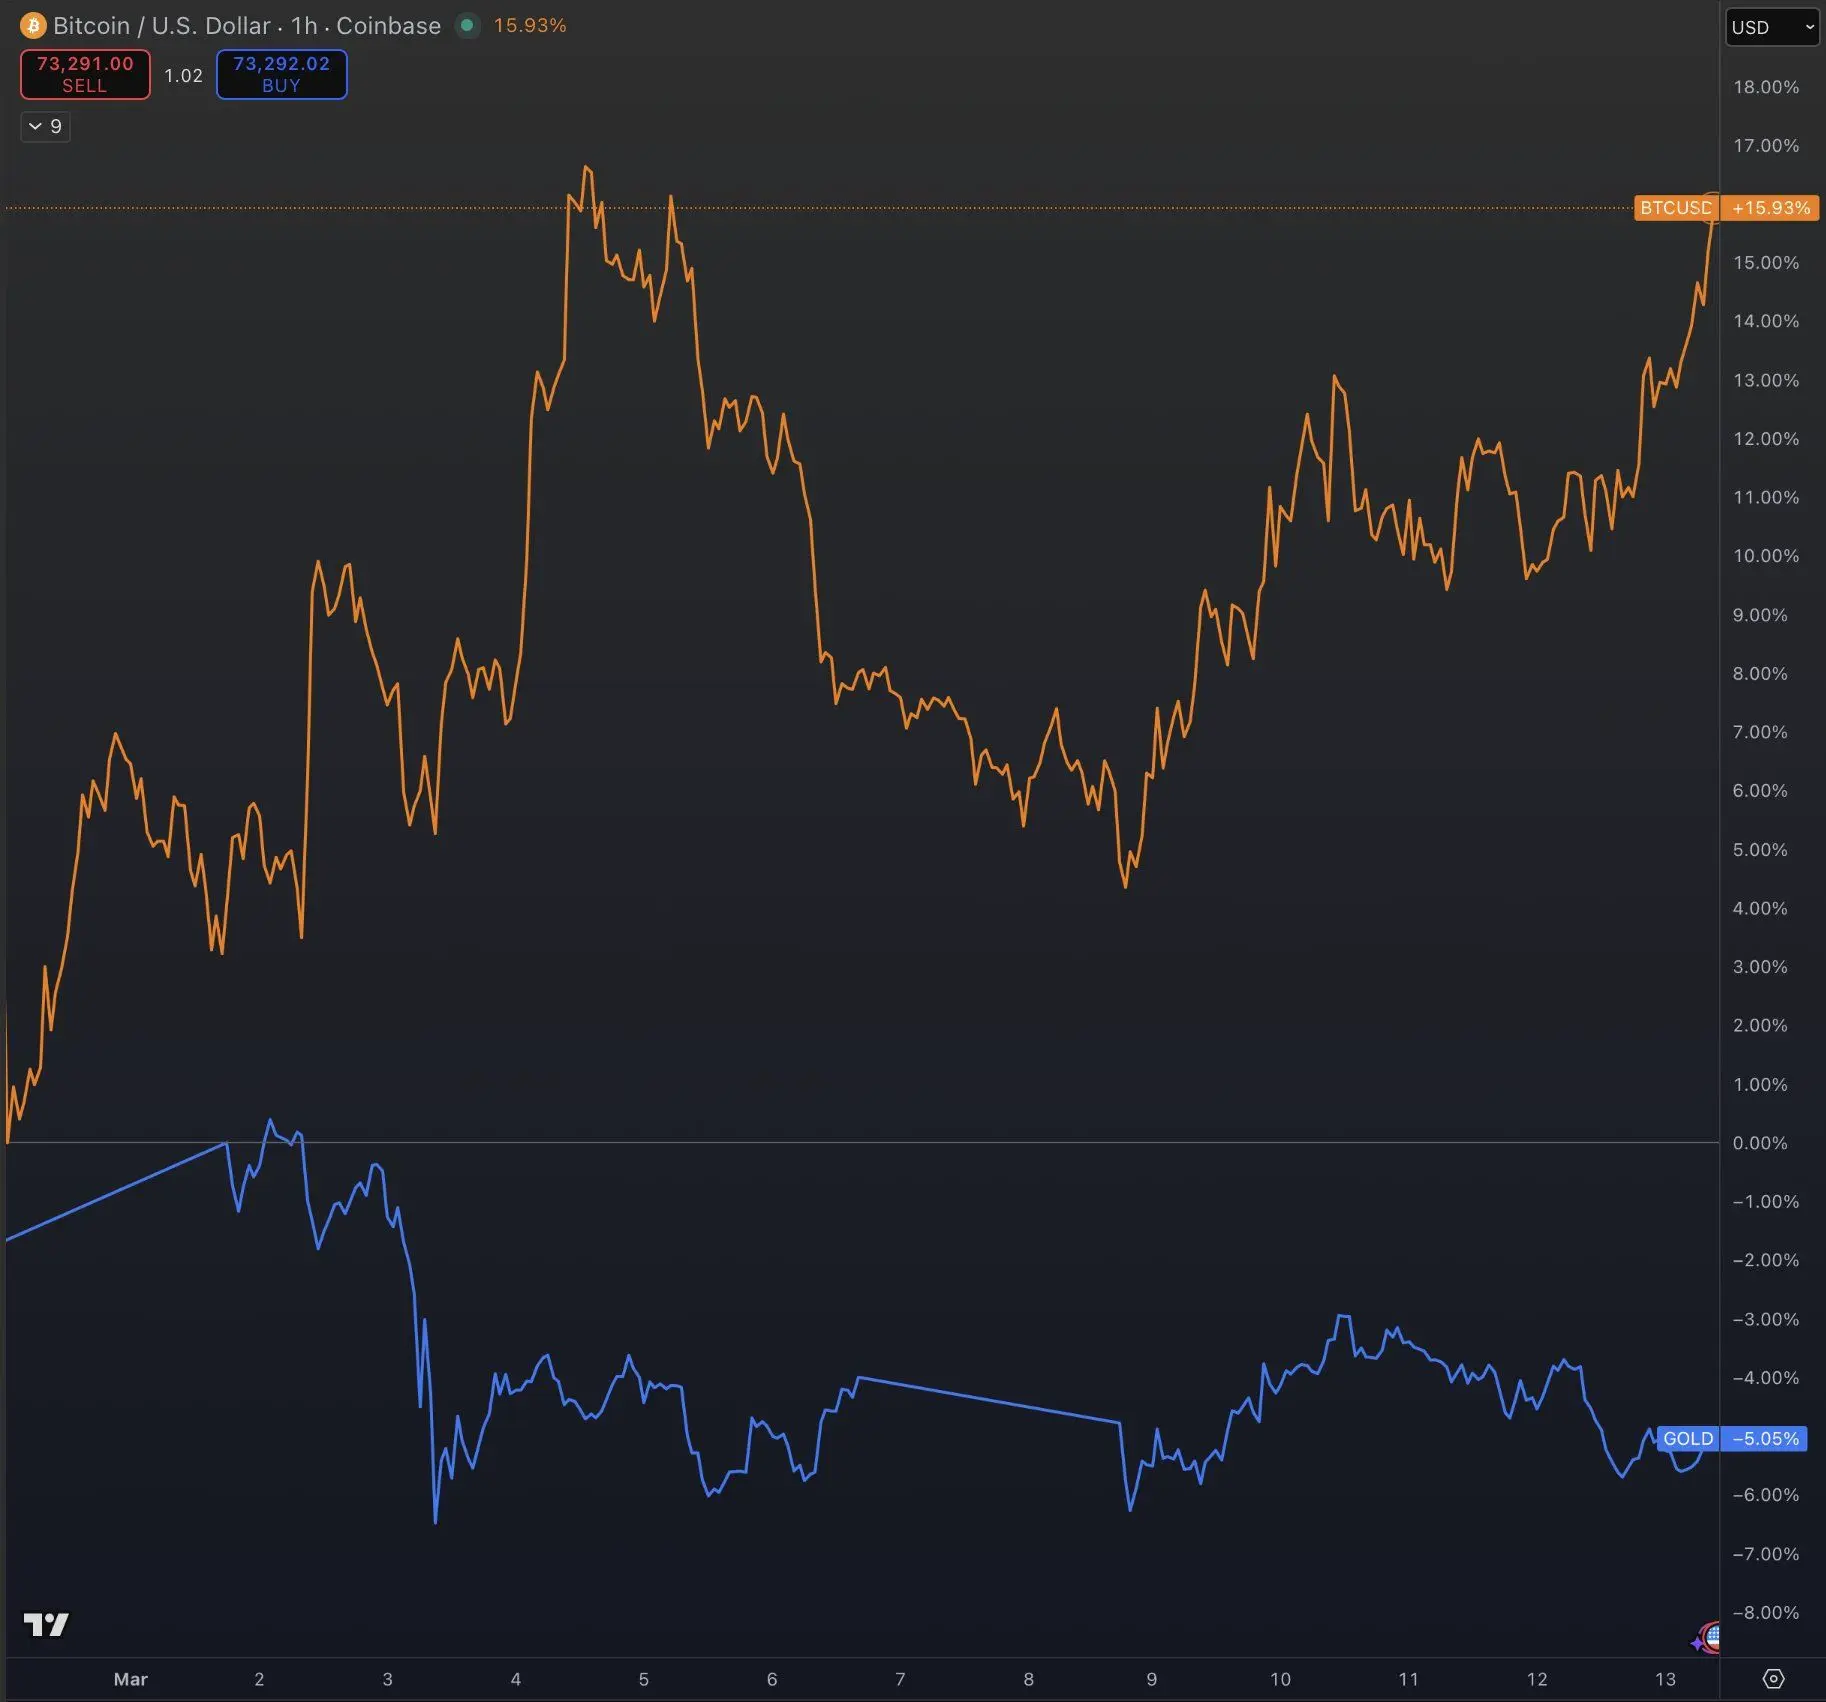
自從🇮🇷🇺🇸美國與伊朗之間的衝突爆發以來:
- 比特幣:+10%。
- 黃金:-5%。
$BTC $XAUUSD $XAUUSD100
#BitcoinSurgesAbove$70K #IranClaimsDowningUSRefuelingJet #TrendResearchSuspectedShorting27KETH
查看原文- 比特幣:+10%。
- 黃金:-5%。
$BTC $XAUUSD $XAUUSD100
#BitcoinSurgesAbove$70K #IranClaimsDowningUSRefuelingJet #TrendResearchSuspectedShorting27KETH
市值:$4.96萬持有人數:77443
100.00%
- 讚賞
- 2
- 留言
- 轉發
- 分享


🤔 油價會達到 $150 嗎?
✨由於美國-伊朗緊張局勢和荷美茲海峽的安全風險,全球能源市場再次進入高波動性時期。由於全球五分之一的石油貿易通過這條狹窄的海峽,該地區任何軍事緊張局勢都會直接影響油價。
🧐短期情景:$90-110 區間
根據專家表示,如果海峽未完全關閉且油輪運輸繼續得到國際海軍保護,油價可能會保持在 $90-110 區間。在這種情況下,市場將增加地緣政治風險溢價,但由於供應未完全切斷,價格可以保持在控制範圍內。
🧐中等風險情景:$120-150
如果伊朗油輪襲擊增加或出現臨時海軍封鎖,全球石油供應可能會出現嚴重中斷。在這種情況下,價格有可能上升到 $120-150 水平。特別是亞洲和歐洲能源市場將是受此情景影響最大的地區。
🧐最壞情景:超過 $150
的能源衝擊
如果荷美茲海峽完全關閉或區域戰爭擴大,油價可能會升至 $150 以上,演變成全球能源危機。🔎此情景可能會引發一系列經濟效應的連鎖反應,例如:
全球通脹快速上升
全球增長放緩
金融市場急劇波動。
總結 ✍️
能源市場的命運在很大程度上取決於荷美茲海峽的安全局勢。在目前條件下,油價上升到 $150 水平被認為是低風險但真實存在的風險。市場的決定性因素將是軍事緊張局勢是否從區域衝突升級為全球能源危機。
查看原文✨由於美國-伊朗緊張局勢和荷美茲海峽的安全風險,全球能源市場再次進入高波動性時期。由於全球五分之一的石油貿易通過這條狹窄的海峽,該地區任何軍事緊張局勢都會直接影響油價。
🧐短期情景:$90-110 區間
根據專家表示,如果海峽未完全關閉且油輪運輸繼續得到國際海軍保護,油價可能會保持在 $90-110 區間。在這種情況下,市場將增加地緣政治風險溢價,但由於供應未完全切斷,價格可以保持在控制範圍內。
🧐中等風險情景:$120-150
如果伊朗油輪襲擊增加或出現臨時海軍封鎖,全球石油供應可能會出現嚴重中斷。在這種情況下,價格有可能上升到 $120-150 水平。特別是亞洲和歐洲能源市場將是受此情景影響最大的地區。
🧐最壞情景:超過 $150
的能源衝擊
如果荷美茲海峽完全關閉或區域戰爭擴大,油價可能會升至 $150 以上,演變成全球能源危機。🔎此情景可能會引發一系列經濟效應的連鎖反應,例如:
全球通脹快速上升
全球增長放緩
金融市場急劇波動。
總結 ✍️
能源市場的命運在很大程度上取決於荷美茲海峽的安全局勢。在目前條件下,油價上升到 $150 水平被認為是低風險但真實存在的風險。市場的決定性因素將是軍事緊張局勢是否從區域衝突升級為全球能源危機。


- 讚賞
- 13
- 10
- 轉發
- 分享
ybaser:
飛向月球 🌕查看更多
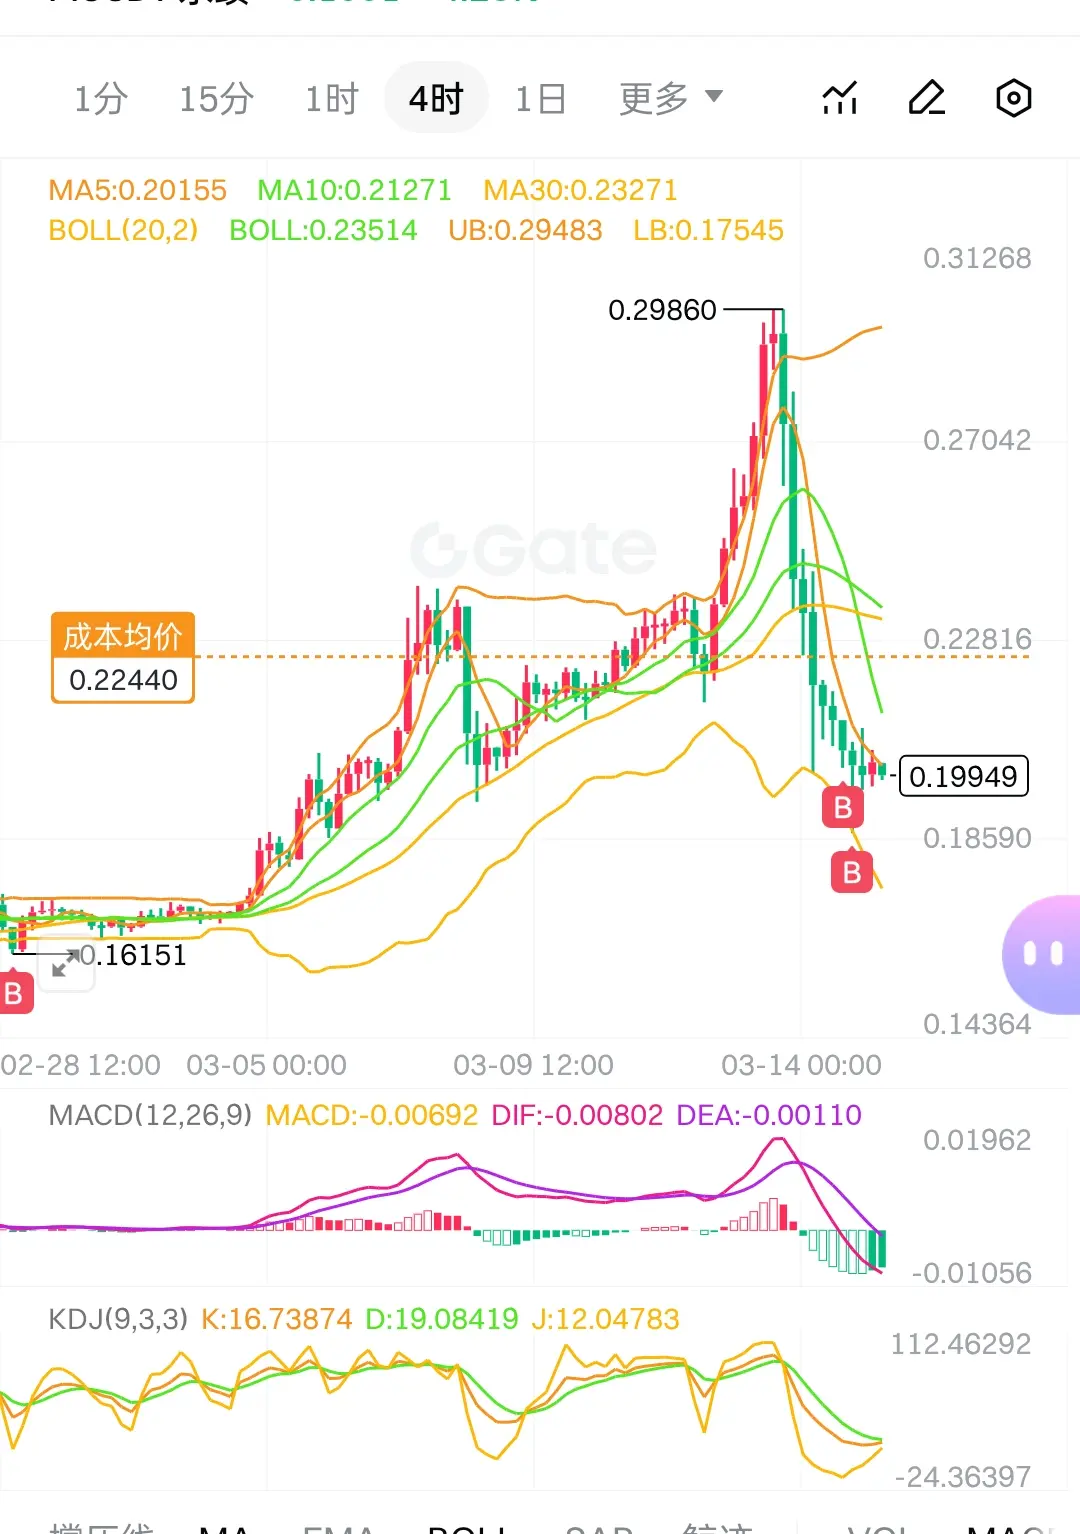
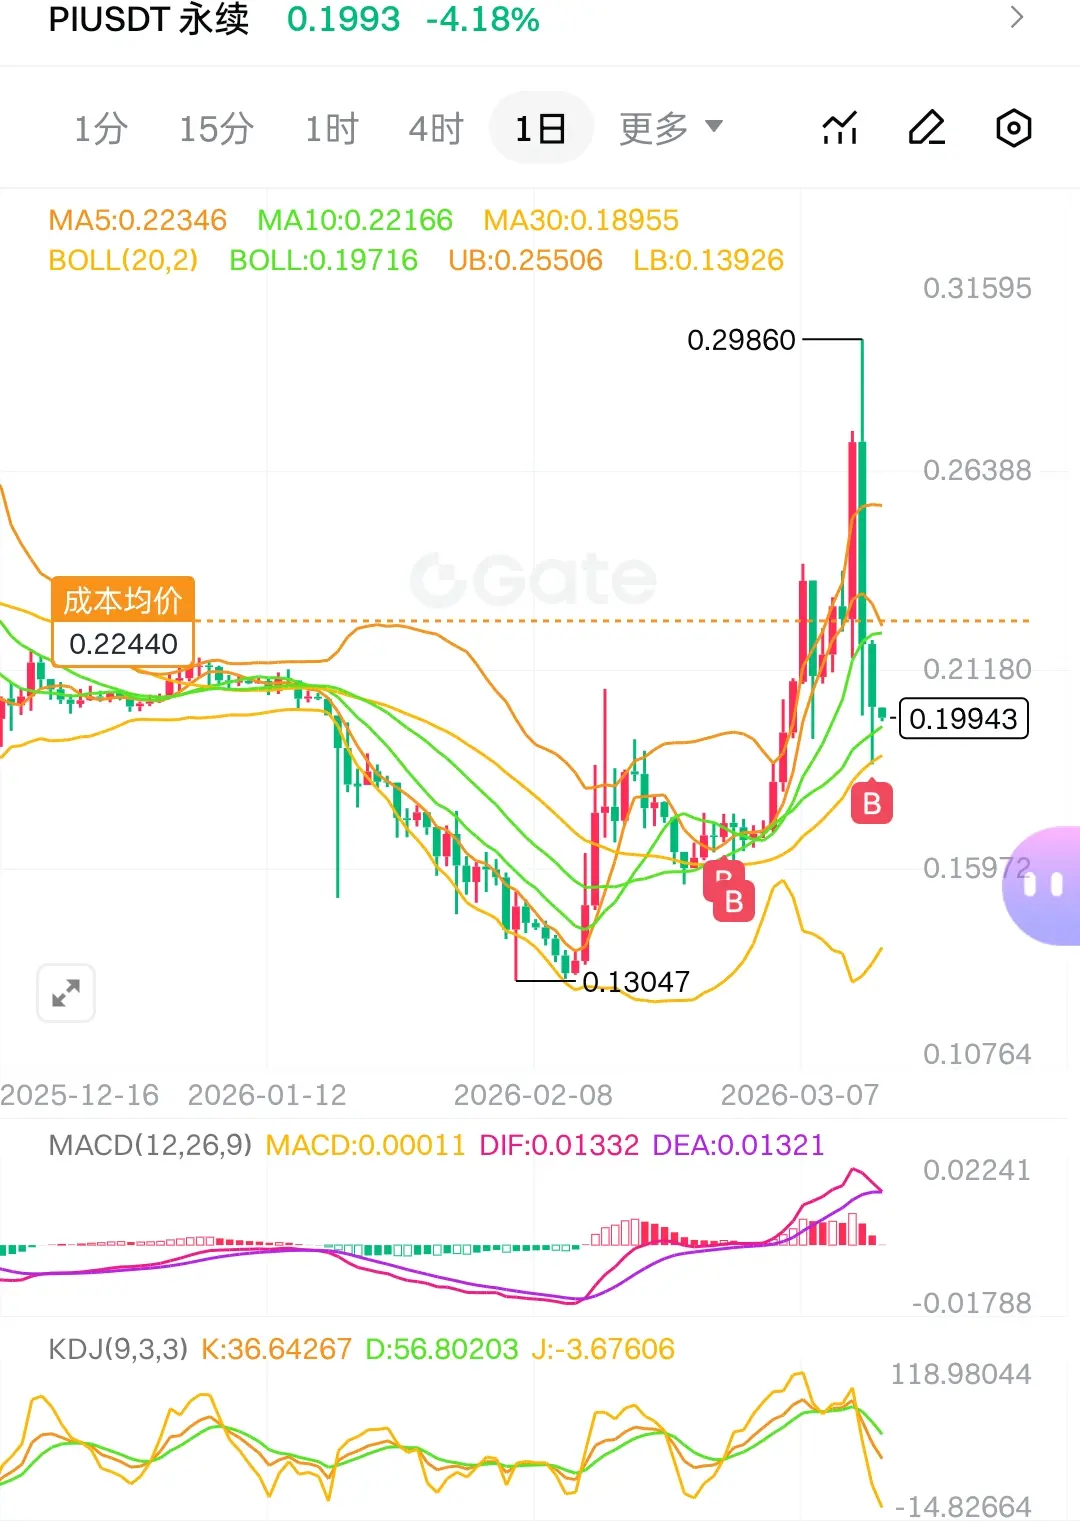
$PI Waiting: Be patient, the adjustment will take at least 2 weeks. The daily line adjustment will end when a 5% or more medium-sized yang line appears. Currently the price is around 0.197 USD at the daily midline, and the 4-hour chart shows weakening downward momentum but hasn't fully adjusted yet. When the last large yang line appeared on the daily chart, I mentioned the 5-day line was already diverging, and now the 10-day line also shows divergence. Angle-wise it should be at the midline position. So this rapid decline is for trading futures contracts, don't worry about spot, keep buying a
PI-7.31%
- 讚賞
- 9
- 6
- 轉發
- 分享
GateUser-4ae57581 :
:
用技術指標來分析沒用的查看更多
TRON 加入萬事達卡加密貨幣合作夥伴計劃 🚀
TRON 正式加入萬事達卡加密貨幣合作夥伴計劃,這是加密生態系統的一個值得注意的進展。
當 TRON 網絡目前每天處理約 1928374656574839201 筆交易量時,這一點更加值得關注。
幾個值得注意的要點:
• TRON 繼續確認其作為市場上交易量最大的區塊鏈之一的角色
• 參與萬事達卡計劃為加密貨幣與傳統支付系統的連接開啟了機會
• 穩定幣和鏈上支付可能更接近實際應用
加密貨幣不再只是針對科技社群中的小群體,而正在成為全球金融系統的一部分。
@justinsuntron $22B ad #TRONGlobalFriends @TronDao_VIE @trondao #PaidPartnership #合作夥伴關係
TRX1.48%

- 讚賞
- 按讚
- 留言
- 轉發
- 分享
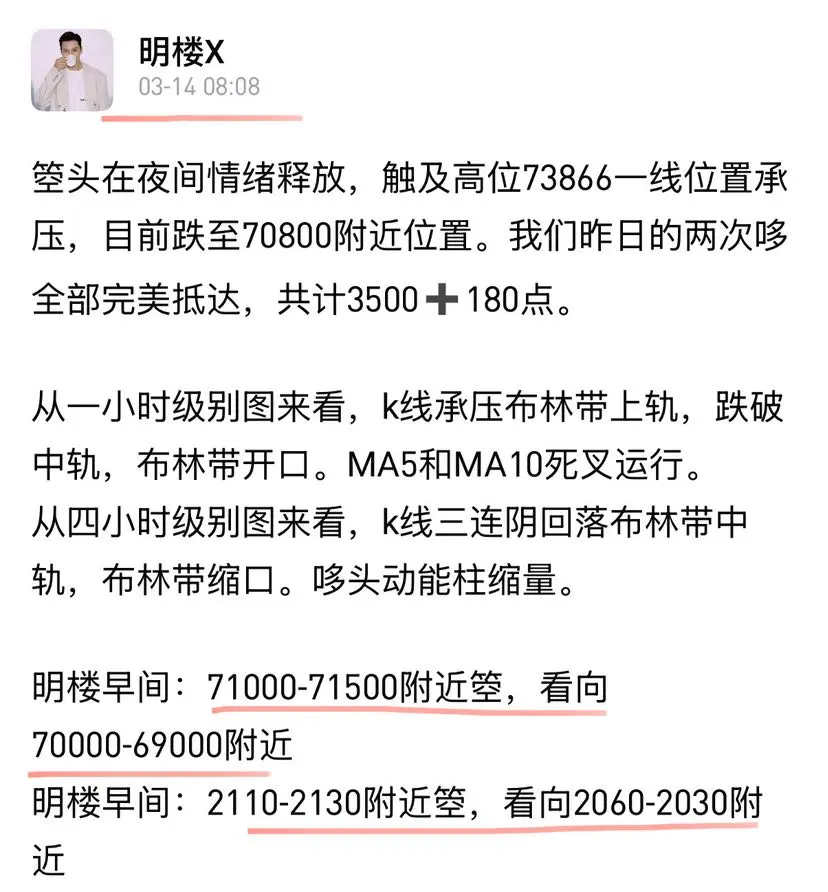
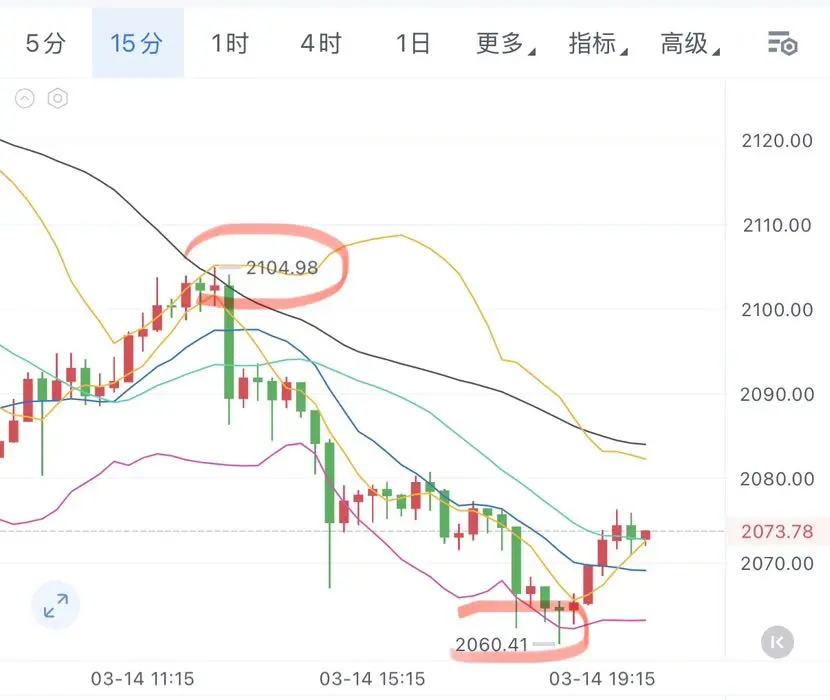
The price surged early in the morning, pulling up to the 71000 level. Our short from yesterday perfectly reached its target, closing at 1000➕40 points.
From the 1-hour level chart, the K-line stabilized at the middle band of the Bollinger Bands and broke through the upper band, with the Bollinger Bands widening. MA5 and MA10 moving averages show a golden cross formation running upward.
From the 4-hour level chart, the K-line alternates between bullish and bearish bars at the middle band of the Bollinger Bands, with the Bollinger Bands narrowing. The momentum histogram of the short position has
查看原文From the 1-hour level chart, the K-line stabilized at the middle band of the Bollinger Bands and broke through the upper band, with the Bollinger Bands widening. MA5 and MA10 moving averages show a golden cross formation running upward.
From the 4-hour level chart, the K-line alternates between bullish and bearish bars at the middle band of the Bollinger Bands, with the Bollinger Bands narrowing. The momentum histogram of the short position has

- 讚賞
- 按讚
- 1
- 轉發
- 分享
明楼X:
➕ q
q
38591
38011

- 讚賞
- 2
- 留言
- 轉發
- 分享
週日 早間 婧怡操作思路分析
從4小時圖來看,週五洗盤後仍守70000,屬上升通道正常回調,多頭趨勢完好,下跌動能衰竭,將沖擊74000前高。
操作建議
BTC 707-700區間多,目標關注715-732,長線740
ETH 2070-2040區間多,目標關注2100-2150,長線2200
以上僅個人觀點,僅供參考
#Gate广场AI测评官
查看原文從4小時圖來看,週五洗盤後仍守70000,屬上升通道正常回調,多頭趨勢完好,下跌動能衰竭,將沖擊74000前高。
操作建議
BTC 707-700區間多,目標關注715-732,長線740
ETH 2070-2040區間多,目標關注2100-2150,長線2200
以上僅個人觀點,僅供參考
#Gate广场AI测评官


- 讚賞
- 1
- 留言
- 轉發
- 分享
加載更多
加入 4000萬 人匯聚的頭部社群
⚡️ 與 4000萬 人一起參與加密貨幣熱潮討論
💬 與喜愛的頭部創作者互動
👍 查看感興趣的內容
熱門話題
查看更多19.74萬 熱度
9.7萬 熱度
44.54萬 熱度
4984.66萬 熱度
174.66萬 熱度
最新消息
查看更多置頂
Gate Booster 第 4 期:發帖瓜分 1,500 $USDT
🔹 發布 TradFi 黃金福袋原創內容,可得 15 $USDT,名額有限先到先得
🔹 本期支持 X、YouTube 發布原創內容
🔹 無需複雜操作,流程清晰透明
🔹 流程:申請成為 Booster → 領取任務 → 發布原創內容 → 回鏈登記 → 等待審核及發獎
📅 任務截止時間:03月20日16:00(UTC+8)
立即領取任務:https://www.gate.com/booster/10028?pid=allPort&ch=KTag1BmC
更多詳情:https://www.gate.com/announcements/article/50203🤖 尋找 Gate 廣場 AI 評測官!$50,000 懸賞令發布!
發帖聊 AI,獎金拿到手軟!新人首帖獎勵翻倍,單帖最高 200U!
📝 立即報名:https://www.gate.com/questionnaire/7477
1️⃣ 發帖得紅包,單帖最高 100U!
2️⃣ Top 體驗分享官:帶 #Gate广场AI测评官 聊技巧,贏國米球衣!
3️⃣ 收益率 PK 王:曬 AI 收益截圖,贏 Gate 定制運動套裝!
4️⃣ 深度好文額外加碼 30U 每篇張榜公布!
💬 來 Gate 廣場,把握行業新趨勢:https://www.gate.com/post
時間:3/12 18:00 – 3/27 24:00 (UTC+8)
詳情:https://www.gate.com/announcements/article/50206Gate 廣場|3/12 今日熱議: #原油价格上涨
🎁 帶話題或 BTC 幣對發帖,抽 5 位錦鯉送出 $2,500 仓位體驗券!
中東局勢突變:阿曼原油出口碼頭全面疏散,伊拉克石油港口停運,兩艘油輪在海灣遇襲,原油供應警報拉滿!國際能源署釋放4億桶儲備,多空對決進入白熱化。
💬 本期熱議
1️⃣ 外交局勢:伊朗開出停戰條件,美伊能否達成共識?
2️⃣ 石油博弈:你看好誰?預測下一步油價走勢。
3️⃣ 加密走勢:油價資金流向將如何影響加密市場?分享你的分析。
立刻分享觀點 👉 https://www.gate.com/post
Gate TradFi,一鍵捕捉原油機遇 👉 https://www.gate.com/tradfi
📅 3/12 15:00 - 3/14 18:00 (UTC+8)Gate 廣場內容挖礦獎勵繼續升級!無論您是創作者還是用戶,挖礦新人還是頭部作者都能贏取好禮獲得大獎。現在就進入廣場探索吧!
創作者享受最高60%創作返佣
創作者獎勵加碼1500USDT:更多新人作者能瓜分獎池!
觀眾點擊交易組件交易贏大禮!最高50GT等新春壕禮等你拿!
詳情:https://www.gate.com/announcements/article/49802