Trade
Basic
Futures
Futures
Hundreds of contracts settled in USDT or BTC
TradFi
Gold
Trade global traditional assets with USDT in one place
Options
Hot
Trade European-style vanilla options
Unified Account
Maximize your capital efficiency
Demo Trading
Futures Kickoff
Get prepared for your futures trading
Futures Events
Participate in events to win generous rewards
Demo Trading
Use virtual funds to experience risk-free trading
Earn
Launch
CandyDrop
Collect candies to earn airdrops
Launchpool
Quick staking, earn potential new tokens
HODLer Airdrop
Hold GT and get massive airdrops for free
Launchpad
Be early to the next big token project
Alpha Points
Trade on-chain assets and enjoy airdrop rewards!
Futures Points
Earn futures points and claim airdrop rewards
Investment
Simple Earn
Earn interests with idle tokens
Auto-Invest
Auto-invest on a regular basis
Dual Investment
Buy low and sell high to take profits from price fluctuations
Soft Staking
Earn rewards with flexible staking
Crypto Loan
0 Fees
Pledge one crypto to borrow another
Lending Center
One-stop lending hub
VIP Wealth Hub
Customized wealth management empowers your assets growth
Private Wealth Management
Customized asset management to grow your digital assets
Quant Fund
Top asset management team helps you profit without hassle
Staking
Stake cryptos to earn in PoS products
Smart Leverage
New
No forced liquidation before maturity, worry-free leveraged gains
GUSD Minting
Use USDT/USDC to mint GUSD for treasury-level yields
More
Crypto18gH2O
No content yet
- Reward
- 1
- Comment
- Repost
- Share
2-27 Afternoon Market Views
Currently, ETH has rebounded after falling from the high of 2149 and is now oscillating above 2050. The overall structure remains in the high-level correction phase within a bullish trend, and the pattern of higher lows has not been broken. In the short term, 2000 serves as a stage support, while above 2100 remains a dense area of resistance. The bulls and bears are entering a second phase of competition.
BOLL:
Upper band around 2143, middle band around 1952, lower band around 1761.
The Bollinger Bands remain open; after the price retested the middle band without br
BTC-1,83%
- Reward
- 2
- Comment
- Repost
- Share
2-27 Midnight Viewpoint
Currently, ETH has rapidly fallen from the high of 2149, breaking below the 2000 level, with the lowest dip near 1980. The overall structure has shifted from a strong bullish rally to a high-level weakening and pullback pattern, with short-term bearish momentum clearly increasing. If the 2000 level cannot be quickly reclaimed, the market will enter a phase of correction.
BOLL:
Upper band around 2106, middle band around 1930, lower band around 1754.
The Bollinger Bands are gradually flattening after opening upwards. The price has shifted from running close to the upper b
BTC-1,83%
- Reward
- 1
- Comment
- Repost
- Share
- Reward
- 2
- 1
- Repost
- Share
GateUser-e606ef35 :
:
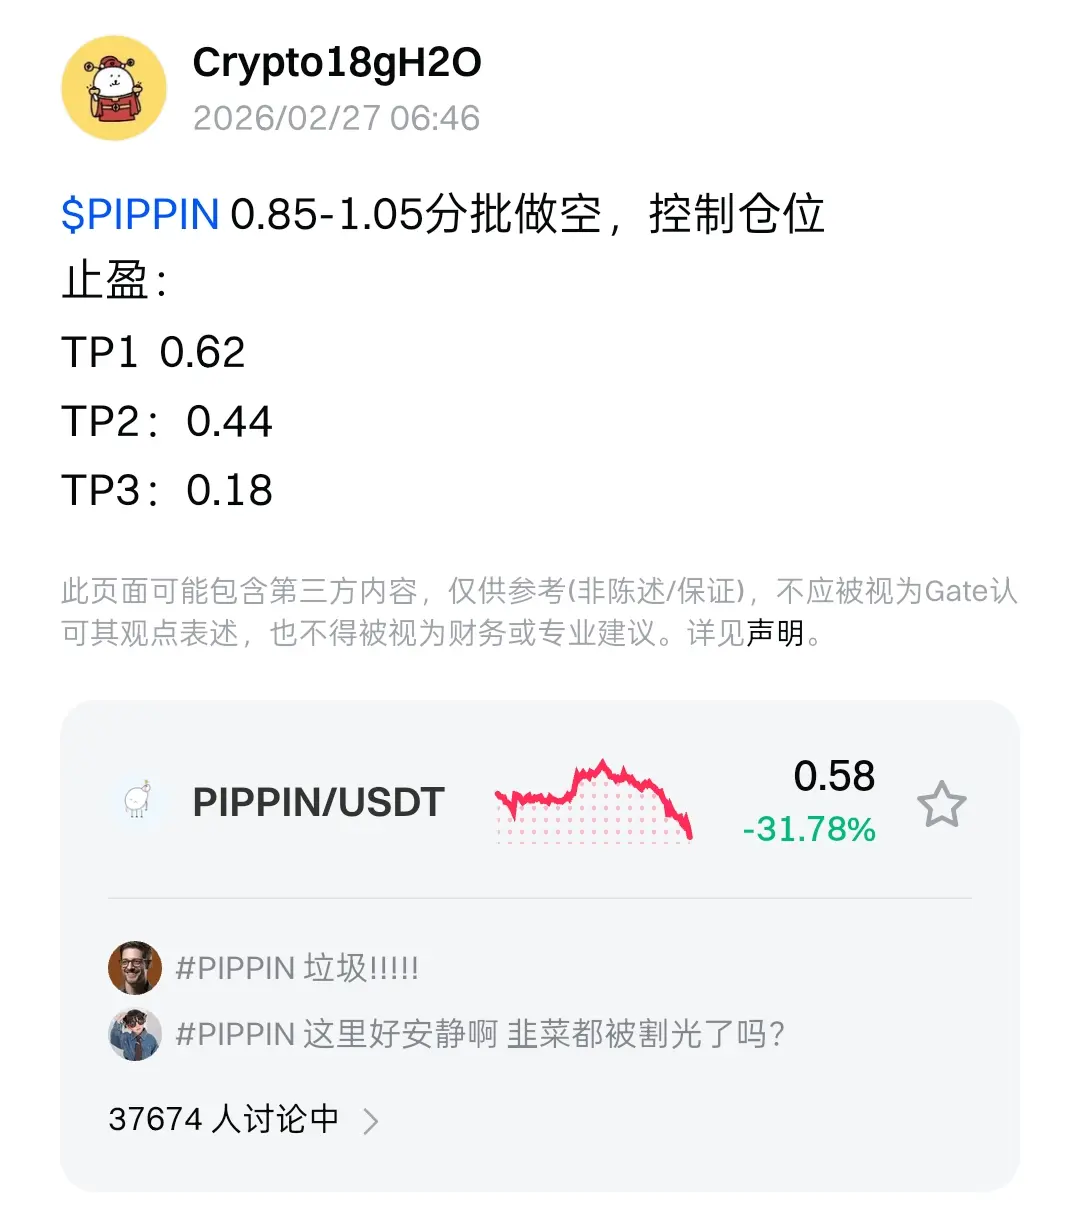
0.18Evening Viewpoints from February 26
Currently, ETH surged to around 2148 and then entered a high-level sideways consolidation, now fluctuating around 2058. The overall structure remains a bullish trend characterized by higher lows, but momentum has slowed after the short-term rally, with prices oscillating within the 2050–2100 range to digest gains. Resistance forms above 2140, while the 2050 level becomes a short-term balance point between bulls and bears.
BOLL:
Upper band around 2105, middle band around 2062, lower band around 2029.
The Bollinger Bands remain in an open state, but the price
ETH-4,2%
- Reward
- 1
- 1
- Repost
- Share
davidgao :
:
Hop on board!🚗2-26 Afternoon Market Views
#比特币反弹 #加密市场反弹 $BTC $ETH
Currently, ETH surged to around 2149 and then pulled back, now trading around 2060 with sideways movement. The overall structure remains a bullish trend characterized by higher lows, but in the short term, it has entered a high-level consolidation phase. The 2140–2150 zone is forming a temporary resistance, and as long as the price remains above 2000 during the pullback, it still indicates a strong recovery structure.
BOLL:
Upper band around 2149, middle band around 2015, lower band around 1880.
The Bollinger Bands are widening upward. Afte
View Original#比特币反弹 #加密市场反弹 $BTC $ETH
Currently, ETH surged to around 2149 and then pulled back, now trading around 2060 with sideways movement. The overall structure remains a bullish trend characterized by higher lows, but in the short term, it has entered a high-level consolidation phase. The 2140–2150 zone is forming a temporary resistance, and as long as the price remains above 2000 during the pullback, it still indicates a strong recovery structure.
BOLL:
Upper band around 2149, middle band around 2015, lower band around 1880.
The Bollinger Bands are widening upward. Afte
- Reward
- 1
- Comment
- Repost
- Share
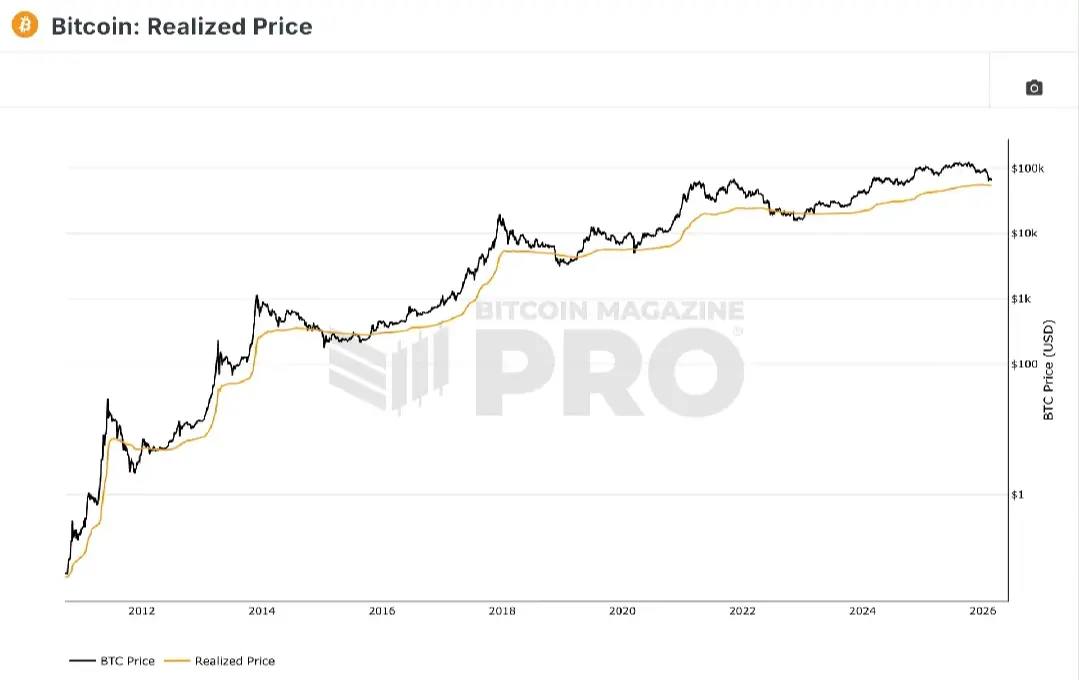
What is the lowest that Bitcoin can possibly drop to? Here's some data, see the chart below.
The black line represents Bitcoin's price, while the yellow line shows the average cost across the entire network. The calculation method is to take the price at which each Bitcoin was last moved on-chain, weighted by trading volume, then divided by the current circulating supply to get the average cost.
Currently, the average cost is $54,785. Among long-term holders, the average cost is $41,000, while short-term holders have an average cost of $89,000. So even if panic selling hits a record low of
ETH-4,2%

- Reward
- 1
- Comment
- Repost
- Share
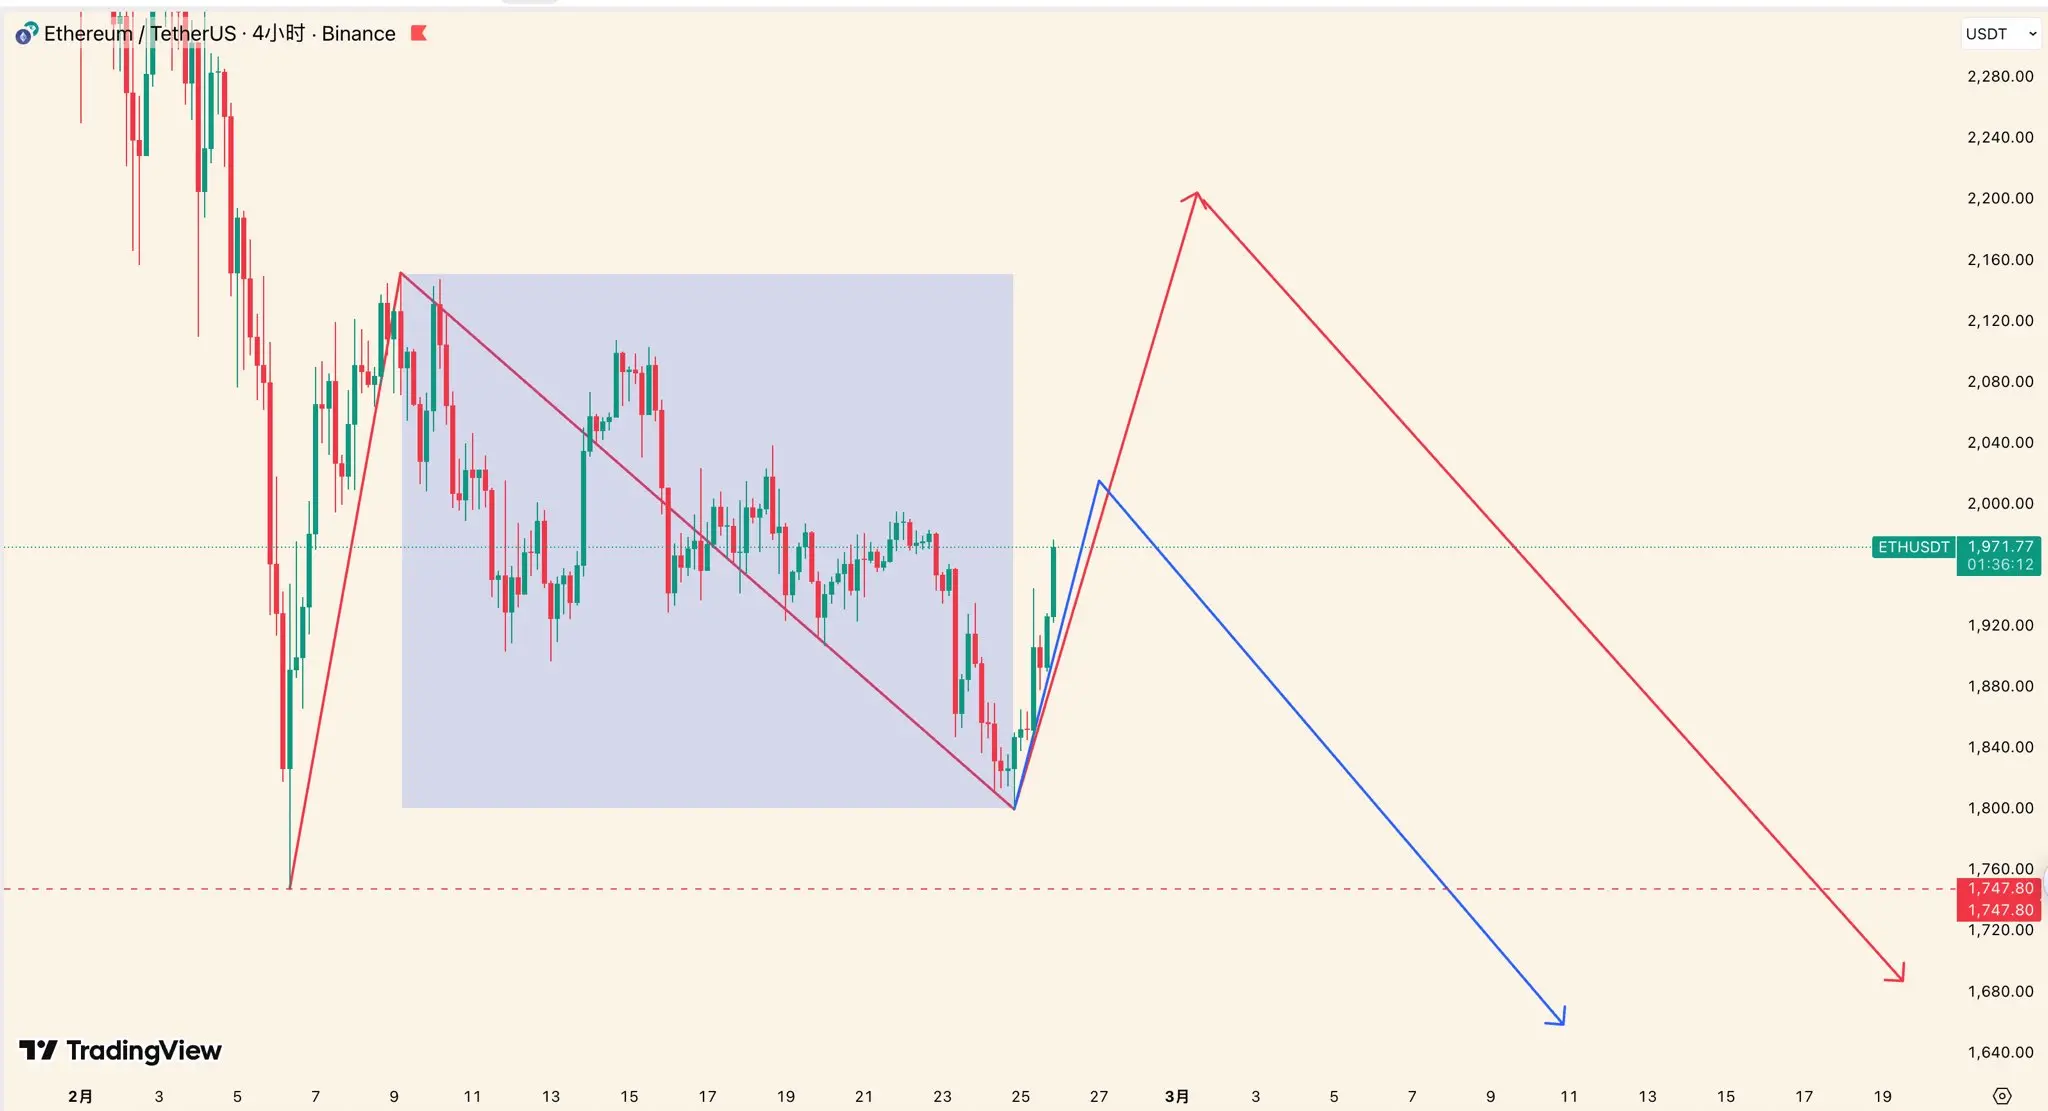
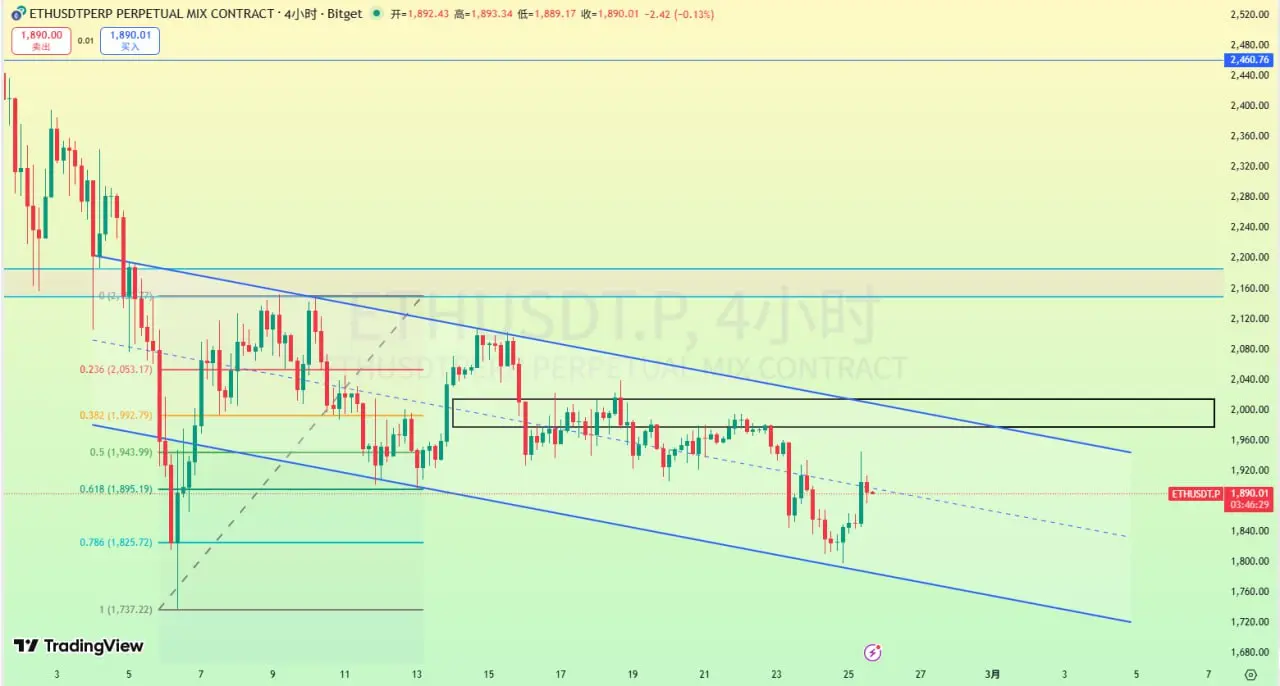
#比特币反弹 $ETH Last night, after stopping the decline at 1800, the V-shaped rebound occurred. The 2.24 level emphasized on February 22nd has once again gained strength! ETH's overall structure follows BTC, and at this point, it is even stronger than BTC.
ETH is currently experiencing a rebound within a downtrend. After the rebound ends, it will continue to decline (see the previous ETH trend analysis tweet on the daily chart). There are two possible scenarios for ETH shown in the chart:
Red route: This upward move is similar to the 1747-2152 level, forming the entire rebound along with the previo
ETH-4,2%

- Reward
- like
- Comment
- Repost
- Share
2-25 Midday Viewpoints
Currently, ETH has rebounded to around 1900 but is facing resistance and consolidating with oscillations. The price is repeatedly tugging around the middle band of the Bollinger Bands. Although a short-term rebound has been achieved from low levels, selling pressure above is gradually emerging, and the momentum of the rebound is slowing down. From a structural perspective, the market has entered a consolidation phase after the rebound, with bulls and bears re-engaging, and no clear trend continuation has formed yet.
BOLL:
Upper band around 2001, middle band around 1869,
ETH-4,2%
- Reward
- 4
- Comment
- Repost
- Share
Optimistically speaking, the market has been in extreme panic over the past month, with Google searches for "Bitcoin is dead" reaching a historical peak. Such sentiment is unlikely to remain at a low point for several months. Bitcoin has fallen for 5 consecutive months, Ethereum for 6 months, both reaching historic lows. When things are at their extreme, they tend to reverse. Although the bear market is still long-term bearish, there is also a need for a phase of rebound. The spring has been compressed to its limit for a long time, and the rebound strength is quite good.
I believe that with so
I believe that with so
BTC-1,83%
- Reward
- like
- Comment
- Repost
- Share
2-25 Midnight Viewpoint
Currently, ETH is experiencing a technical rebound, stopping its decline at around 1796 and rising to approximately 1857. The overall structure remains in a large-scale bearish trend, but a short-term low-level rebound has formed, indicating a correction after the decline. There is significant resistance near the midline of the Bollinger Bands; if volume cannot break through convincingly, the rebound will remain weak.
BOLL:
Upper band around 2033, middle band around 1870, lower band around 1795.
The Bollinger Bands are still trending downward overall, but the lower band
BTC-1,83%
- Reward
- like
- Comment
- Repost
- Share
2-24 Midday Market Views
Currently, ETH has retested the 1810 level and experienced a slight rebound, but overall it remains within a downward trend channel. After breaking through high-level consolidation, it continues to decline, with rebound heights gradually decreasing. Structurally, this is a weak consolidation within a continuing bearish trend. Although there is some minor short-term correction, the overall bearish momentum has not changed.
BOLL:
Upper band around 2038, middle band around 1924, lower band around 1810.
The Bollinger Bands are widening downward, with the price near the low
BTC-1,83%
- Reward
- like
- Comment
- Repost
- Share
2-24 Afternoon Market Views
Currently, ETH has once again fallen below the 1840 level and continues to weaken, with the lowest touching around 1810. The overall structure is a continuation of the breakdown with inertial decline. The rebound height is decreasing, moving averages are continuously diverging downward, and the bearish momentum is clearly dominant. From the trend rhythm, this is not a simple consolidation but a weak correction within a continuing downtrend, and short-term remains biased bearish.
BOLL:
Upper band around 2035, middle band around 1930, lower band around 1820.
The Bolli
BTC-1,83%
- Reward
- like
- Comment
- Repost
- Share
2-24 Midnight Viewpoint
Currently, ETH rebounded to around 1910 but faced resistance and declined again. The market continues its weak downward trend, approaching the support near 1860. From the overall trend perspective, after high-level oscillation and a breakdown, prices have continued to decline, with rebound heights gradually decreasing, indicating a standard bearish continuation pattern. Although there are small short-term rebounds, the downward momentum remains unchanged, and the overall trend is still bearish.
BOLL:
Upper band around 2020, middle band around 1960, lower band around 183
ETH-4,2%
- Reward
- 2
- Comment
- Repost
- Share
ZEC Small Meat
Direction: 1x Short
Entry: Near 275
Take Profit: Level 1: Around 262 (for safety) Level 2: Around 250 Level 3: Around 200 (long-term after heat dissipates)
Stop Loss: Slightly above 285, then you can reopen near the 300 resistance level. If doing 1x short, no need to set a stop loss because it won't liquidate. Replenish near 300. If caught, just hold and it will come down.
Reason: Resistance around 270-280 is quite strong, you can try placing a short order there. Avoid high leverage.
Note: Don't place orders at exact integers, as they are hard to execute. Placing slightly below
ZEC-7,45%
- Reward
- 1
- 1
- Repost
- Share
Crypto18gH2O :
:
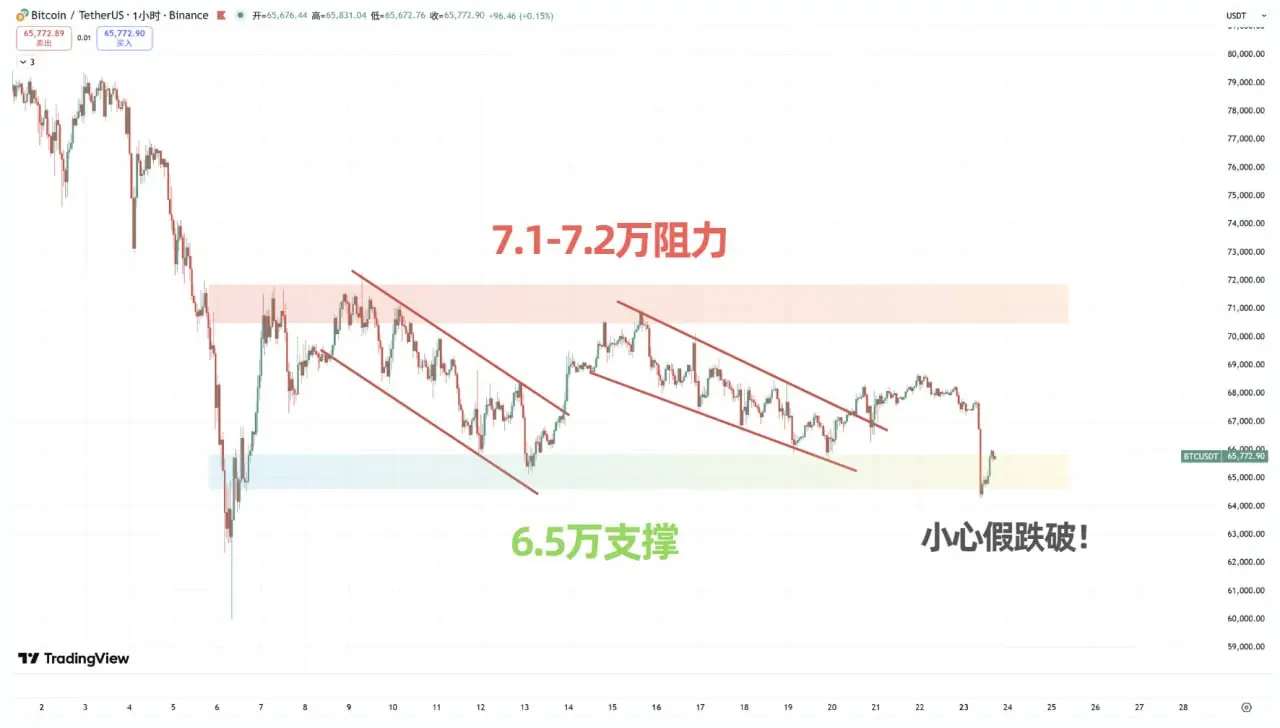
Good luck and prosperity 🧧Bitcoin BTC
Direction: Short
Entry: Around 6.85-6.9
Take Profit: Level 1: Around 67,000 (conservative) Level 2: 66,000
Stop Loss: Slightly above 69,200
Reason: Bitcoin faces resistance around 69,000, so a pullback can be expected
Personal opinion: Avoid placing orders at exact integers, as they are hard to fill. Placing orders just below the resistance zone makes execution easier. Currently, due to many fake breakouts and false dips, to prevent such situations, we set the stop loss a bit higher, lower the risk-reward ratio, and significantly increase the win rate for better trading outcomes
#我
BTC-1,83%
- Reward
- 1
- Comment
- Repost
- Share
Evening Viewpoints from February 23
Currently, ETH has tested the 1844 support level and experienced a rapid rebound, reaching up to around 1915, but overall it remains below the previous breakdown zone. From a structural perspective, this is a technical corrective rebound after a decline, and it has not yet regained the key midline and previous high resistance areas. The trend still favors a bearish correction phase under the dominance of a downtrend, with short-term momentum leaning towards consolidation and weakness.
BOLL:
Upper band around 2015, middle band around 1950, lower band around 1
ETH-4,2%
- Reward
- 2
- Comment
- Repost
- Share
February 23 Midday Market Outlook
Currently, ETH has weakened after consolidating around the 1950 level, then resumed a sharp decline, breaking through the 1900 psychological level and reaching a low of around 1844. Overall, after a period of sideways movement at high levels, the breakdown confirms the continuation of a bearish trend. In the short term, the trend is accelerating. Although there has been a slight technical rebound, the price remains below the previous breakdown zone, and the bearish pattern has not changed. The current momentum is dominated by bears.
BOLL:
Upper band around 201
ETH-4,2%
- Reward
- 1
- 2
- Repost
- Share
Mr.Dapeng :
:
Is it empty?View More
- Reward
- 1
- Comment
- Repost
- Share