Trade
Basic
Futures
Futures
Hundreds of contracts settled in USDT or BTC
Options
HOT
Trade European-style vanilla options
Unified Account
Maximize your capital efficiency
Demo Trading
Futures Kickoff
Get prepared for your futures trading
Futures Events
Participate in events to win generous rewards
Demo Trading
Use virtual funds to experience risk-free trading
Earn
Launch
CandyDrop
Collect candies to earn airdrops
Launchpool
Quick staking, earn potential new tokens
HODLer Airdrop
Hold GT and get massive airdrops for free
Launchpad
Be early to the next big token project
Alpha Points
NEW
Trade on-chain assets and enjoy airdrop rewards!
Futures Points
NEW
Earn futures points and claim airdrop rewards
Investment
Simple Earn
Earn interests with idle tokens
Auto-Invest
Auto-invest on a regular basis
Dual Investment
Buy low and sell high to take profits from price fluctuations
Soft Staking
Earn rewards with flexible staking
Crypto Loan
0 Fees
Pledge one crypto to borrow another
Lending Center
One-stop lending hub
VIP Wealth Hub
Customized wealth management empowers your assets growth
Private Wealth Management
Customized asset management to grow your digital assets
Quant Fund
Top asset management team helps you profit without hassle
Staking
Stake cryptos to earn in PoS products
Smart Leverage
NEW
No forced liquidation before maturity, worry-free leveraged gains
GUSD Minting
Use USDT/USDC to mint GUSD for treasury-level yields
More
知行合一TV策略
No content yet
知行合一TV策略
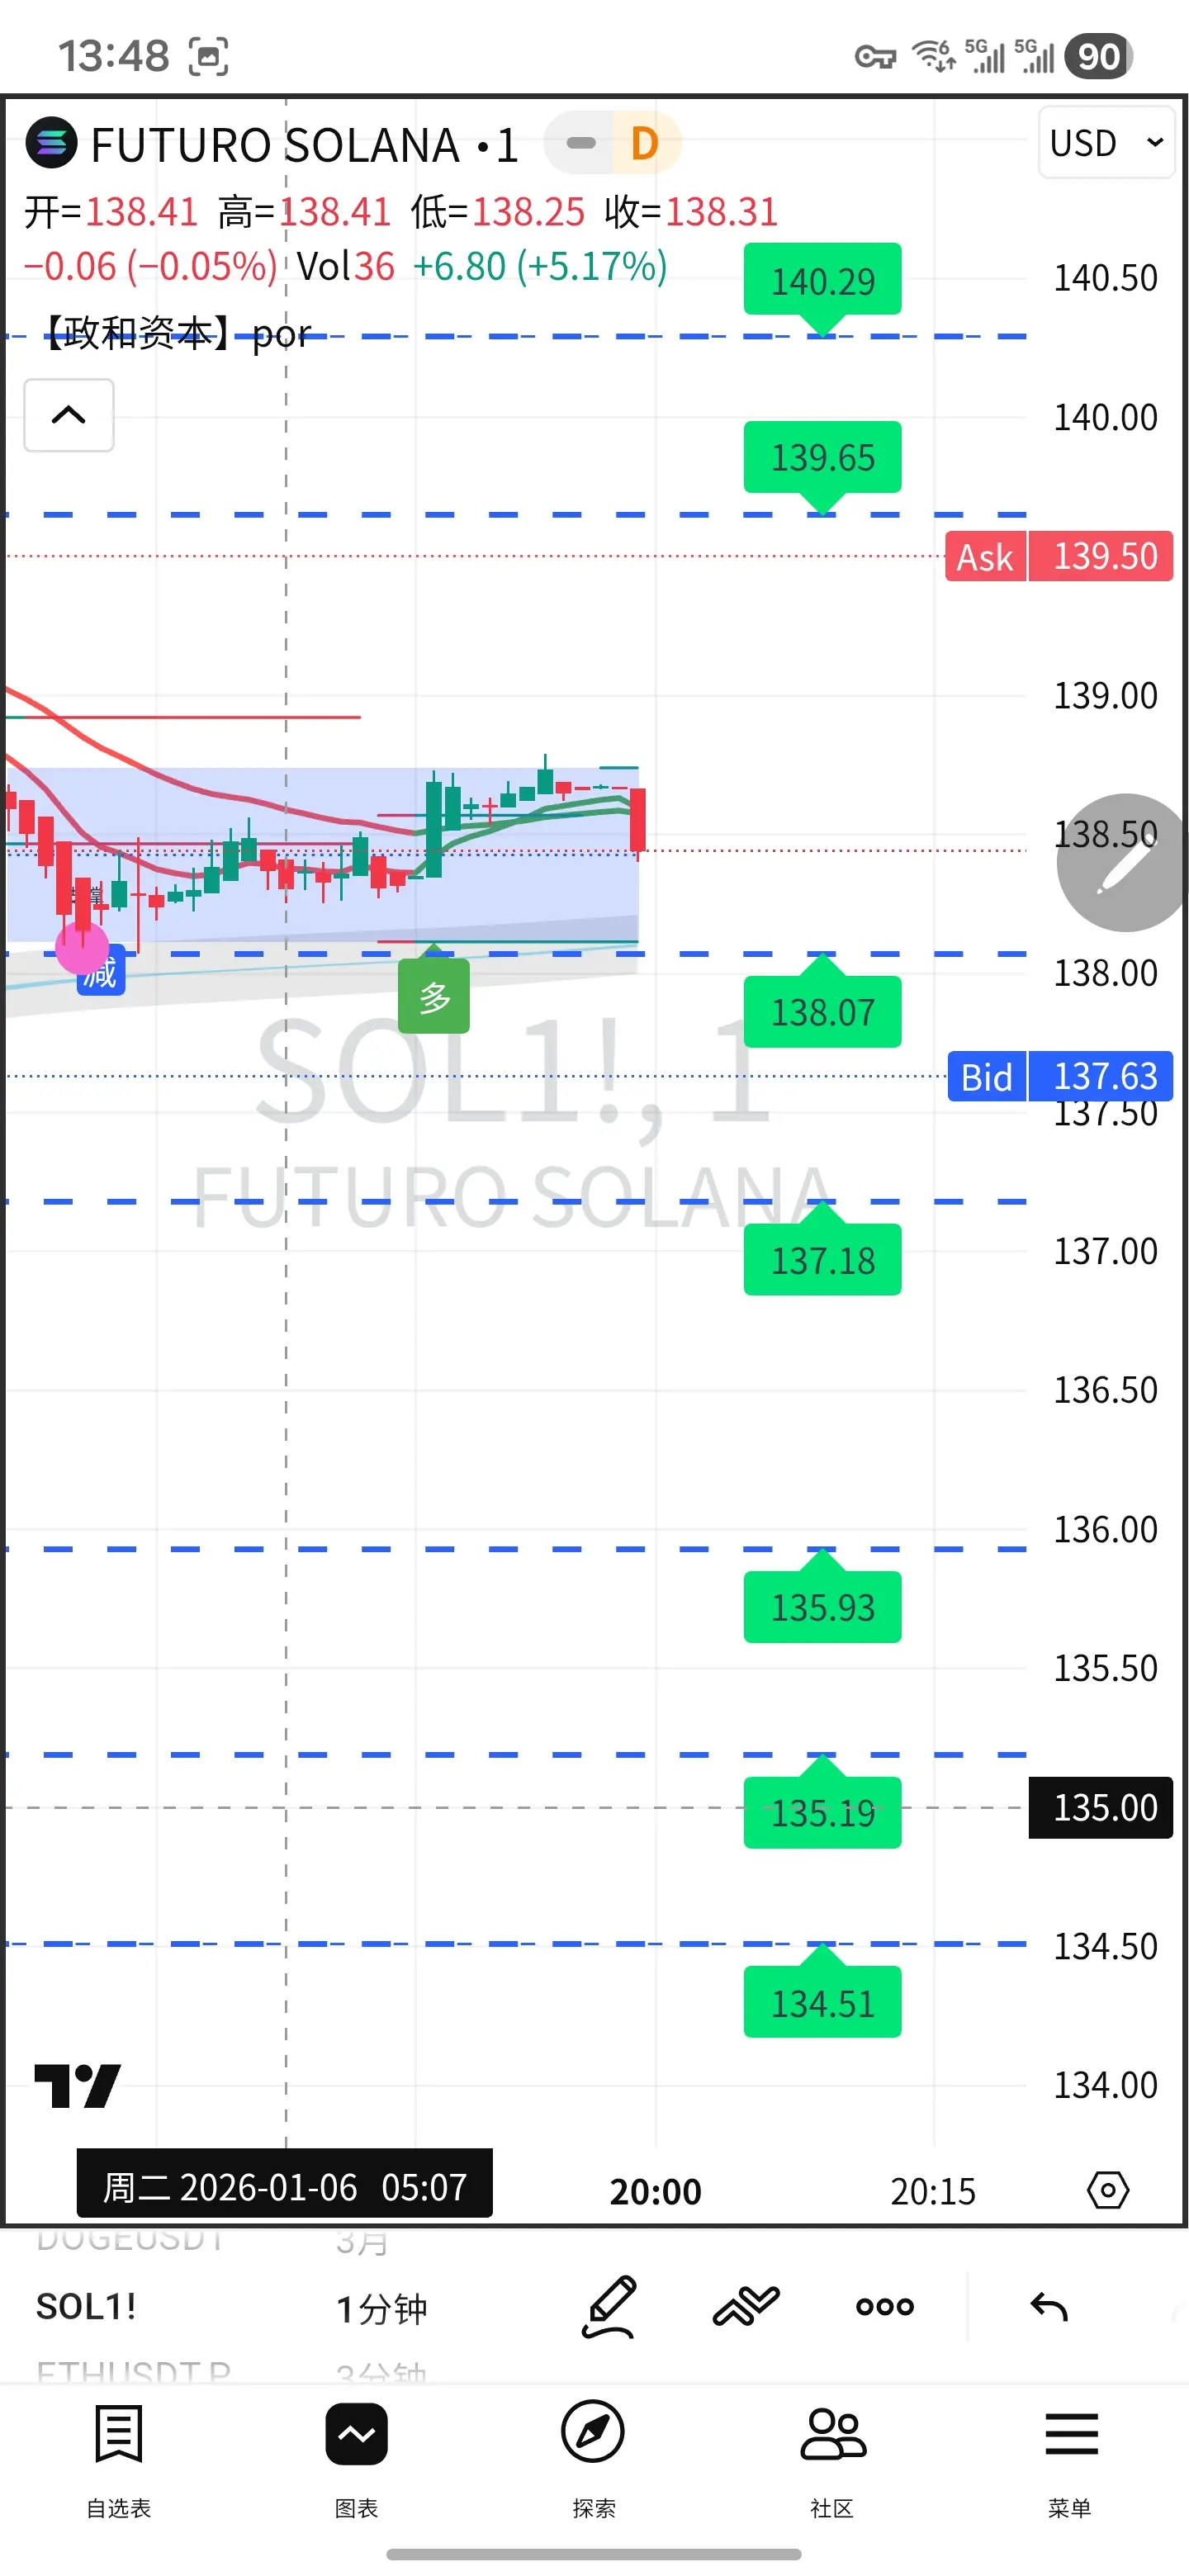
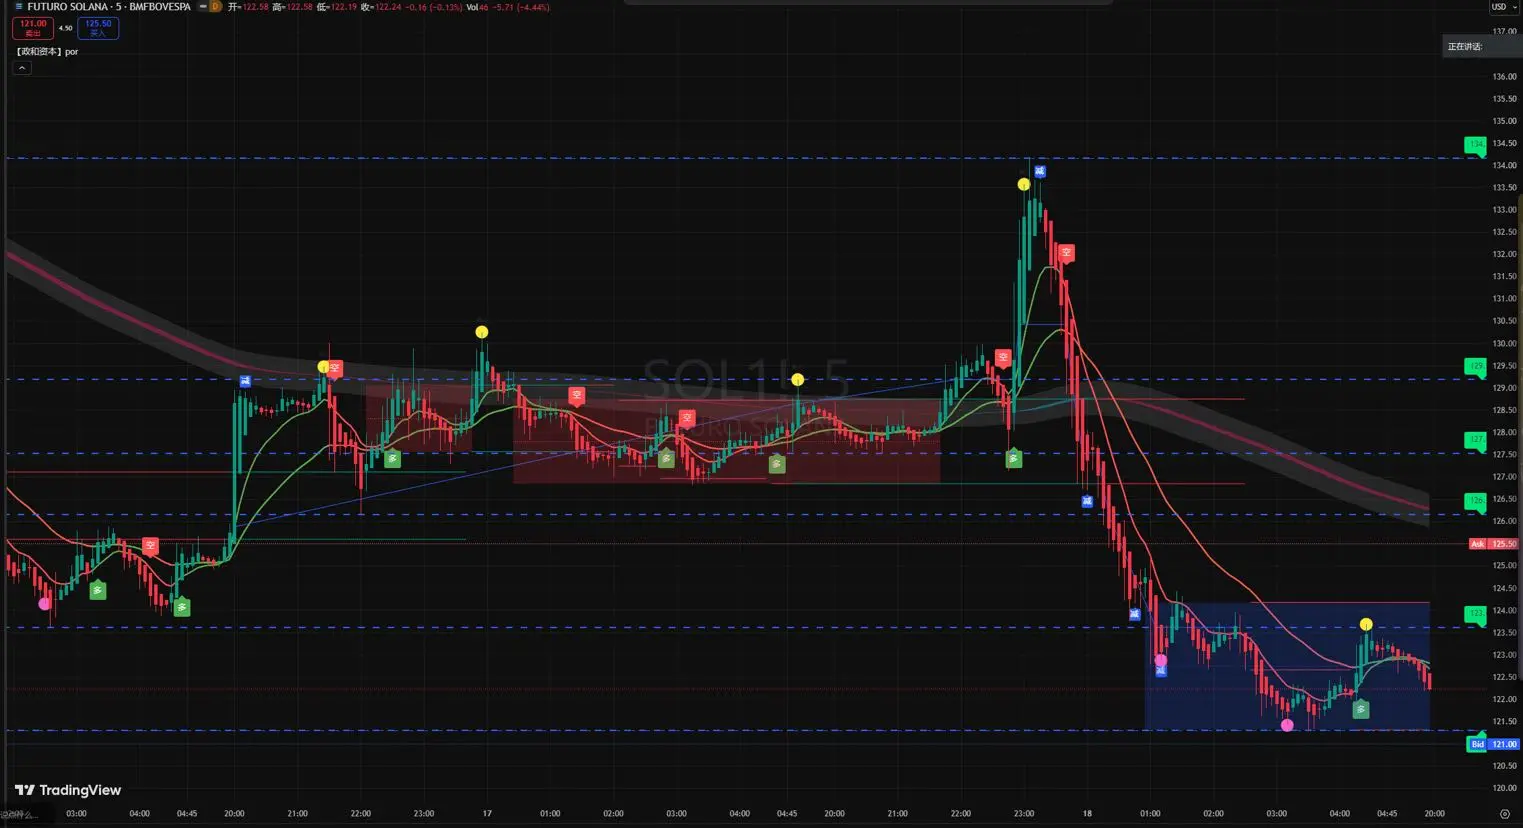
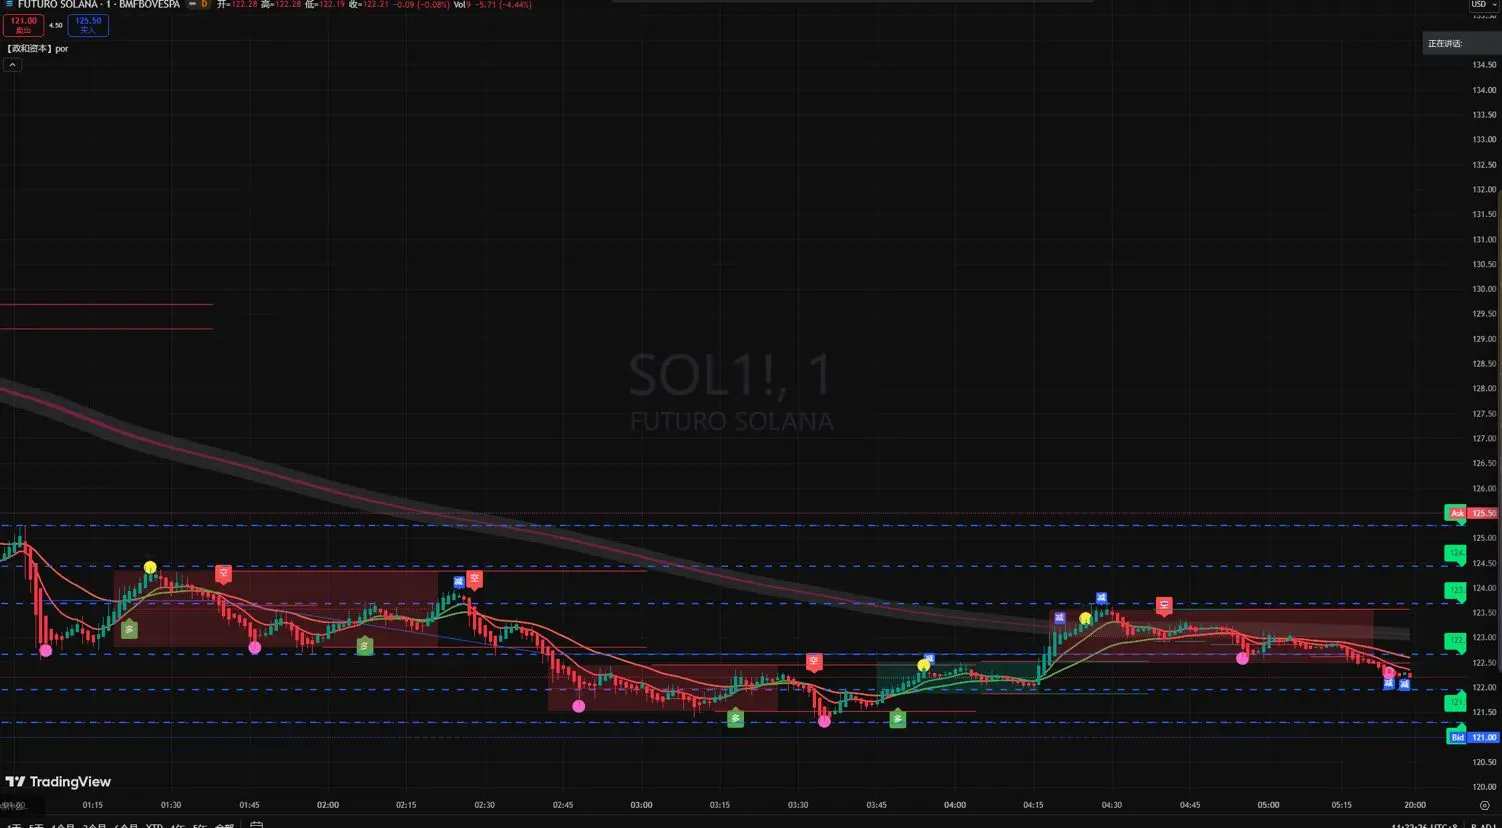
January 6th SOL Core Conclusion: The bullish trend continues, short-term overbought conditions require a pullback. Focus on low-positioned longs during dips, consider light positions on volume breakthroughs, strictly control positions and stop-losses, and avoid blindly shorting.
I. Market and Indicators (January 6th, 14:00)
- Price: Peak around 139.87, currently near 137.50, daily candles remain bullish, 5/10-day moving averages are golden cross upward
- Key Indicators: Daily RSI around 68, leaning towards strong; 4-hour/hour RSI near 80 overbought, MACD bullish but short-term correction possi
SOL0,52%
- Reward
- 4
- 4
- Repost
- Share
GateUser-d10f5768 :
:
New Year Wealth Explosion 🤑View More
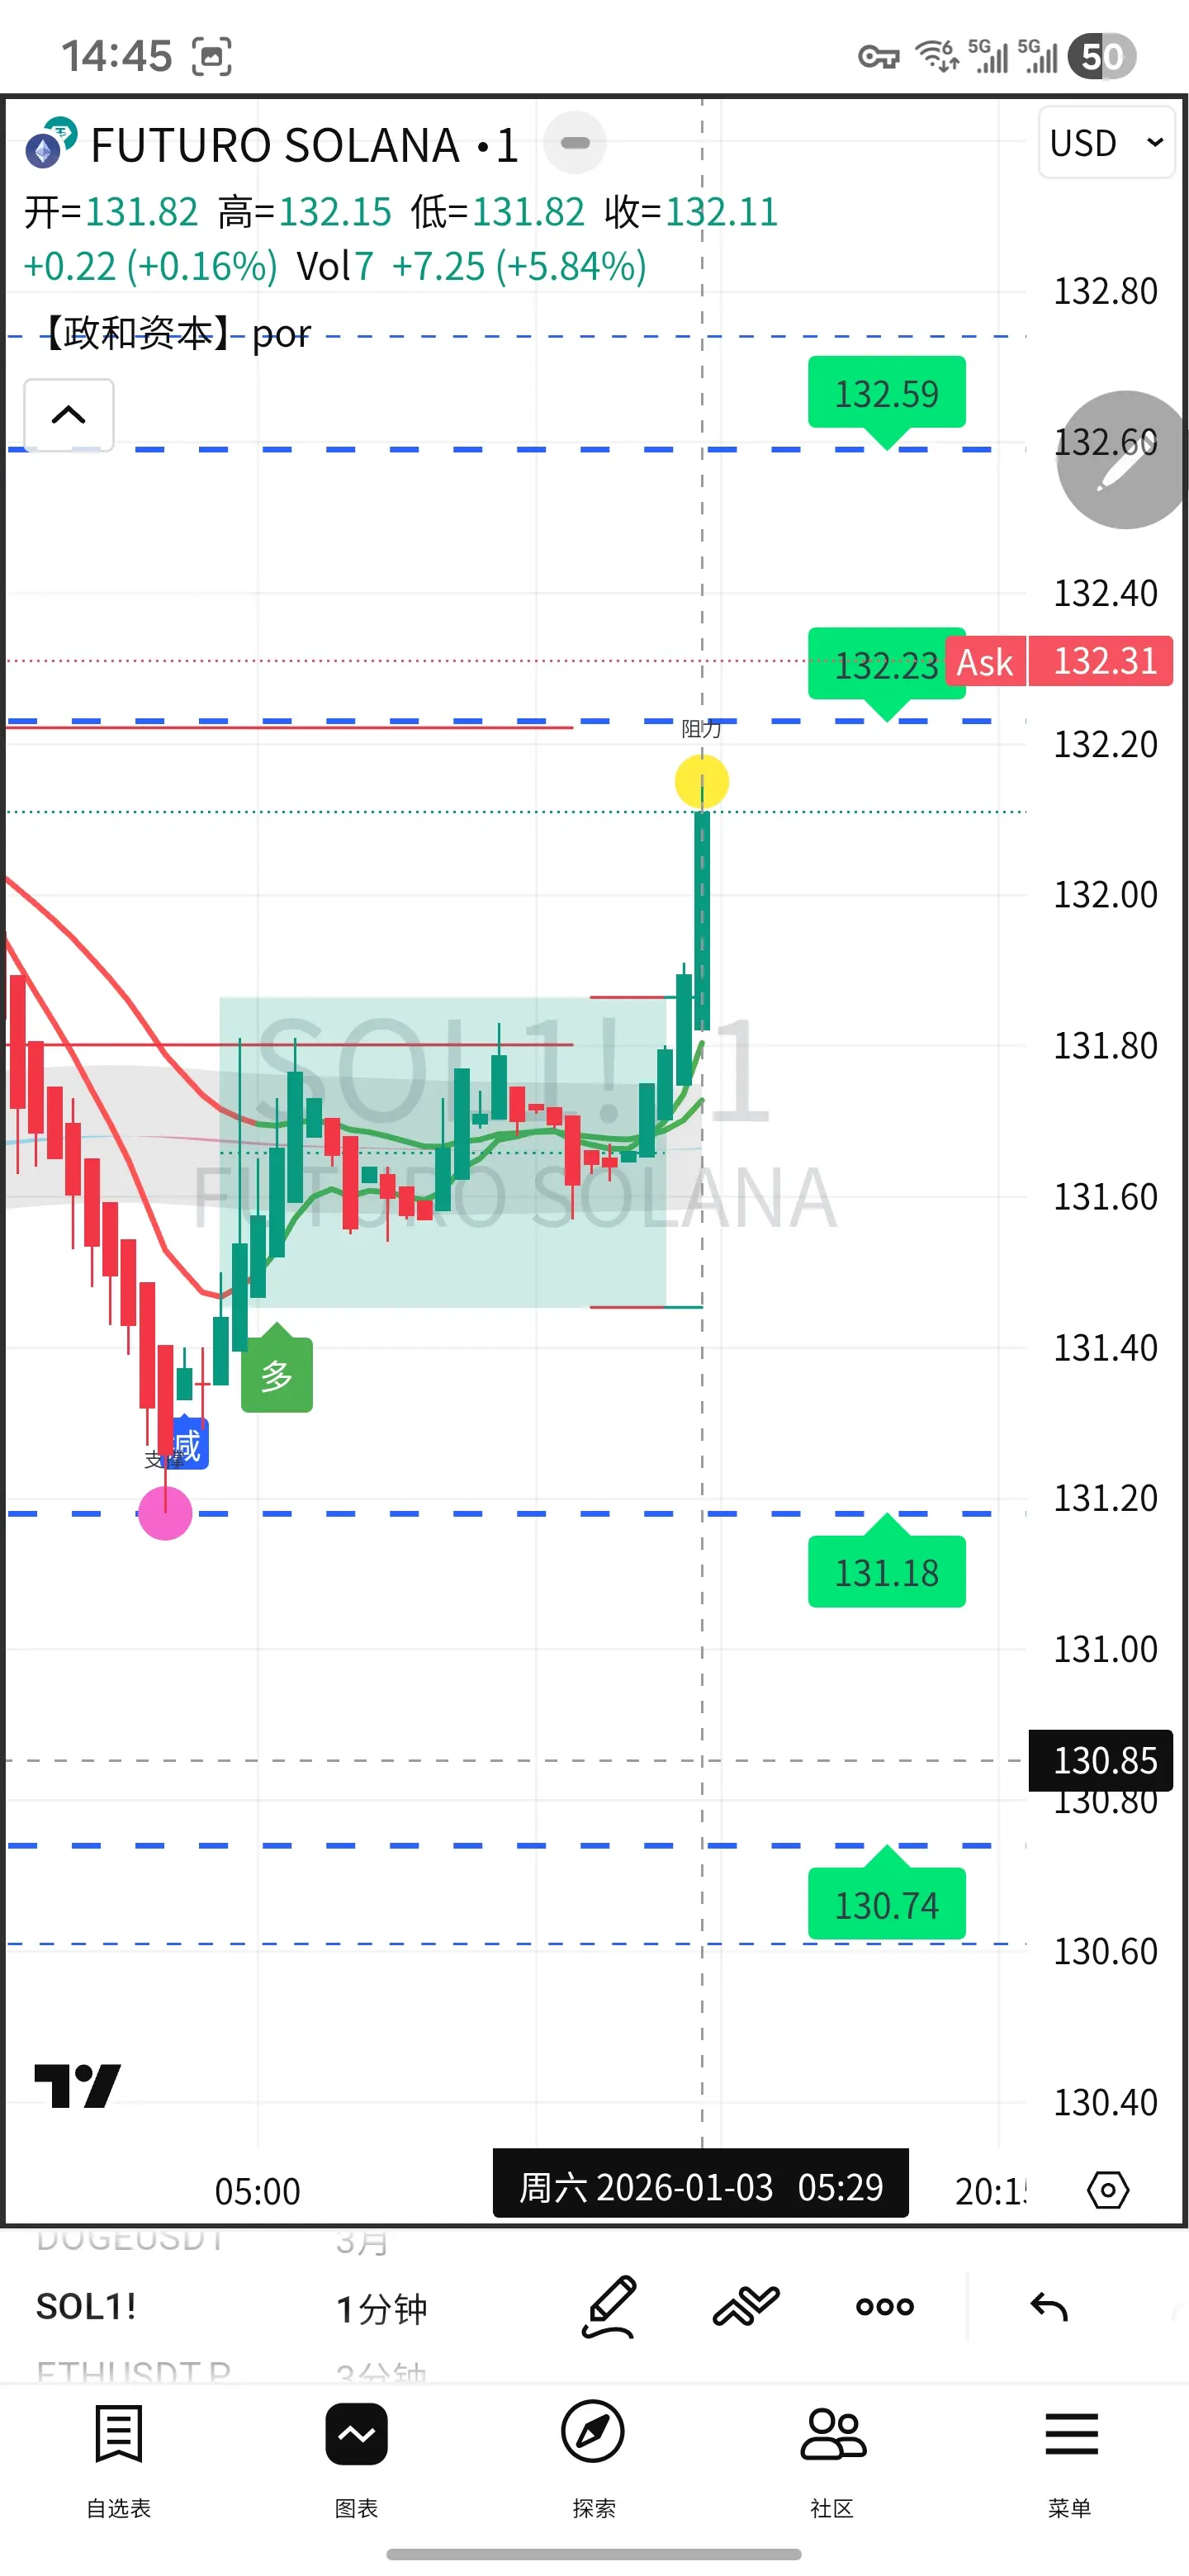
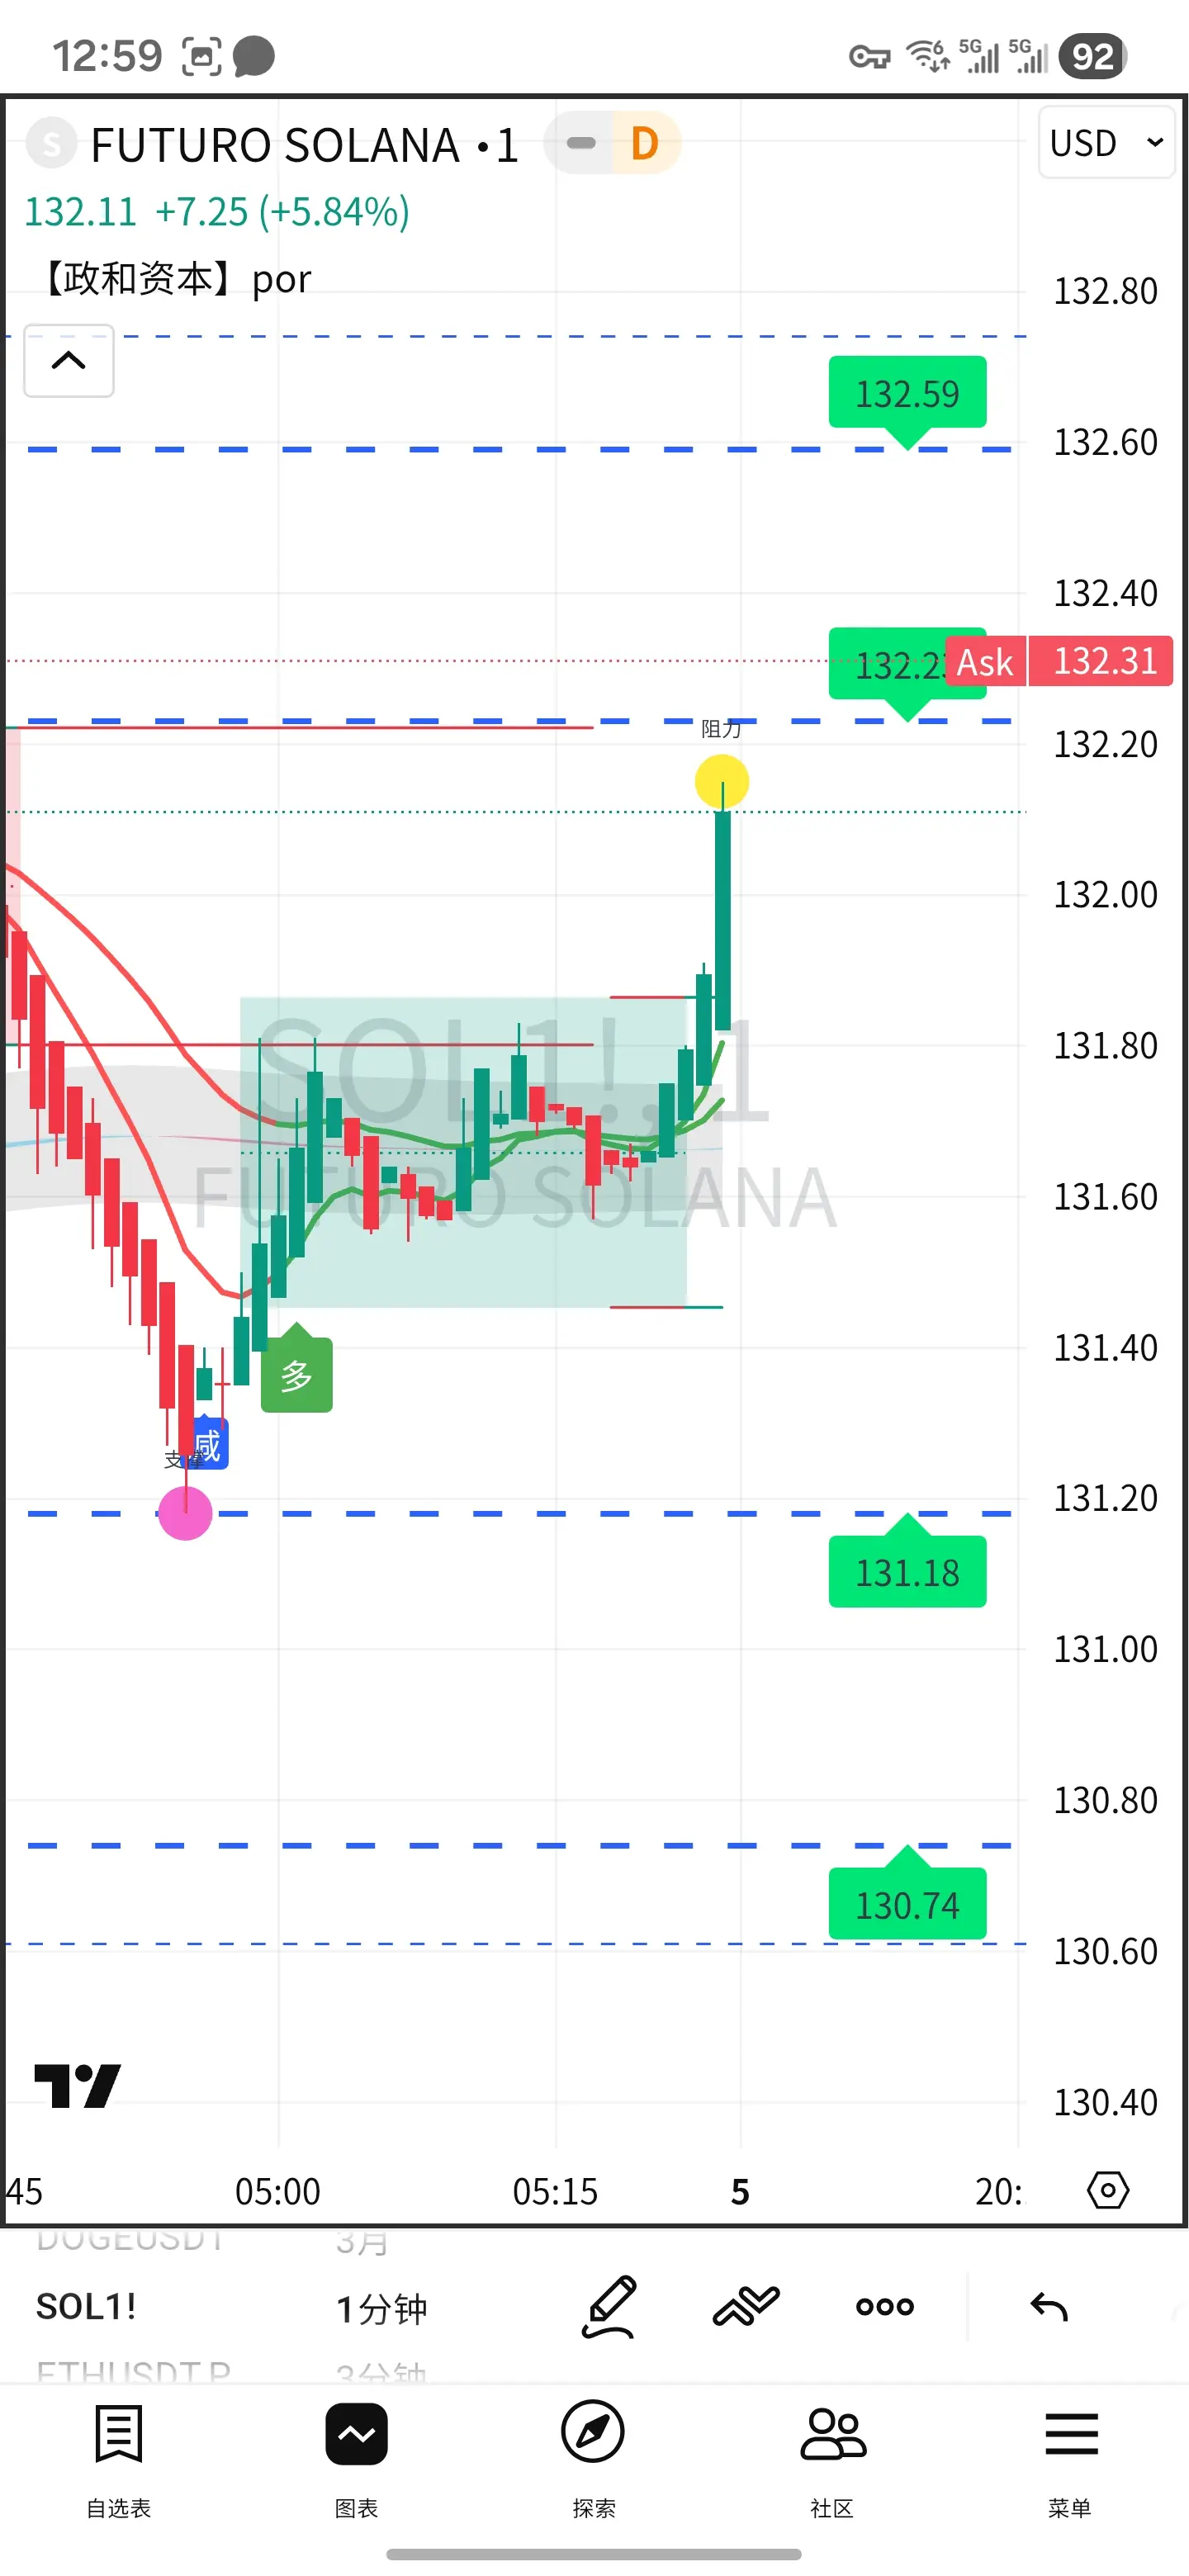
January 5, 2026 14:50 (UTC+8), SOL price is approximately 135.6. The overall bullish trend remains intact with short-term high-level oscillations. The strategy focuses on buying on dips, cautious high-altitude trading, strict position control, and stop-loss management.
Core Views and Key Levels
- Trend Judgment: Daily bullish structure continues, 4-hour bullish alignment; 1-hour RSI overbought, 4-hour MACD momentum weakening, indicating a technical pullback may be needed.
- Key Support: 134.0-134.5 (support after intraday breakout); 132.0-132.5 (strong support); 130.0-131.0 (mid-term defense).
SOL0,52%
- Reward
- 16
- 11
- Repost
- Share
GateUser-7c026fae :
:
New Year Wealth Explosion 🤑View More
January 4, 2026 13:00 (UTC+8), SOL current price is $133.80 USD, showing relative strength intraday but 4-hour RSI is overbought, short-term pullback correction needed.
I. Key Levels (USD)
- Immediate support: 132.50-132.00 (key intraday pullback level)
- Strong support: 131.00-130.00 (yesterday's low + 20 EMA)
- Extreme support: 129.00 (24H low + previous platform)
- Immediate resistance: 134.50-135.00 (today's high + psychological level)
- Strong resistance: 136.00-137.00 (previous dense trading zone)
- Ultimate resistance: 138.50 (Murray 4/8 resonance level)
II. Technical Highlights
- Daily
SOL0,52%
- Reward
- 18
- 9
- Repost
- Share
GateUser-d10f5768:
2026 Go Go Go 👊View More
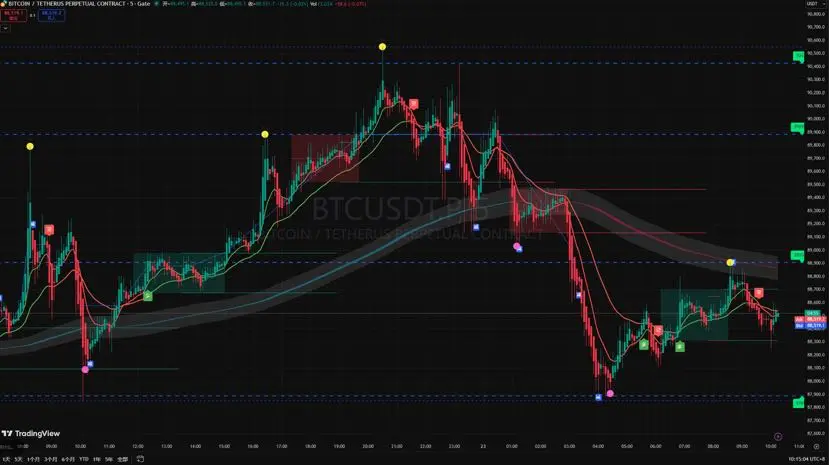
As of January 3, 2026, 13:00, BTC is currently trading at $89,000, with intra-day fluctuations mainly oscillating within the range of 87,500-90,000. The strategy is to buy low and sell high within this range, and to add positions upon key level breakthroughs.
Core Key Levels (USD)
- Support: 88,700 (EMA120), 87,500 (watershed between bulls and bears), 86,000 (strong support)
- Resistance: 90,000 (psychological barrier), 90,500 (previous high)
Technical Highlights
- Daily Chart: Three consecutive long upper shadows, heavy selling pressure around 90,000, MACD death cross, indicating a bias towar
BTC-2,16%
- Reward
- 1
- 2
- Repost
- Share
BigCwynn :
:
Just go for it💪View More
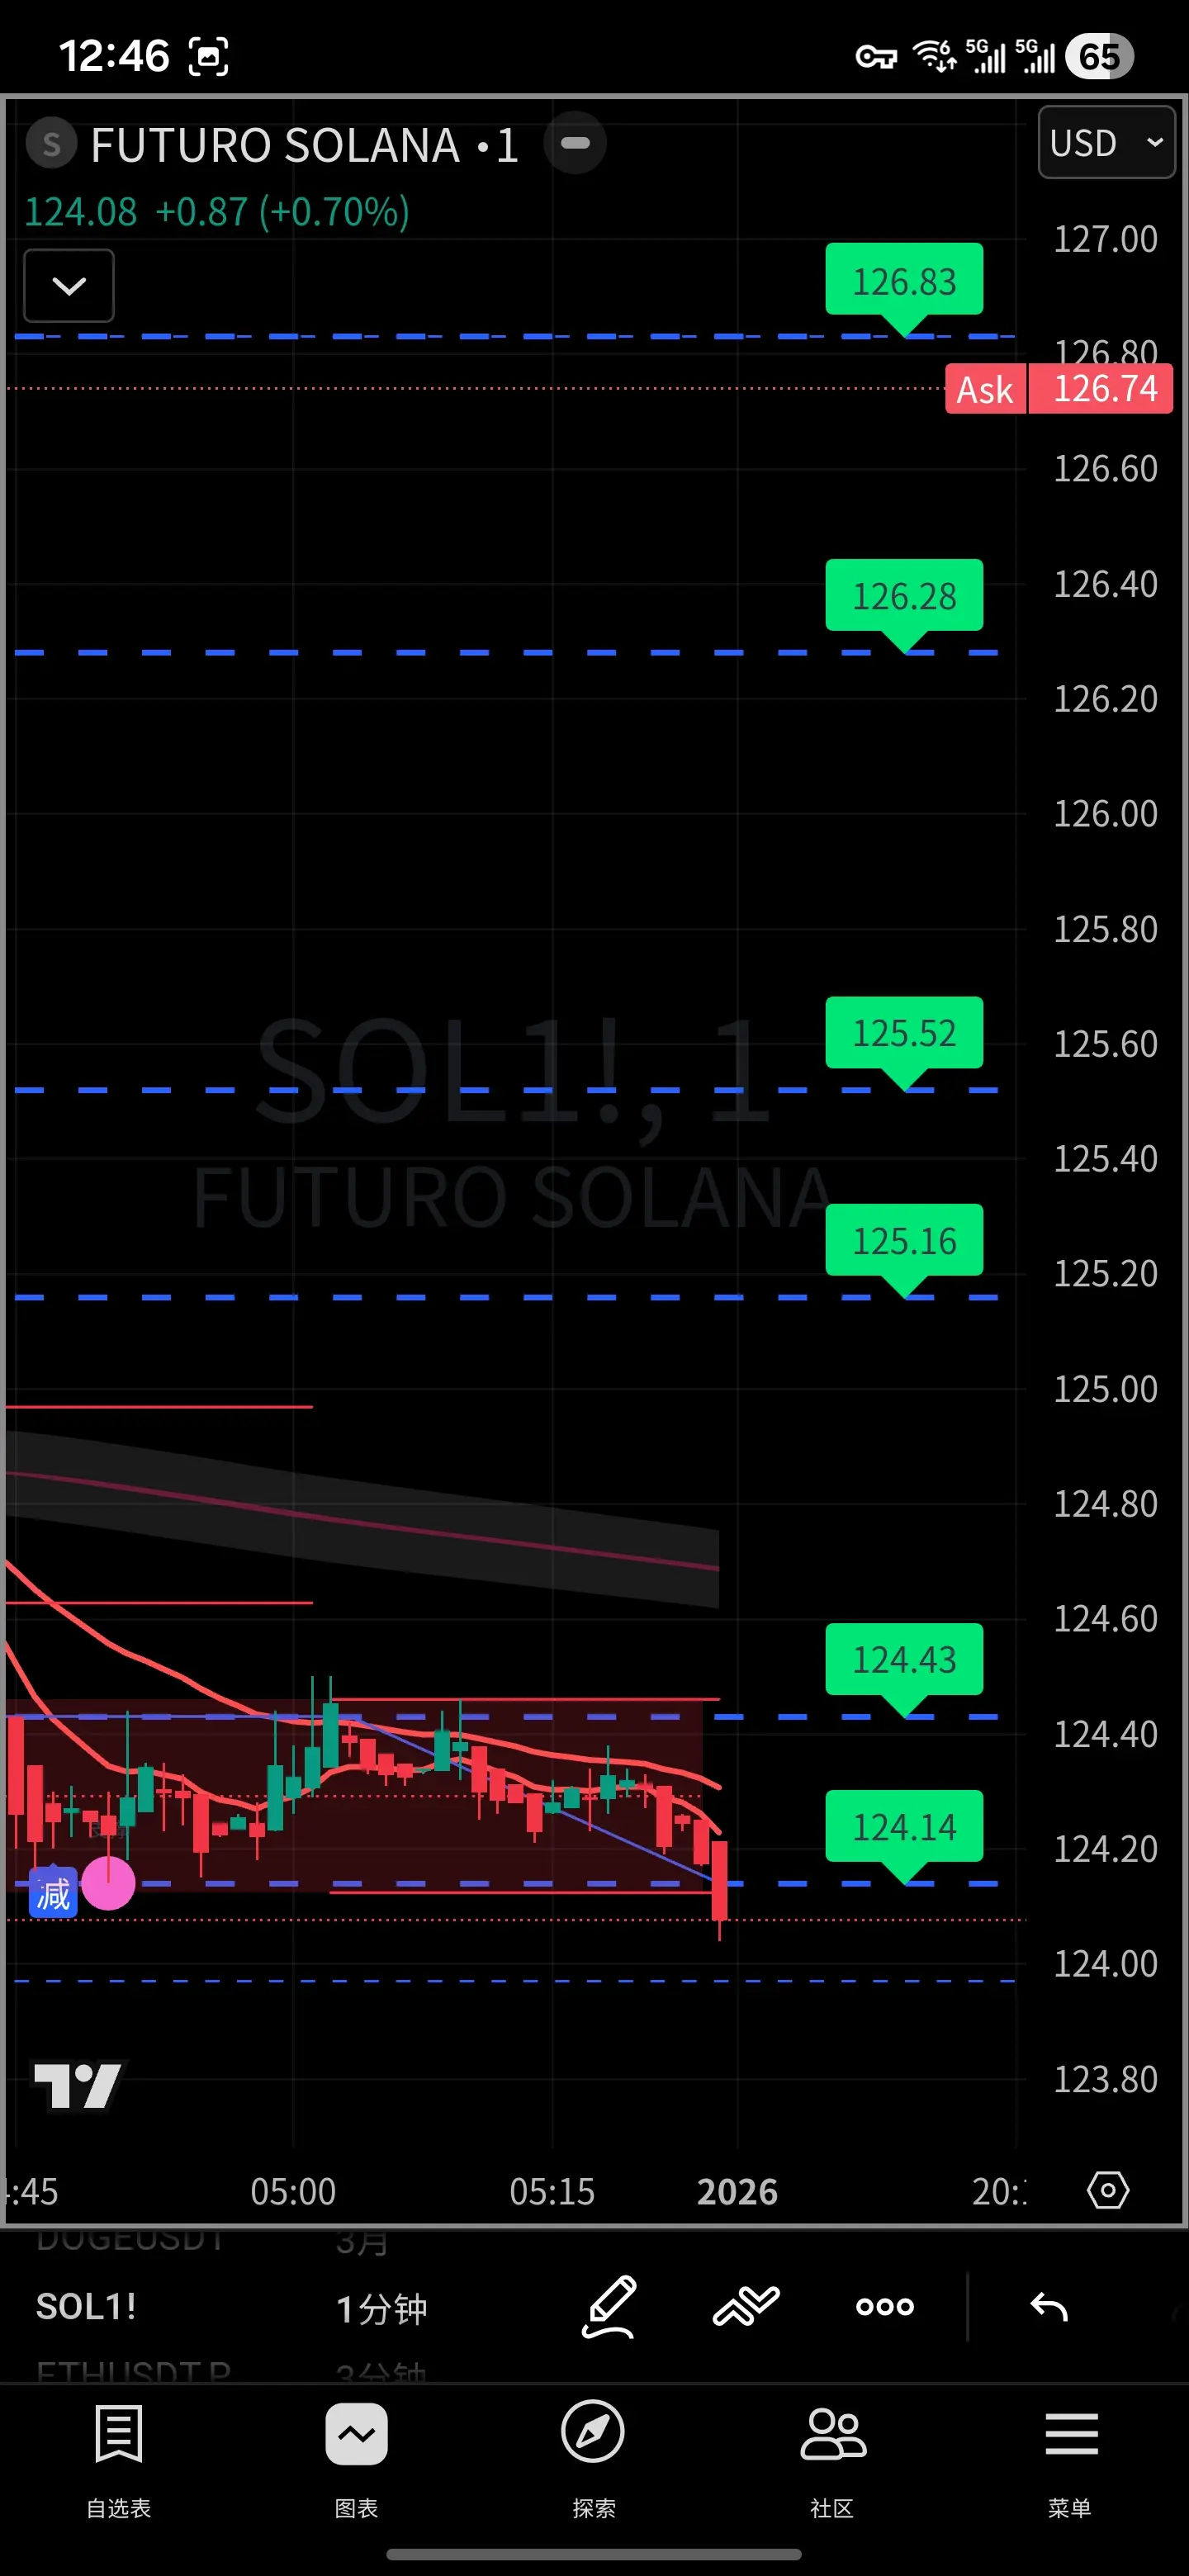
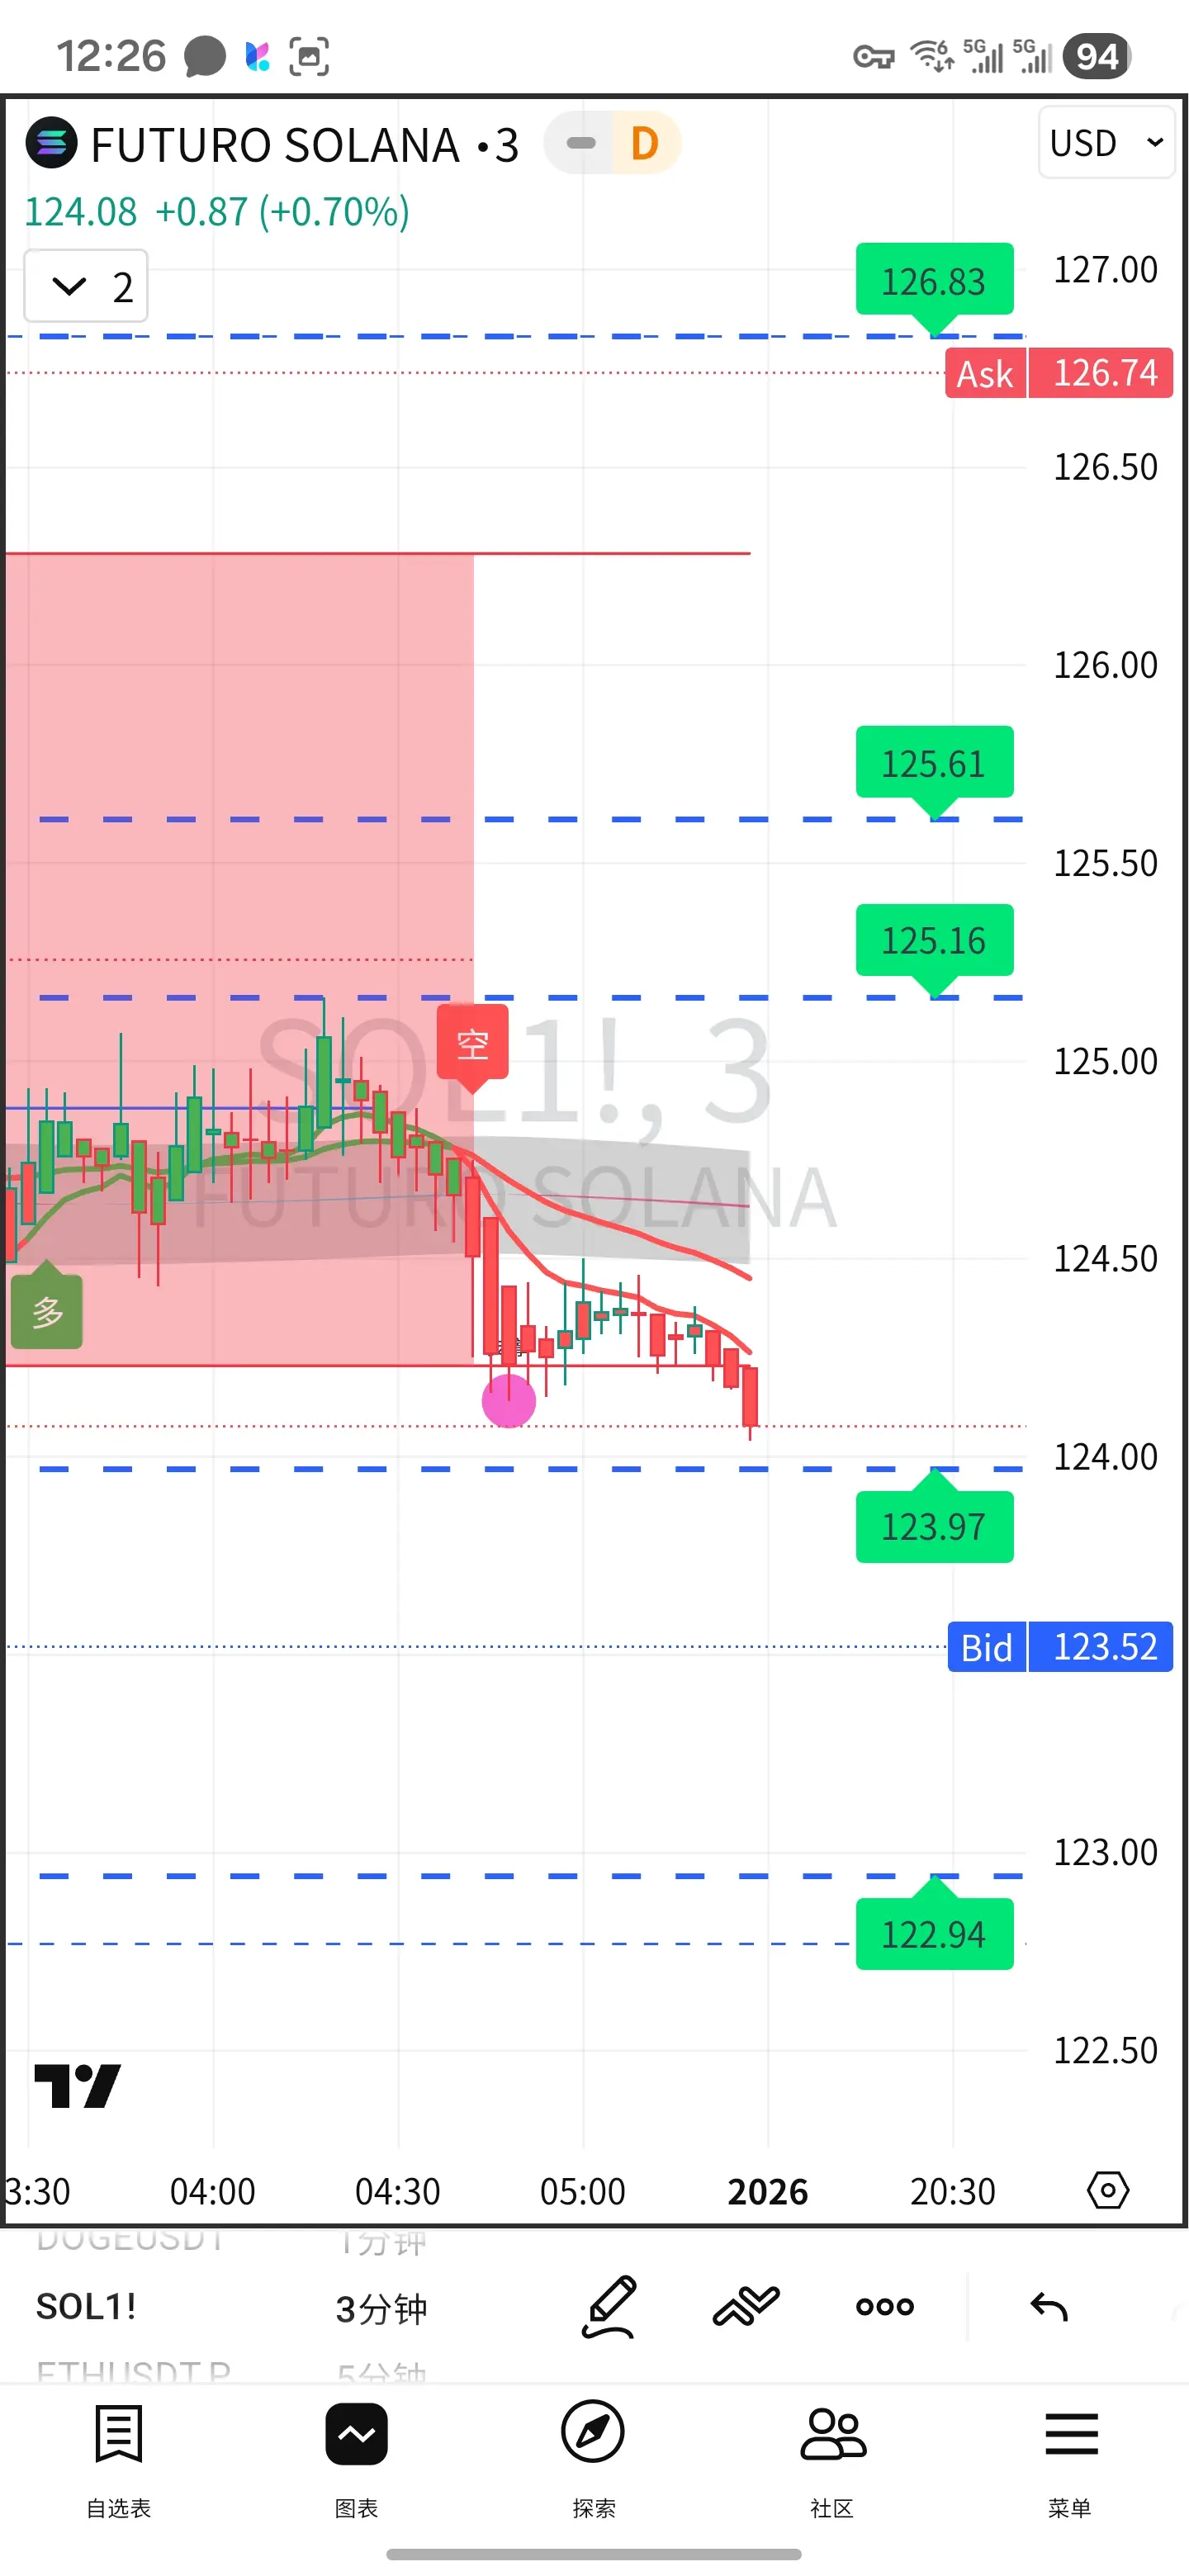
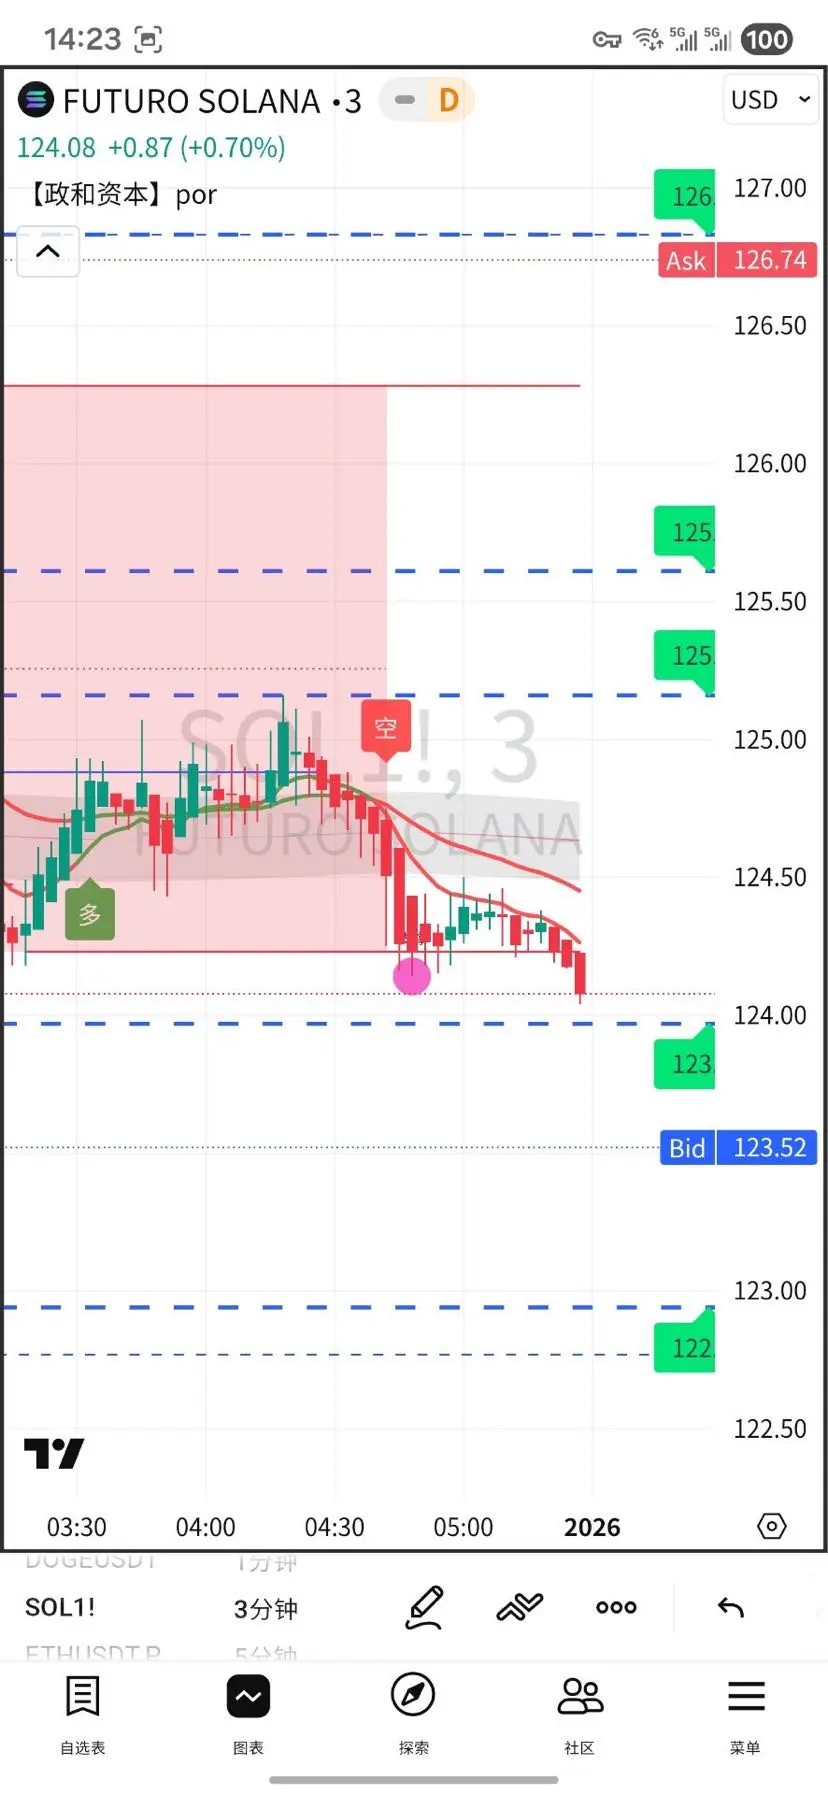
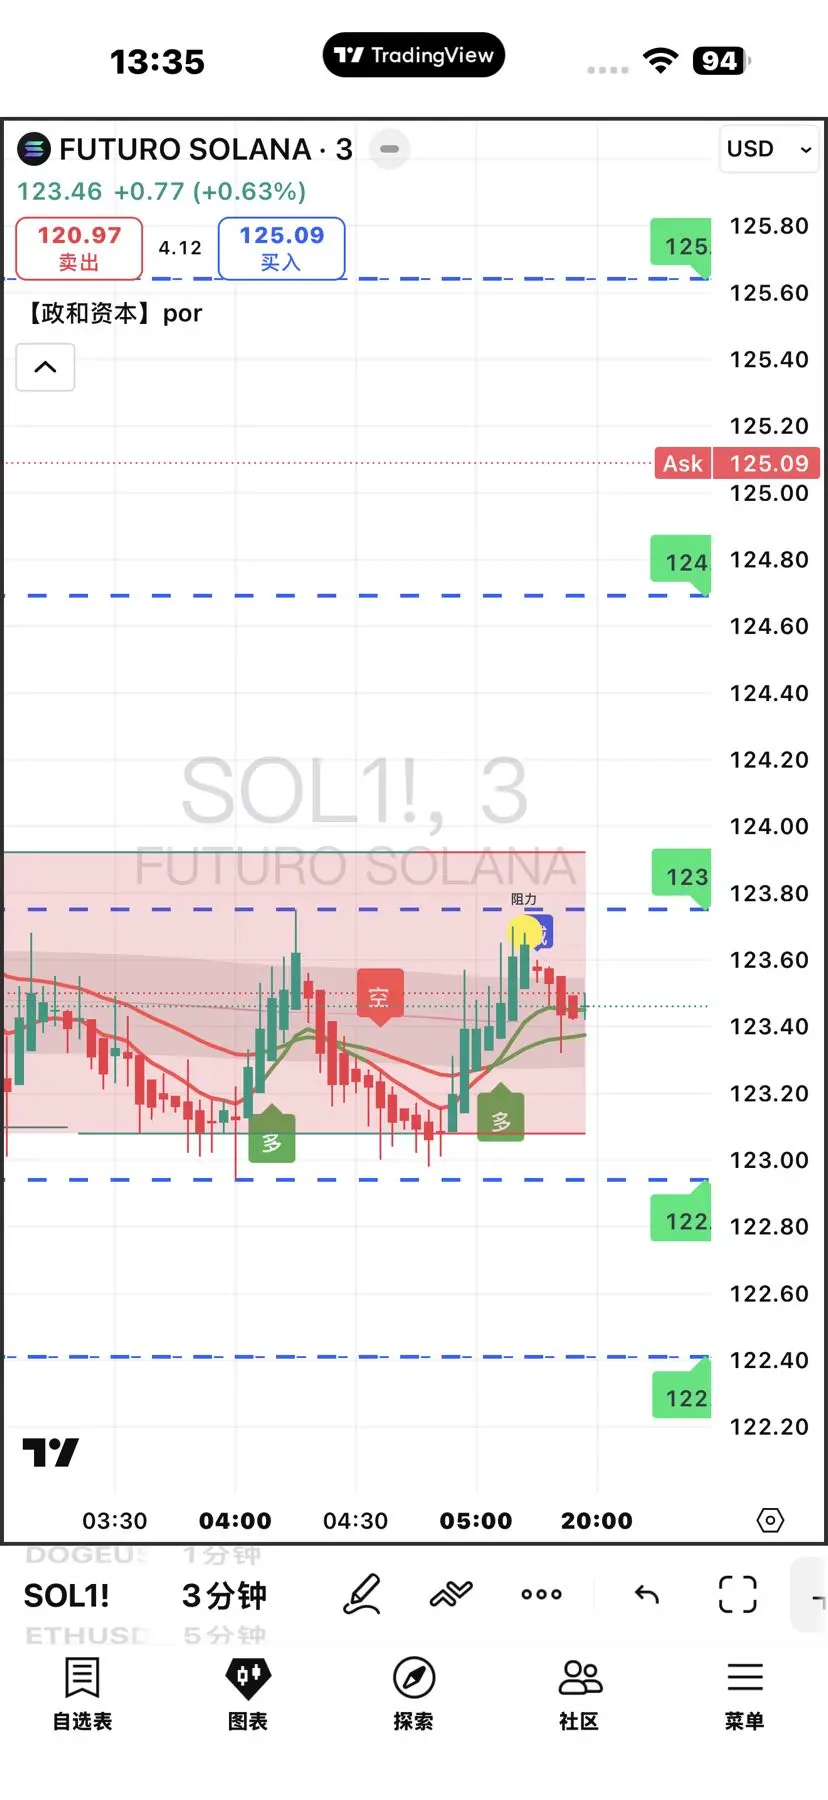
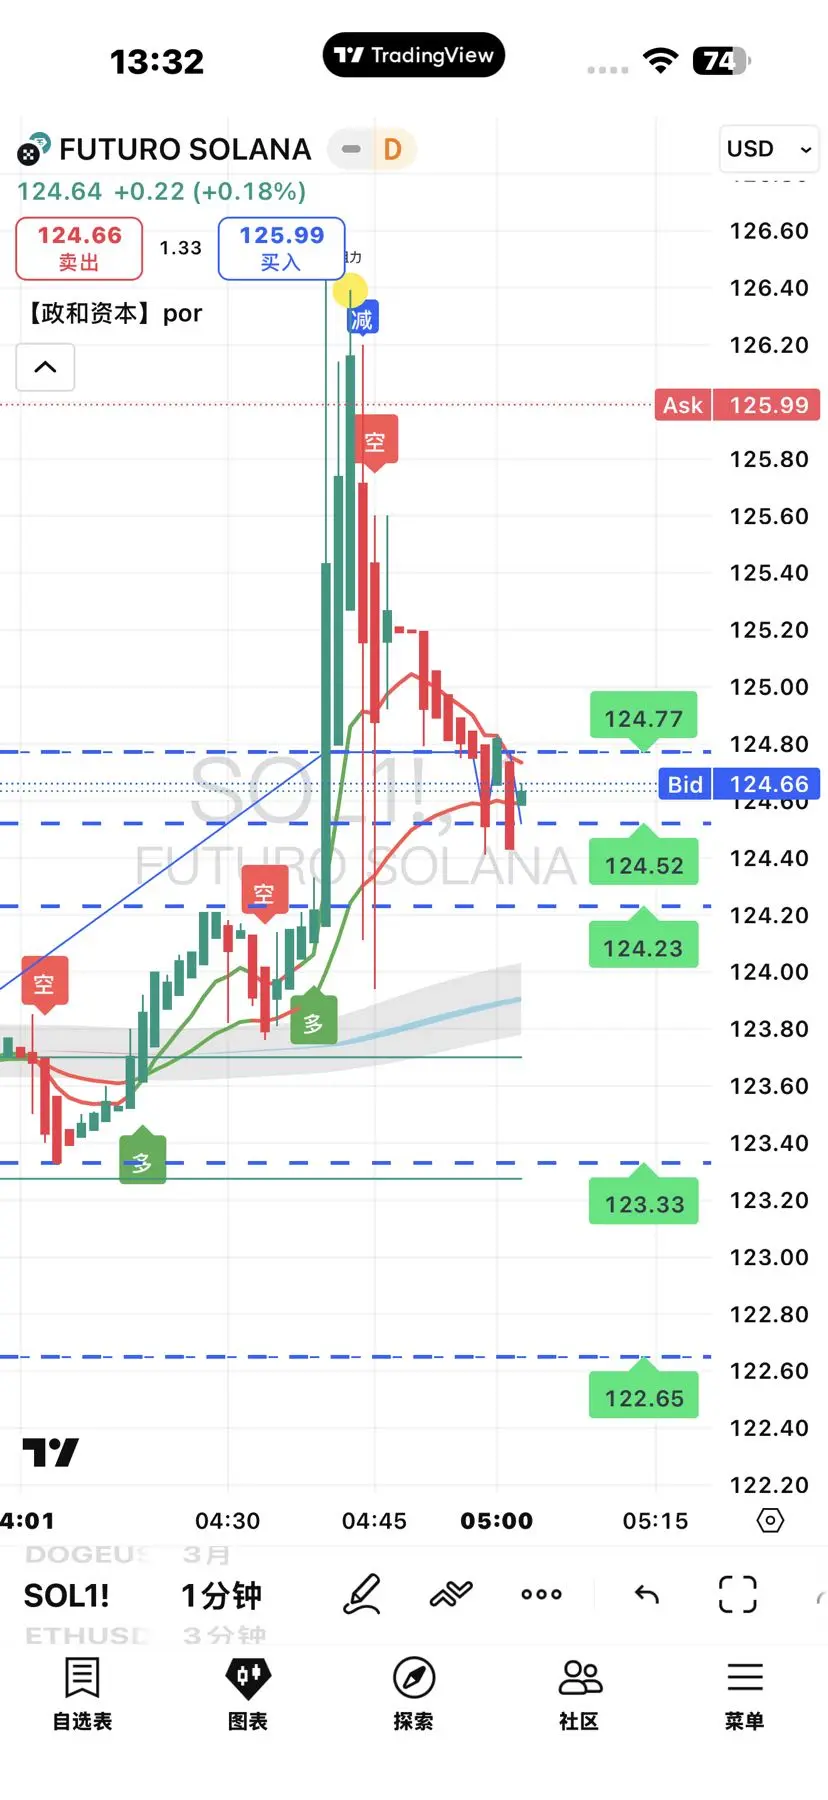
January 2nd SOL Technical Analysis (As of 12:00, current price approximately 126.2)
- Core judgment: Volatile with a slight bearish bias, double top + death cross resonance, insufficient volume, weak rebound
- Intraday range: 125.0-127.0; key resistance 127.0/127.5; key support 125.0/124.5
Key Patterns and Indicators
- 4-hour: Double top (126.9/126.8), MACD death cross, broke below EMA120, bearish dominance
- Daily chart: Two consecutive long upper shadows, heavy selling pressure near 127, MACD death cross, 7/30-day moving averages (126.1/125.8) will form a death cross
- Volume: No volume on r
SOL0,52%
- Reward
- 1
- Comment
- Repost
- Share
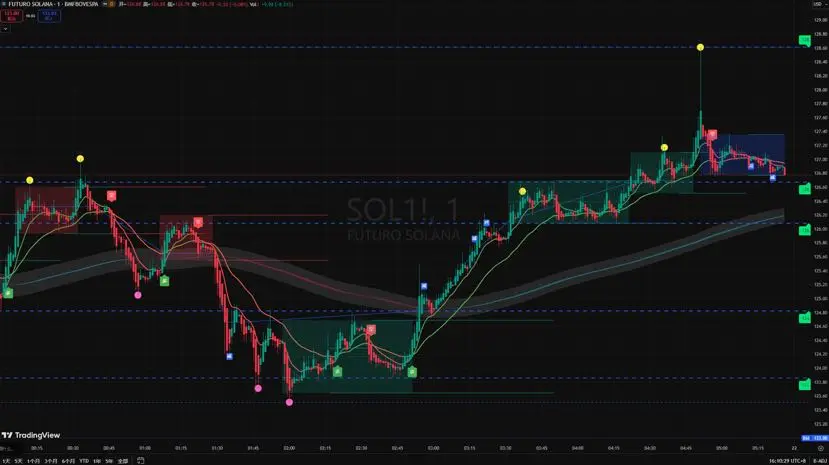
January 1st SOL Technical Analysis (As of 12:16, Price approximately 126.2 USD)
Core Judgment: Daily chart is slightly bearish + 4-hour consolidation + hourly weak bullish trend. During the holiday with low liquidity, focus on the 125.0–127.5 range for trading, with key levels at 127.0 and 125.0.
Key Price Levels (USD)
- Resistance: 127.0 (4-hour upper band) → 129.0 (psychological level + previous high) → 132.0 (medium-term resistance)
- Support: 125.0 (intraday weak support) → 123.5 (24H low) → 121.0 (medium-term moving average) → 118.8 (strong support)
Indicators and Patterns
- Daily: Facing
SOL0,52%
- Reward
- 2
- 6
- Repost
- Share
AkabaneRyuukou:
2026 Go Go Go 👊View More
As of 14:00 on December 31, 2025, SOL is experiencing short-term weak fluctuations with an unclear direction; the core range is $122–125. Before the annual line closes, trading will mainly be within the range and cautious, with strict position control.
Core Market (as of 14:00)
- Price: approximately $123.5, a slight 0.4% decline in 24H, with reduced volume and oscillation, liquidity is low at year-end
- Main trend: Daily chart is suppressed by EMA30, with a bearish moving average alignment, MACD shows a death cross, bearish dominance
- Rhythm: 4-hour MACD bearish bars are shortening, no golde
SOL0,52%
- Reward
- 2
- 4
- Repost
- Share
HaveYouEverDealtWithLizards? :
:
New Year Wealth Explosion 🤑View More
Summary of Conclusions: On December 30, SOL is experiencing short-term oscillation with a slight bearish bias, mainly focusing on rebound highs and support lows; key levels: 127.5 (break above turns bullish), 122.0 (break below turns bearish).
1. Core Price Levels (12/30 13:40, current price ≈124.5)
• Resistance: 126.0 (50EMA), 127.5 (100EMA/upper boundary of range), 130.0 (daily structure), 133.5 (200-day moving average)
• Support: 123.0 (lower boundary of range), 122.0 (strong support), 120.0 (key platform), 117.0 (previous low)
2. Technical Indicators (4h+1h)
• 4h: Price below EMA30/100, RS
SOL0,52%
- Reward
- 25
- 6
- Repost
- Share
赵赵翻仓无数倍 :
:
1View More
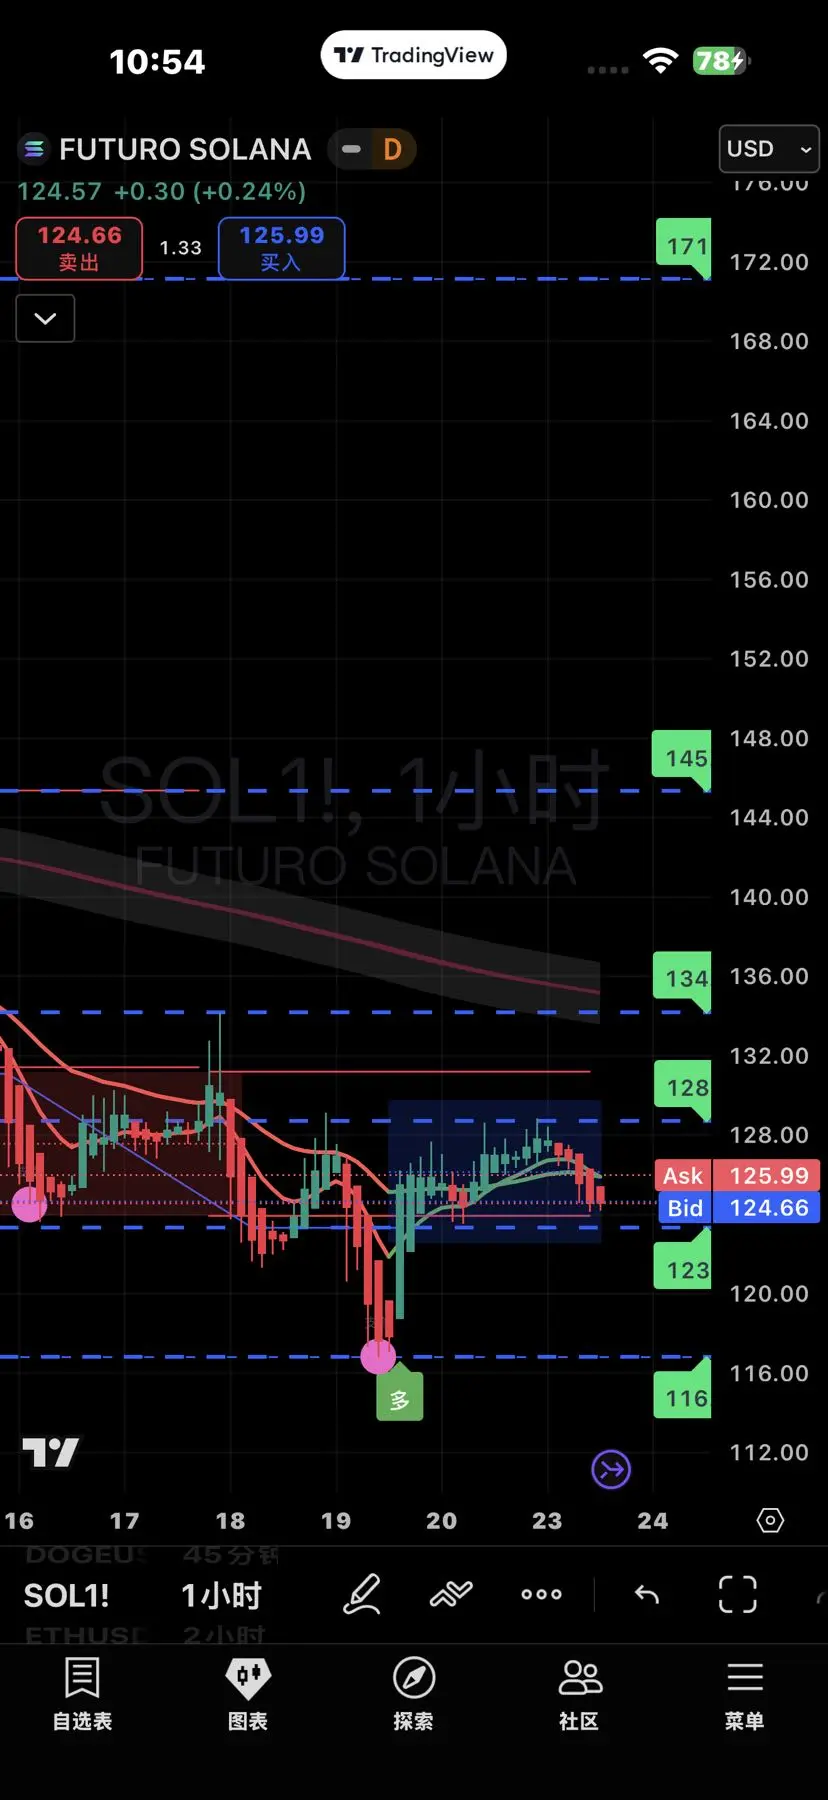
As of 2025-12-29 12:00 (UTC+8), SOL is currently trading around $128.5, with a slight intraday increase and low trading volume. The market shows a short-term weak rebound and a medium-term bearish pattern, awaiting a clear direction.
Key Indicator Overview
• Daily Chart: Price below the 20/50/100-day moving averages, with a bearish moving average alignment; MACD shows a death cross, indicating weak momentum; RSI around 46 (neutral to bearish); Bollinger Bands are narrowing, with low volatility.
• 4-Hour Chart: Short-term oversold rebound, MACD shows a golden cross at low levels, with bullish m
SOL0,52%
- Reward
- 3
- 2
- 1
- Share
GateUser-98ca4d8f:
Follow the host to enjoy some meat, let's go 💪 and get it startedView More
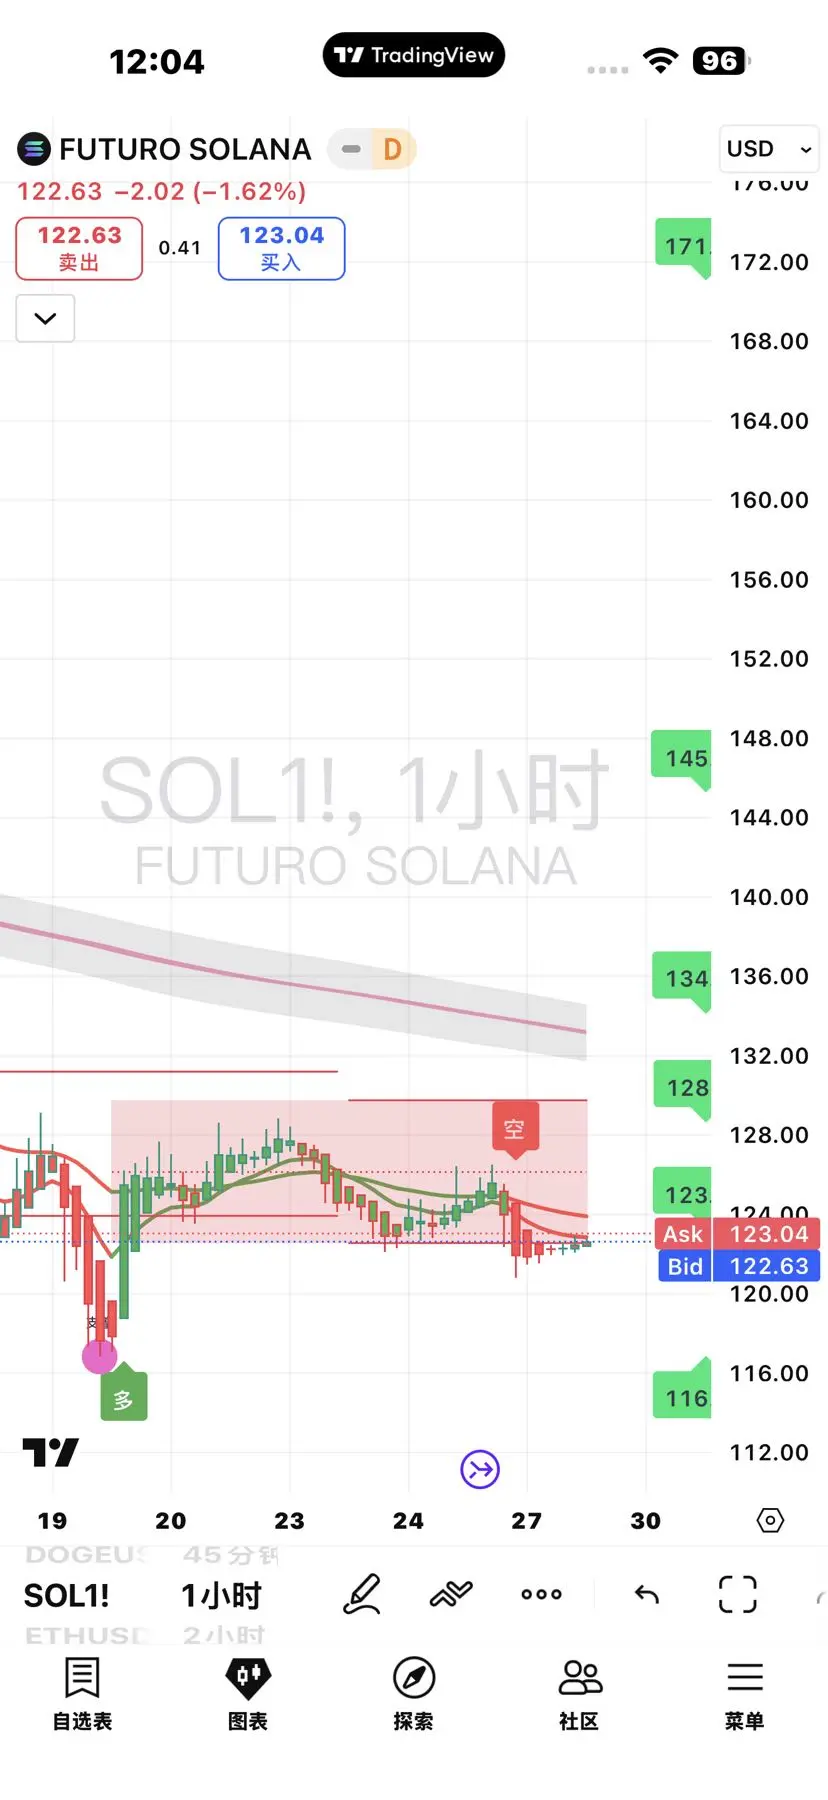
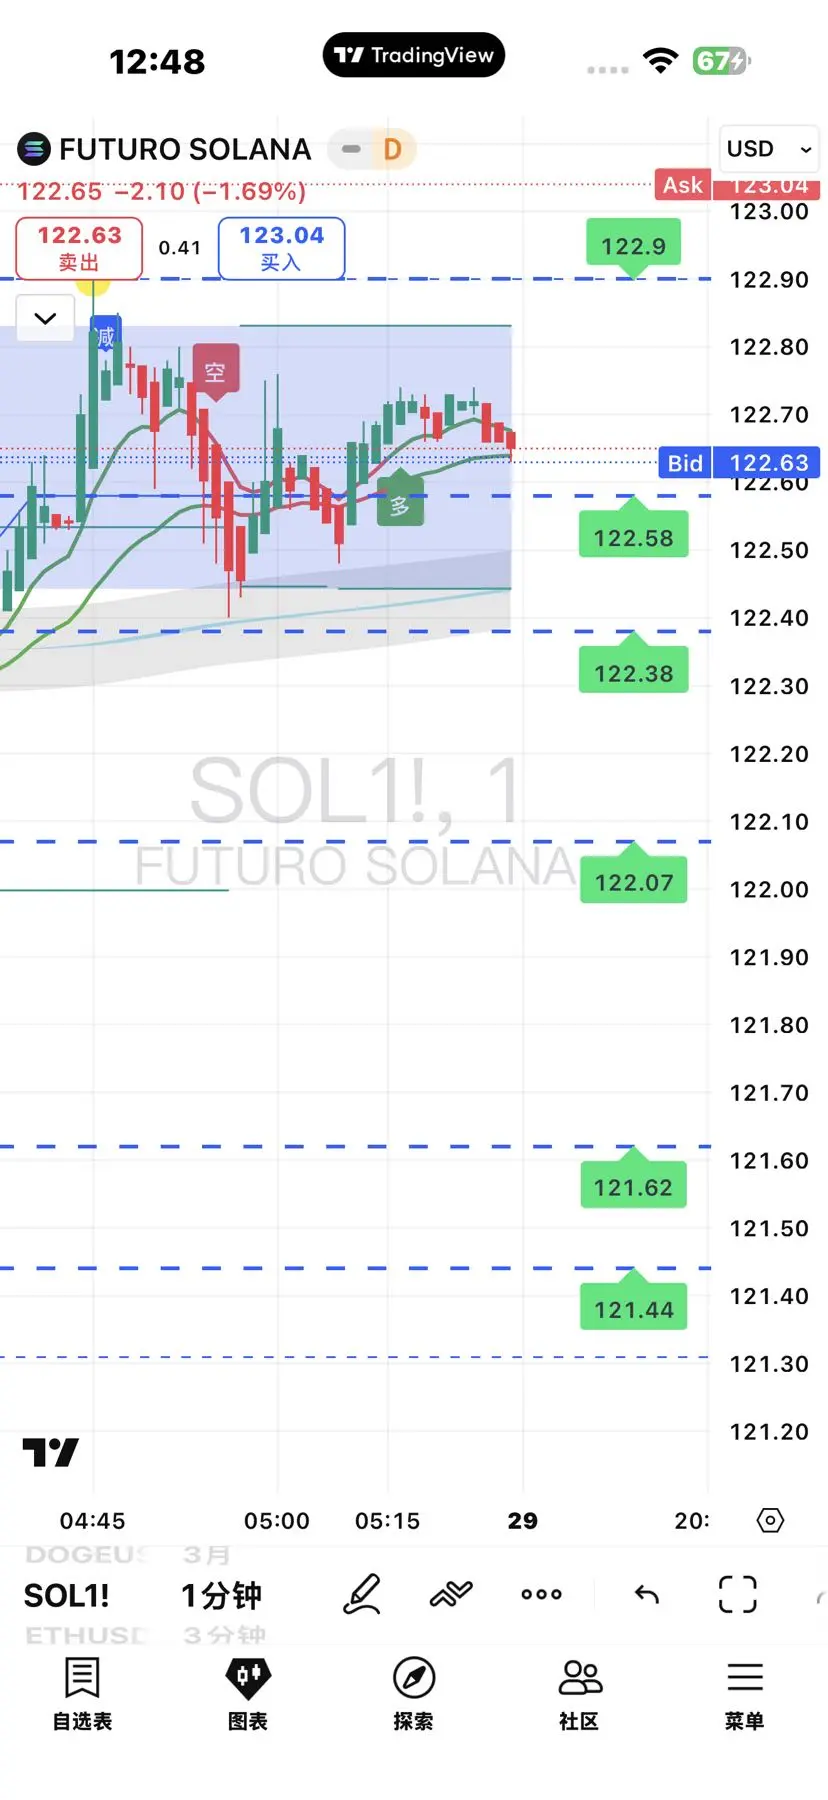
December 28th SOL Core Conclusion: Narrow fluctuation between $122.5 and $125.5, short-term bias slightly bearish, no strong trend, mainly trading within high risk-reward ratio zones. Total position strictly controlled at ≤30%, beware of low liquidity spikes and false breakouts over the weekend.
1. Key Price Levels (4H/Daily chart, as of 12:00 on December 28th)
• Support: 122.5 (4H strong support, tested multiple times), 121 (psychological/volume cluster), 120 (stop-loss level), 118 (strong support)
• Resistance: 124.8-125.5 (20-day moving average/rebound high), 127 (Fibonacci 61.8% retracemen
SOL0,52%
- Reward
- 2
- 1
- Repost
- Share
Hermann11:
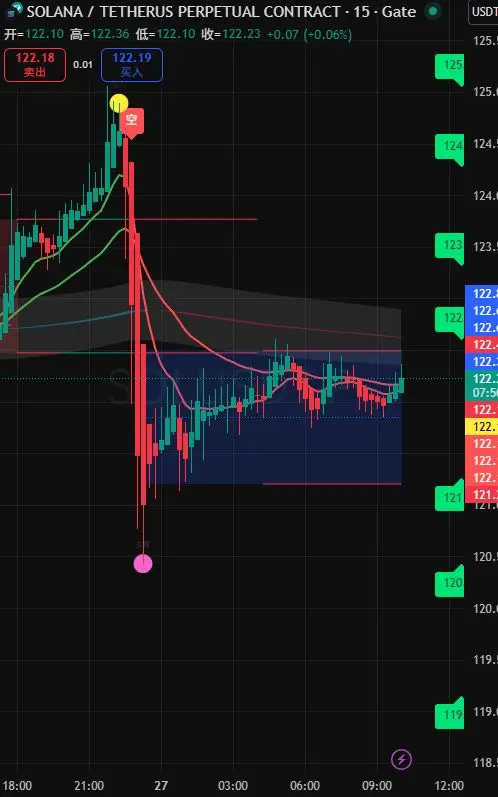
YesAs of December 27, 2025, 10:00 (UTC+8), SOL is quoted at approximately $123.3. The short-term movement is narrow-range and slightly weak, with a core range of $121-$126. Due to low holiday liquidity, the direction remains uncertain.
Key Views
• Trend: Hovering near the lower boundary of the 4H descending channel, with price under pressure below the 20-day moving average ( $130.2 ). ADX<25 indicates no strong trend, with -DI slightly stronger than +DI.
• Pattern: 4H shows a converging triangle, caution for a downward breakout; the weekly mid-term trend is bearish.
• Sentiment: Fear and Greed In
SOL0,52%
- Reward
- 2
- Comment
- 1
- Share
December 26th SOL Technical Analysis (11:00, China Time)
• Price Snapshot: approximately $123.3 USD, narrow fluctuations, low trading volume; volatility risk increases due to the expiration of Deribit approximately $28.5 billion BTC/ETH options.
• Key Levels: Resistance at 125.0-126.0, 128.0; Support at 122.0, 120.0; break below targets 118.0 (daily Bollinger Bands lower band).
• Patterns and Indicators: Daily EMA20/50 resistance; 4-hour downtrend channel (bearish); RSI≈42 neutral to weak; MACD bearish dominance; OBV declining; bullish momentum insufficient.
Actionable Strategies
• Short-term
SOL0,52%
- Reward
- 2
- 7
- Repost
- Share
Hermann11:
DYOR 🤓View More
December 25, 2025 SOL Christmas Technical Analysis (12:00, UTC+8)
• Current Price: around 123.2. During the Christmas holiday, liquidity is extremely low, with BTC/ETH moving in a narrow range. Contract deleveraging and concentrated chips increase the risk of sharp price movements.
• Core Judgment: Daily chart shows a slight bearish oscillation; 4H/2H lack clear direction. Focus on range-bound buying low and selling high, with total positions ≤30%. Switch to trend strategies only after a volume breakout.
🎯 Key Price Levels (USD, layered precision)
• Support: 122.0 (intraday strong support) →
SOL0,52%

- Reward
- 1
- Comment
- Repost
- Share
As of December 24th, 13:30, the current price of SOL is approximately 122.5 USD, the daily chart shows a weak oscillation dominated by short positions, with low liquidity during the Christmas holiday. The strategy focuses on high short positions, supplemented by low long positions, Light Position + strict stop loss.
Key price level
• Support: 120 (intraday) → 117 (4H) → 115 (strong support on daily chart) → 110 (extreme defense)
• Resistance: 125 (psychological) → 128-130 (20-day SMA) → 133 (midline of daily chart)
Indicator Overview
• daily chart: RSI 40.1 (neutral to weak), MACD negative zon
Key price level
• Support: 120 (intraday) → 117 (4H) → 115 (strong support on daily chart) → 110 (extreme defense)
• Resistance: 125 (psychological) → 128-130 (20-day SMA) → 133 (midline of daily chart)
Indicator Overview
• daily chart: RSI 40.1 (neutral to weak), MACD negative zon
SOL0,52%
- Reward
- 1
- Comment
- Repost
- Share
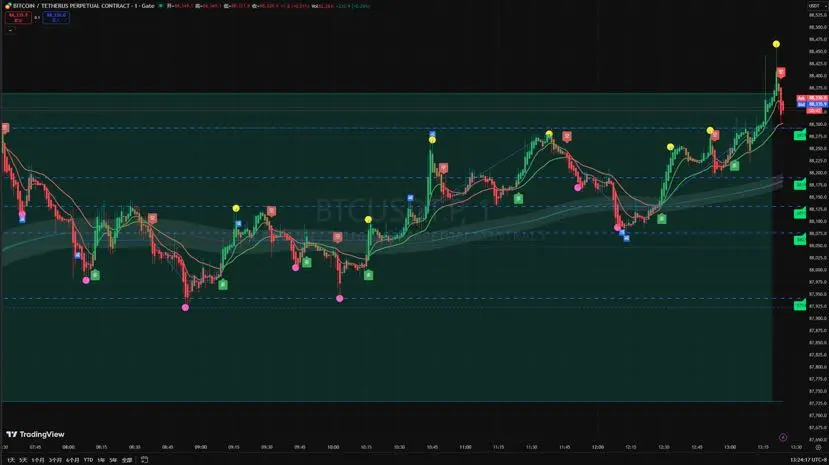
As of 2025-12-23 10:15#现货黄金再创新高 , BTC is currently reported at 87920 USD, with a 24h fluctuation between 87350-88580 USD, short-term bearish, waiting for a breakout.
Key Price Levels (Support/Resistance)
• Support: 87400 USD (24h low + short-term fluctuation lower edge) → If it breaks, look at 86000 USD (daily key support)
• Resistance: 88600 USD (24h high + 4h ago high) → A breakthrough looks toward 89500 USD (daily MA10)
• Boundary: 88000 USD, stabilize with a bullish bias, lose support with a bearish bias
Multi-Period Indicator Overview
• Daily: RSI≈39 (weak), MACD death cross continues, gr
BTC-2,16%
- Reward
- 1
- 1
- 1
- Share
GateUser-3030c9aa:
😀As of 2025-12-22 16:00 (UTC+8), SOL is currently priced at 125.10 USD, with a 24h fluctuation of 123.64-126.42 USD, showing weak oscillation. In the short-term, a rebound is expected but needs to break through for confirmation.
1. Key Price Levels (Support/Resistance)
• First support: 123.5 USD (24h low + recent fluctuation lower edge), if broken, look for second support at 120.0 USD (daily MA30)
• First resistance: 126.5 USD (24h high + previous high on hourly chart), breaking upwards looks at second resistance 129.0 USD (daily MA10)
• Key boundary: 125.0 USD, stabilizing bullish, losing grou
SOL0,52%
- Reward
- 1
- Comment
- Repost
- Share
As of 2025-12-20 13:00 (UTC+8), the current BTC price is approximately 87,200 USDT. The short-term trend is leaning towards a rebound correction, but the daily chart remains in a weak pattern, with bulls and bears focusing on key support and resistance levels.
Core Technical Aspects
• Daily Chart: Bearish arrangement, MACD death cross, green bars not shrinking; RSI≈36, entering oversold territory, selling pressure may ease but the trend remains unchanged.
• Hourly Chart: RSI has exited oversold (≈54), MACD green bars are shrinking, a golden cross is expected, indicating short-term rebound mome
BTC-2,16%
- Reward
- 1
- Comment
- Repost
- Share
As of 11:50 on December 18 (UTC+8), SOL is approximately $127.8. The daily chart is dominated by a bearish trend, with weak rebounds during the 4-hour oversold condition. Overall, the market is oscillating weakly, linked to BTC, mainly shorting on rebounds and lightly trying long positions at low levels.
Core Price Levels and Key Multi-Period Support/Resistance
• Daily: Support at 123/121 (strong support); Resistance at 131/135-137 (strong resistance)
• 4-Hour: Support at 126/123; Resistance at 130-131/134.5
• 2-Hour: Support at 127; Resistance at 129-130. Bollinger Bands are converging, incre
Core Price Levels and Key Multi-Period Support/Resistance
• Daily: Support at 123/121 (strong support); Resistance at 131/135-137 (strong resistance)
• 4-Hour: Support at 126/123; Resistance at 130-131/134.5
• 2-Hour: Support at 127; Resistance at 129-130. Bollinger Bands are converging, incre
SOL0,52%
- Reward
- 2
- Comment
- Repost
- Share
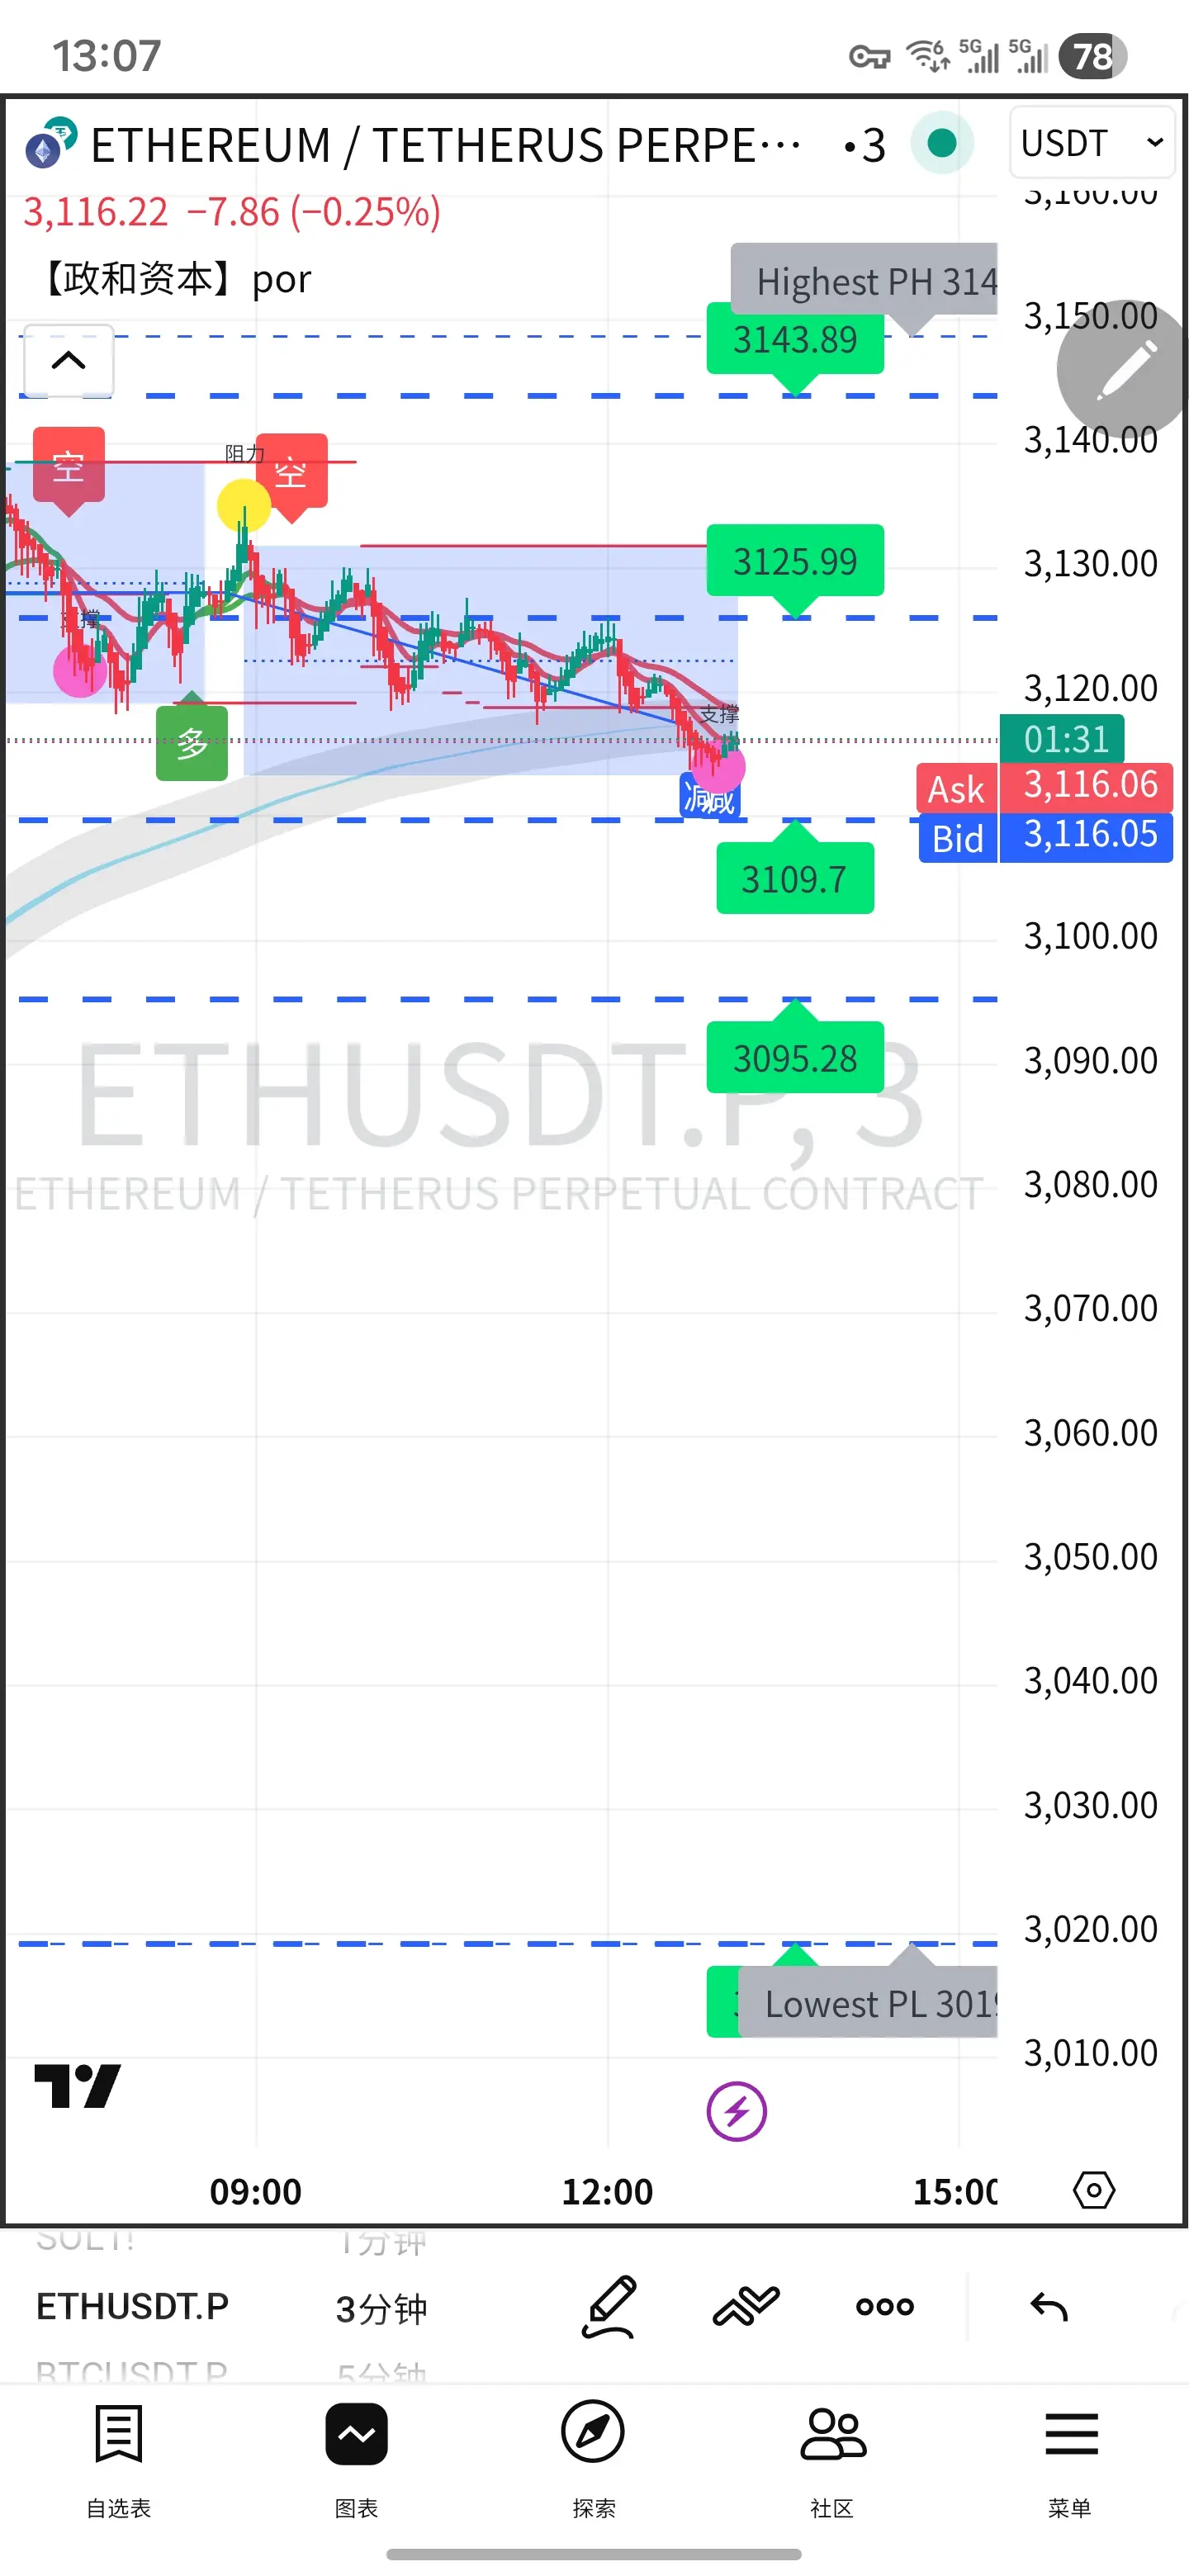
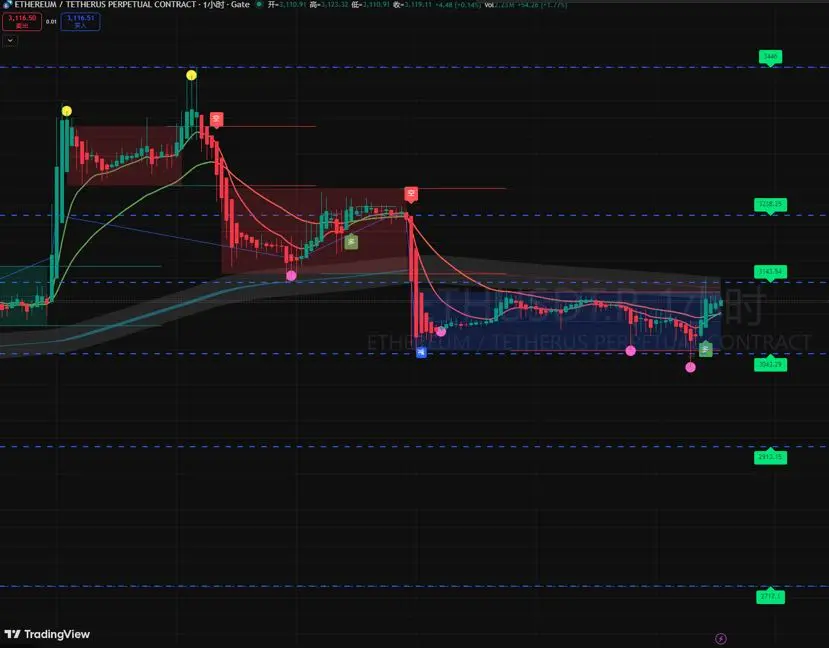
In December 15, 2025, ETH overall shows a weak oscillation trend, but there is a certain rebound demand. The key levels and operational reference points under different cycles are as follows. The content is for reference only and does not constitute investment advice:
1. Key Resistance Levels: The intraday core resistance focuses on $3130 - $3158, with further resistance at $3170; if broken, attention can be given to the $3200 - $3250 range, and longer-term resistance can be noted at $3310 - $3317. Among them, $3130 is a key resistance to watch closely during the day, and $3170 is a clearly de
1. Key Resistance Levels: The intraday core resistance focuses on $3130 - $3158, with further resistance at $3170; if broken, attention can be given to the $3200 - $3250 range, and longer-term resistance can be noted at $3310 - $3317. Among them, $3130 is a key resistance to watch closely during the day, and $3170 is a clearly de
ETH0,61%
- Reward
- 1
- Comment
- Repost
- Share