
#CryptoMarketRecovery
#CryptoMarketRecovery
1. Market Overview — What Is Happening Right Now
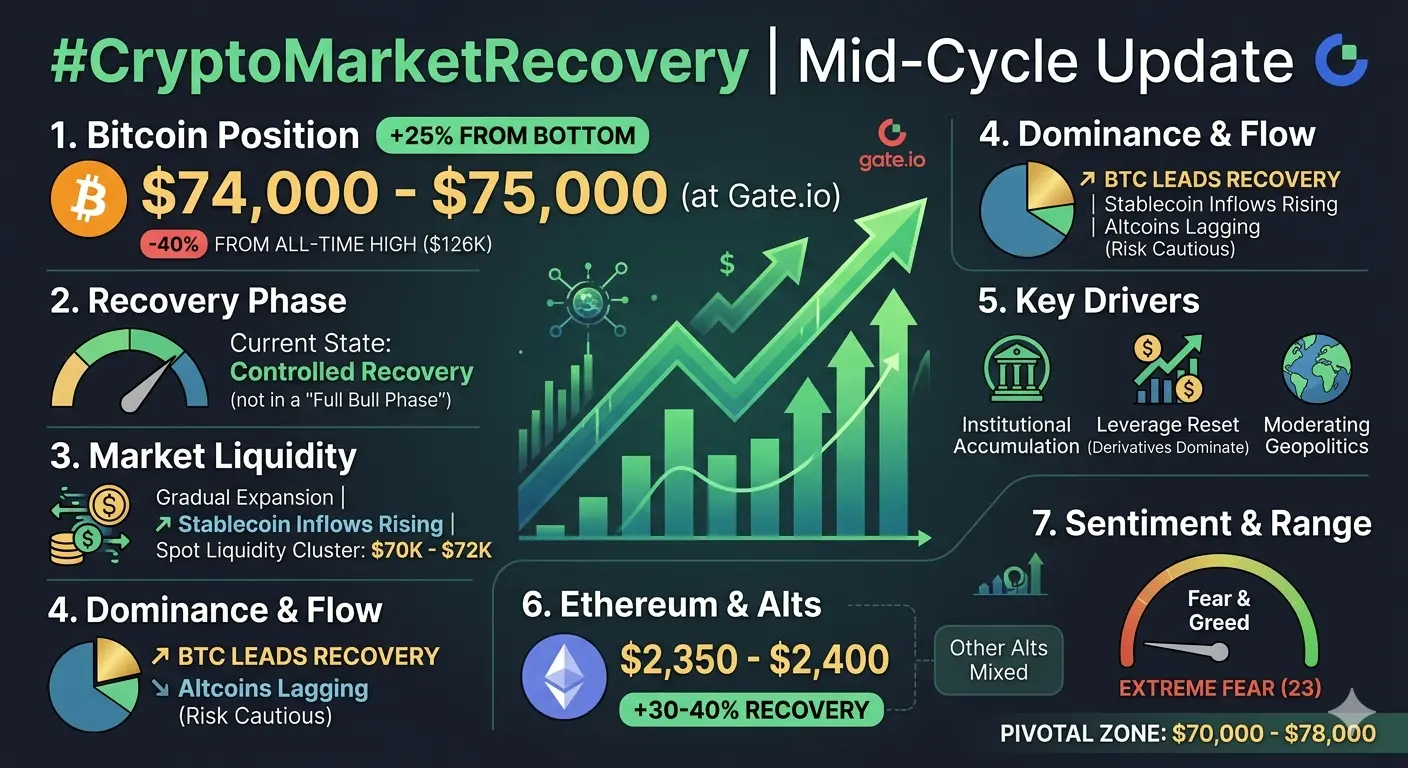
The cryptocurrency market is currently undergoing a mid-cycle recovery phase following a significant macro-driven correction that reshaped global risk appetite across digital assets. Bitcoin, which previously experienced a deep liquidation phase that dragged prices down toward approximately $60,000 in February 2026, has now recovered and is trading in the $74,000 to $75,000 range on Gate.io. This recovery represents an approximate gain of 24% to 25% from the cycle bottom, indicating that buyers have gradually returned to the market after excessive leverage was flushed out.
However, despite this recovery, the broader structure still reflects a market that is approximately 40% below its all-time high of $126,000. This positioning clearly confirms that the current environment is not a full bullish continuation phase but rather a controlled recovery stage where liquidity is rebuilding, confidence is returning slowly, and institutional participation is shaping directional stability rather than explosive expansion.
2. Bitcoin Market Structure — Full Cycle Mapping
Bitcoin’s current cycle structure reflects a complete expansion-to-correction-to-recovery sequence that is typical of high-volatility macro assets. The cycle peak was formed in October 2025 at approximately $126,000, after which the market entered a structured breakdown phase that moved progressively through $110,000, then $90,000, and eventually into the $70,000 region as liquidity conditions tightened and leveraged positions were systematically unwound.
The final capitulation phase occurred in February 2026 when Bitcoin printed a cycle bottom near $60,000. Following this low, the market transitioned into a recovery phase where early stabilization began around $66,000 to $67,000, representing an initial rebound of roughly 10%. As accumulation strengthened, Bitcoin established a broader equilibrium zone between $69,000 and $71,000, reflecting a 15% to 18% recovery structure. The next major expansion impulse pushed the market above $76,000, marking a recovery of approximately 27% from the bottom, while the current trading zone around $74,000 to $75,000 indicates a sustained but still incomplete recovery cycle.
This structure confirms that Bitcoin is no longer in panic or liquidation mode but has also not yet entered a confirmed expansion-driven bull phase.
3. Liquidity Conditions — Market Capital Flow Dynamics
Liquidity in the current market is transitioning from compression to gradual expansion rather than entering a rapid inflow cycle. Stablecoin inflows across the ecosystem have begun to rise steadily, indicating that sidelined capital is slowly re-entering risk exposure. At the same time, exchange outflows suggest that long-term participants are continuing to accumulate and store assets off-exchange, which is typically a sign of confidence in medium-term price stability.
Within the $70,000 to $75,000 range, spot liquidity has improved significantly, creating a stabilizing price corridor where buyers and sellers are more balanced. Beneath the $72,000 level, buy-side liquidity clusters are forming, suggesting that the market has developed a defensive accumulation base. Above $75,000 to $80,000, however, sell-side pressure remains present, indicating that profit-taking activity will likely increase if price approaches upper resistance zones.
Overall, liquidity is not yet in an expansionary phase capable of producing parabolic price movement, but it is strong enough to support a slow and controlled upward recovery structure.
4. Volume Behavior — Participation Quality Analysis
Volume behavior across the current cycle reflects a healthy but cautious participation environment. The highest volume activity was observed during the liquidation phase when Bitcoin collapsed from $80,000 toward $60,000, indicating forced deleveraging and panic-driven exits from the market. Since the recovery began, volume has returned in a more stable and measured form, without signs of excessive speculative acceleration.
Importantly, there has been no appearance of blow-off volume spikes, which confirms that the market is not currently in an overheated speculative cycle. Instead, derivatives markets continue to dominate trading activity, which suggests that professional and institutional participants still control directional flow more than retail-driven momentum.
This type of volume structure typically aligns with accumulation phases rather than distribution or euphoric expansion cycles.
5. Capital Flow Rotation — BTC-Led Recovery Structure
The broader crypto market capitalization has recovered approximately 20% to 30% from its cycle lows, reflecting a gradual return of capital after aggressive outflows during the correction phase. However, this recovery has not been evenly distributed across all assets. Bitcoin dominance remains structurally strong, indicating that capital is concentrating first in Bitcoin before rotating into higher-risk altcoins.
This confirms a BTC-led recovery environment, where Bitcoin acts as the primary liquidity magnet while altcoins remain in a lagging recovery structure. Historically, such phases occur before broader market expansion cycles but require sustained liquidity inflows before full altseason conditions emerge.
6. Core Drivers Behind Recovery
The recovery in Bitcoin and the broader crypto market is being driven by multiple structural forces rather than a single catalyst. Liquidity stabilization is one of the primary drivers, as stablecoin inflows and reduced exchange reserves indicate that capital is gradually returning to the system.
Institutional accumulation has also played a key role, particularly through structured exposure and long-term positioning strategies that continued even during the market downturn. This behavior has created a strong price foundation in the $60,000 to $70,000 region, preventing deeper structural breakdowns.
Additionally, geopolitical uncertainty has shown signs of moderation, which has improved overall risk sentiment across global markets. The derivatives market has also undergone a significant leverage reset, removing excess speculative positioning and reducing the likelihood of cascading liquidation events. On-chain data further supports the recovery narrative, with a large portion of Bitcoin supply remaining dormant for extended periods, indicating that long-term holders are not participating in sell pressure.
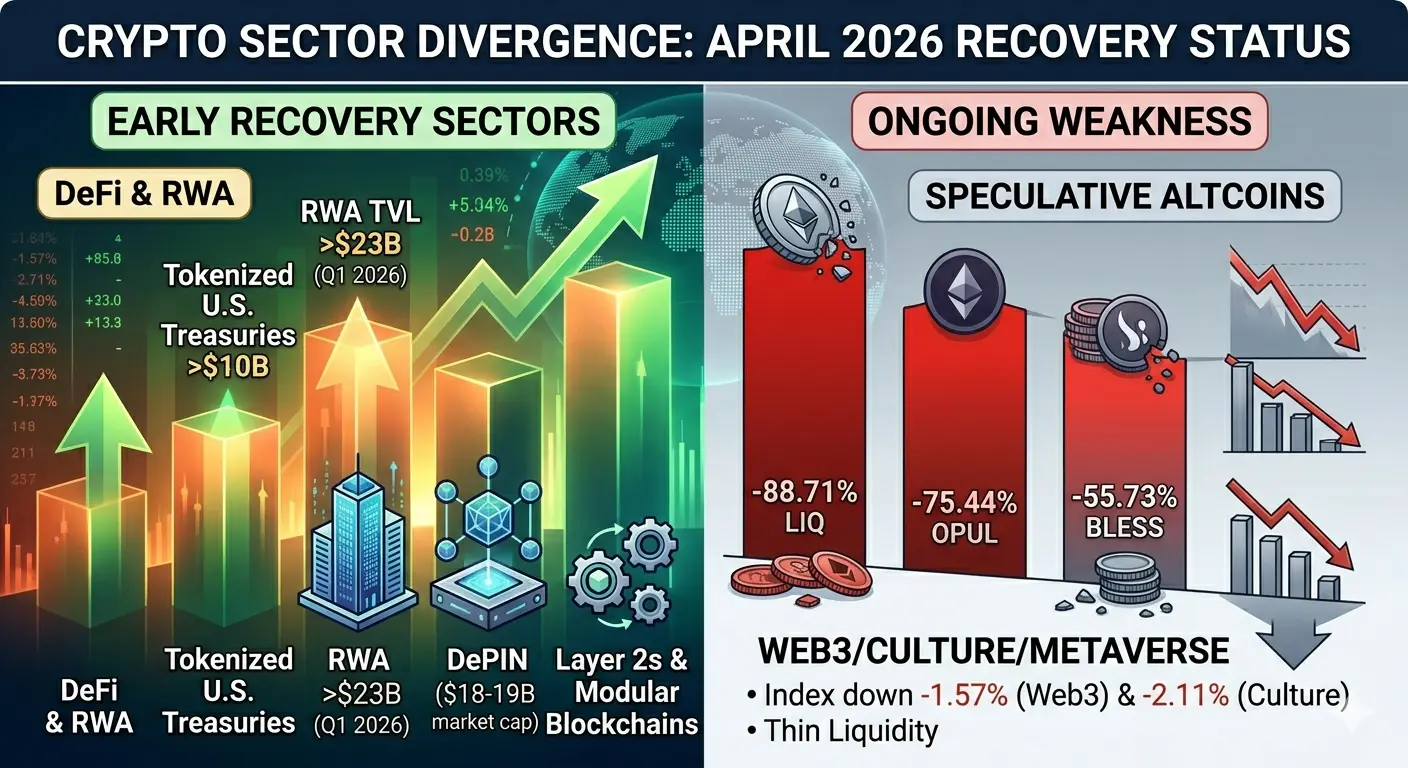
7. Ethereum and Altcoin Structure
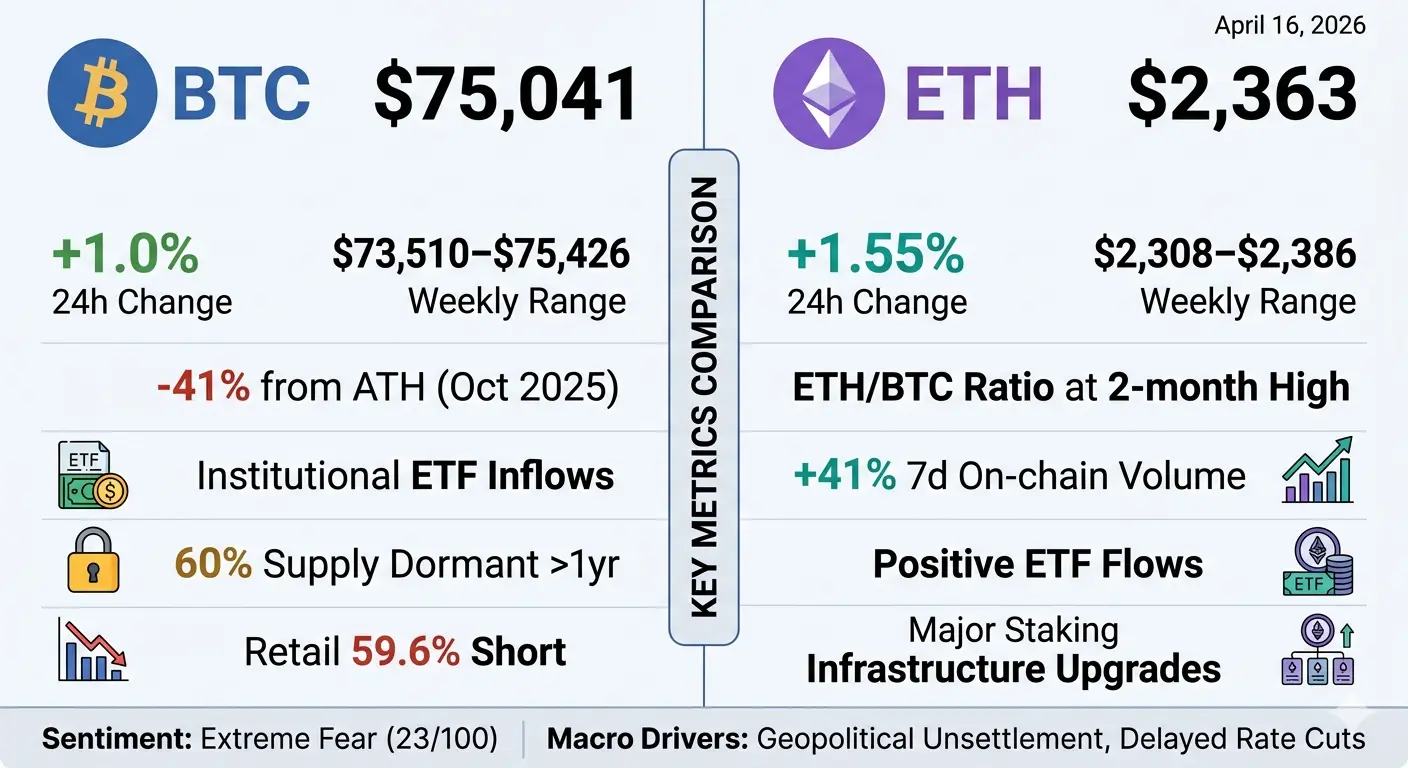
Ethereum has demonstrated a stronger percentage recovery from its lows compared to many mid-cap assets, rising from approximately $1,500–$1,800 to around $2,350–$2,400. This represents a recovery of roughly 30% to 40%, although Ethereum continues to underperform Bitcoin structurally in terms of dominance and leadership.
Altcoins overall remain in a mixed recovery state. Large-cap assets are showing relative strength, while mid-cap and small-cap assets continue to struggle with liquidity constraints and weaker capital inflows. This confirms that the market is still in an early recovery phase where risk appetite has not yet fully expanded beyond core assets.
8. Market Sentiment — Psychological Structure
Market sentiment remains firmly within the Extreme Fear zone, with readings around 23 on the Fear and Greed Index. Retail participation is cautious and inconsistent, reflecting uncertainty about whether the recovery is sustainable or temporary. Institutional participants, however, are gradually increasing exposure, while traders remain divided between continuation expectations and macro-driven caution.
Historically, Extreme Fear conditions often correspond with accumulation phases rather than distribution phases, particularly when supported by improving liquidity conditions and stabilizing price structure.
9. Key Market Levels — Gate.io Reference
Bitcoin maintains strong structural support between $70,000 and $72,000, with mid-range resistance forming around $75,000 to $76,500. A confirmed breakout above $80,000 on a sustained weekly close would signal a transition toward a more aggressive expansion phase. Conversely, a breakdown below $69,000 would indicate weakening accumulation strength and a potential return to deeper liquidity zones.
Ethereum holds support around $2,200, with resistance forming near $2,400 and a broader breakout structure between $2,600 and $2,800.
10. Market Scenarios — Probabilistic Structure
In a bullish continuation scenario, sustained ETF inflows and liquidity expansion could push Bitcoin toward the $85,000 to $100,000 range, confirming a new expansion phase. In a neutral scenario, the market is likely to remain range-bound between $70,000 and $78,000, consolidating gains and building structural strength for future movement. In a bearish scenario, rejection at resistance levels could lead to a retest of the $65,000 to $69,000 liquidity zone before stabilization resumes.
11. Macro Environment — External Pressure System
Global macro conditions remain in a transitional phase. Interest rates are still elevated, although expectations of future easing cycles are gradually forming. The US dollar is showing signs of stabilization rather than aggressive strength, while risk assets are slowly regaining capital inflows. However, the macro environment is not yet fully supportive of aggressive expansion cycles, which limits upside acceleration in crypto markets for now.
12. Structural Market Conclusion
The current crypto market environment represents a controlled recovery phase characterized by rebuilding liquidity, gradual institutional accumulation, and stabilizing macro conditions. Price action is moving upward in a structured manner, volume remains stable without speculative overheating, and liquidity is slowly returning to the system.
Bitcoin has recovered approximately 25% from its cycle low but remains significantly below its all-time high, placing the market in a critical transitional zone where the next major move will likely determine whether a broader expansion phase begins or whether consolidation continues.
Above $80,000, the market structure shifts toward bullish expansion dynamics. Below $70,000, deeper correction risks re-emerge. The current range therefore represents a pivotal accumulation and decision-making zone for the next macro cycle phase.
13. Risk Framework
Despite improving structure, the market remains highly sensitive to external shocks. Geopolitical events, sudden liquidity shifts, or rapid changes in institutional flow can quickly alter market direction. ETF inflows and macro conditions remain key variables that can either reinforce recovery or trigger renewed volatility. As a result, disciplined risk management and position sizing remain essential in the current environment.
#CryptoMarketRecovery
1. Market Overview — What Is Happening Right Now
The cryptocurrency market is currently undergoing a mid-cycle recovery phase following a significant macro-driven correction that reshaped global risk appetite across digital assets. Bitcoin, which previously experienced a deep liquidation phase that dragged prices down toward approximately $60,000 in February 2026, has now recovered and is trading in the $74,000 to $75,000 range on Gate.io. This recovery represents an approximate gain of 24% to 25% from the cycle bottom, indicating that buyers have gradually returned to the market after excessive leverage was flushed out.
However, despite this recovery, the broader structure still reflects a market that is approximately 40% below its all-time high of $126,000. This positioning clearly confirms that the current environment is not a full bullish continuation phase but rather a controlled recovery stage where liquidity is rebuilding, confidence is returning slowly, and institutional participation is shaping directional stability rather than explosive expansion.
2. Bitcoin Market Structure — Full Cycle Mapping
Bitcoin’s current cycle structure reflects a complete expansion-to-correction-to-recovery sequence that is typical of high-volatility macro assets. The cycle peak was formed in October 2025 at approximately $126,000, after which the market entered a structured breakdown phase that moved progressively through $110,000, then $90,000, and eventually into the $70,000 region as liquidity conditions tightened and leveraged positions were systematically unwound.
The final capitulation phase occurred in February 2026 when Bitcoin printed a cycle bottom near $60,000. Following this low, the market transitioned into a recovery phase where early stabilization began around $66,000 to $67,000, representing an initial rebound of roughly 10%. As accumulation strengthened, Bitcoin established a broader equilibrium zone between $69,000 and $71,000, reflecting a 15% to 18% recovery structure. The next major expansion impulse pushed the market above $76,000, marking a recovery of approximately 27% from the bottom, while the current trading zone around $74,000 to $75,000 indicates a sustained but still incomplete recovery cycle.
This structure confirms that Bitcoin is no longer in panic or liquidation mode but has also not yet entered a confirmed expansion-driven bull phase.
3. Liquidity Conditions — Market Capital Flow Dynamics
Liquidity in the current market is transitioning from compression to gradual expansion rather than entering a rapid inflow cycle. Stablecoin inflows across the ecosystem have begun to rise steadily, indicating that sidelined capital is slowly re-entering risk exposure. At the same time, exchange outflows suggest that long-term participants are continuing to accumulate and store assets off-exchange, which is typically a sign of confidence in medium-term price stability.
Within the $70,000 to $75,000 range, spot liquidity has improved significantly, creating a stabilizing price corridor where buyers and sellers are more balanced. Beneath the $72,000 level, buy-side liquidity clusters are forming, suggesting that the market has developed a defensive accumulation base. Above $75,000 to $80,000, however, sell-side pressure remains present, indicating that profit-taking activity will likely increase if price approaches upper resistance zones.
Overall, liquidity is not yet in an expansionary phase capable of producing parabolic price movement, but it is strong enough to support a slow and controlled upward recovery structure.
4. Volume Behavior — Participation Quality Analysis
Volume behavior across the current cycle reflects a healthy but cautious participation environment. The highest volume activity was observed during the liquidation phase when Bitcoin collapsed from $80,000 toward $60,000, indicating forced deleveraging and panic-driven exits from the market. Since the recovery began, volume has returned in a more stable and measured form, without signs of excessive speculative acceleration.
Importantly, there has been no appearance of blow-off volume spikes, which confirms that the market is not currently in an overheated speculative cycle. Instead, derivatives markets continue to dominate trading activity, which suggests that professional and institutional participants still control directional flow more than retail-driven momentum.
This type of volume structure typically aligns with accumulation phases rather than distribution or euphoric expansion cycles.
5. Capital Flow Rotation — BTC-Led Recovery Structure
The broader crypto market capitalization has recovered approximately 20% to 30% from its cycle lows, reflecting a gradual return of capital after aggressive outflows during the correction phase. However, this recovery has not been evenly distributed across all assets. Bitcoin dominance remains structurally strong, indicating that capital is concentrating first in Bitcoin before rotating into higher-risk altcoins.
This confirms a BTC-led recovery environment, where Bitcoin acts as the primary liquidity magnet while altcoins remain in a lagging recovery structure. Historically, such phases occur before broader market expansion cycles but require sustained liquidity inflows before full altseason conditions emerge.
6. Core Drivers Behind Recovery
The recovery in Bitcoin and the broader crypto market is being driven by multiple structural forces rather than a single catalyst. Liquidity stabilization is one of the primary drivers, as stablecoin inflows and reduced exchange reserves indicate that capital is gradually returning to the system.
Institutional accumulation has also played a key role, particularly through structured exposure and long-term positioning strategies that continued even during the market downturn. This behavior has created a strong price foundation in the $60,000 to $70,000 region, preventing deeper structural breakdowns.
Additionally, geopolitical uncertainty has shown signs of moderation, which has improved overall risk sentiment across global markets. The derivatives market has also undergone a significant leverage reset, removing excess speculative positioning and reducing the likelihood of cascading liquidation events. On-chain data further supports the recovery narrative, with a large portion of Bitcoin supply remaining dormant for extended periods, indicating that long-term holders are not participating in sell pressure.
7. Ethereum and Altcoin Structure
Ethereum has demonstrated a stronger percentage recovery from its lows compared to many mid-cap assets, rising from approximately $1,500–$1,800 to around $2,350–$2,400. This represents a recovery of roughly 30% to 40%, although Ethereum continues to underperform Bitcoin structurally in terms of dominance and leadership.
Altcoins overall remain in a mixed recovery state. Large-cap assets are showing relative strength, while mid-cap and small-cap assets continue to struggle with liquidity constraints and weaker capital inflows. This confirms that the market is still in an early recovery phase where risk appetite has not yet fully expanded beyond core assets.
8. Market Sentiment — Psychological Structure
Market sentiment remains firmly within the Extreme Fear zone, with readings around 23 on the Fear and Greed Index. Retail participation is cautious and inconsistent, reflecting uncertainty about whether the recovery is sustainable or temporary. Institutional participants, however, are gradually increasing exposure, while traders remain divided between continuation expectations and macro-driven caution.
Historically, Extreme Fear conditions often correspond with accumulation phases rather than distribution phases, particularly when supported by improving liquidity conditions and stabilizing price structure.
9. Key Market Levels — Gate.io Reference
Bitcoin maintains strong structural support between $70,000 and $72,000, with mid-range resistance forming around $75,000 to $76,500. A confirmed breakout above $80,000 on a sustained weekly close would signal a transition toward a more aggressive expansion phase. Conversely, a breakdown below $69,000 would indicate weakening accumulation strength and a potential return to deeper liquidity zones.
Ethereum holds support around $2,200, with resistance forming near $2,400 and a broader breakout structure between $2,600 and $2,800.
10. Market Scenarios — Probabilistic Structure
In a bullish continuation scenario, sustained ETF inflows and liquidity expansion could push Bitcoin toward the $85,000 to $100,000 range, confirming a new expansion phase. In a neutral scenario, the market is likely to remain range-bound between $70,000 and $78,000, consolidating gains and building structural strength for future movement. In a bearish scenario, rejection at resistance levels could lead to a retest of the $65,000 to $69,000 liquidity zone before stabilization resumes.
11. Macro Environment — External Pressure System
Global macro conditions remain in a transitional phase. Interest rates are still elevated, although expectations of future easing cycles are gradually forming. The US dollar is showing signs of stabilization rather than aggressive strength, while risk assets are slowly regaining capital inflows. However, the macro environment is not yet fully supportive of aggressive expansion cycles, which limits upside acceleration in crypto markets for now.
12. Structural Market Conclusion
The current crypto market environment represents a controlled recovery phase characterized by rebuilding liquidity, gradual institutional accumulation, and stabilizing macro conditions. Price action is moving upward in a structured manner, volume remains stable without speculative overheating, and liquidity is slowly returning to the system.
Bitcoin has recovered approximately 25% from its cycle low but remains significantly below its all-time high, placing the market in a critical transitional zone where the next major move will likely determine whether a broader expansion phase begins or whether consolidation continues.
Above $80,000, the market structure shifts toward bullish expansion dynamics. Below $70,000, deeper correction risks re-emerge. The current range therefore represents a pivotal accumulation and decision-making zone for the next macro cycle phase.
13. Risk Framework
Despite improving structure, the market remains highly sensitive to external shocks. Geopolitical events, sudden liquidity shifts, or rapid changes in institutional flow can quickly alter market direction. ETF inflows and macro conditions remain key variables that can either reinforce recovery or trigger renewed volatility. As a result, disciplined risk management and position sizing remain essential in the current environment.