This article will comprehensively review the data changes of Bitcoin this year in four major aspects: trading market, on-chain fundamentals, mining and applicability.
Written by Carol, PANews
“Repair” and “rebirth” are the two key words of Bitcoin in 2023. On the one hand, against the background of the Federal Reserve’s continuous interest rate hikes, global fiscal policy tightening, and geopolitical tensions, Bitcoin has reversed last year’s decline and entered a steady upward path; on the other hand, with the rapid development of the Ordinals protocol, BRC- 20 Inscriptions are booming in the market, bringing new vitality to the Bitcoin ecosystem and the entire industry.
Behind this picture, what will be the micro-development of Bitcoin in 2023? What developments can we look forward to next year? PAData comprehensively reviewed the data changes of Bitcoin this year in four major aspects: trading market, on-chain fundamentals, mining and applicability.
TLDR;
market place
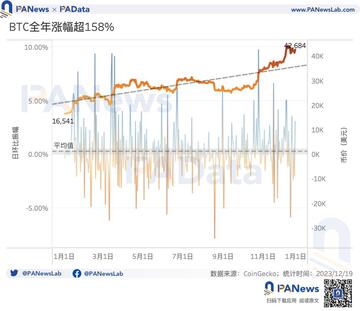
- In 2023, Bitcoin has basically completed the repair of last year’s decline. The currency price has risen to more than 42,000 US dollars, with an annual increase of 158.06%. The annual upward trend is very clear and highly sustainable.
- Historical data shows that production cuts and currency price increases usually occur at the same time. Bitcoin will usher in its fourth production cut on April 19 next year, and is expected to continue its upward trend next year.
- 87.76% of the chips are in profit, and the profit level of long-term holders is higher than that of short-term holders. The overall profitability of Bitcoin this year is much better than last year.
- Bitcoin’s price changes this year have shown little statistical correlation with the Dow Jones Industrial Average and the U.S. Dollar Index overall. However, during certain periods of time, Bitcoin has a certain positive correlation with the Dow Jones Industrial Index and a certain negative correlation with the U.S. Dollar Index.
On-chain fundamentals
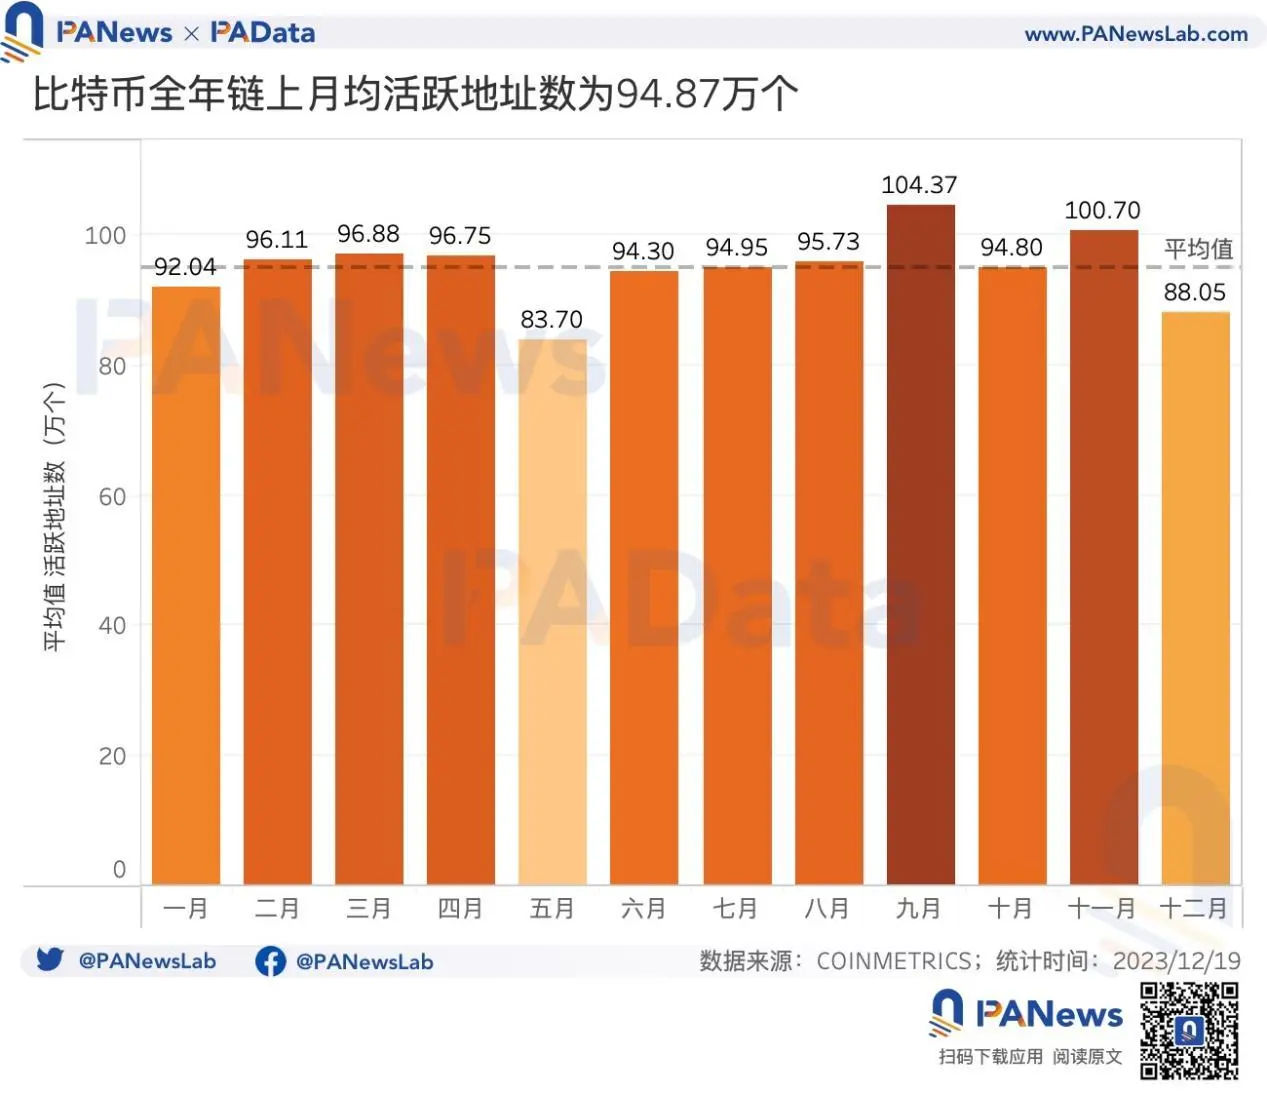
- The average number of monthly active addresses on the chain this year is approximately 948,700, a slight increase of 3.51% from last year.
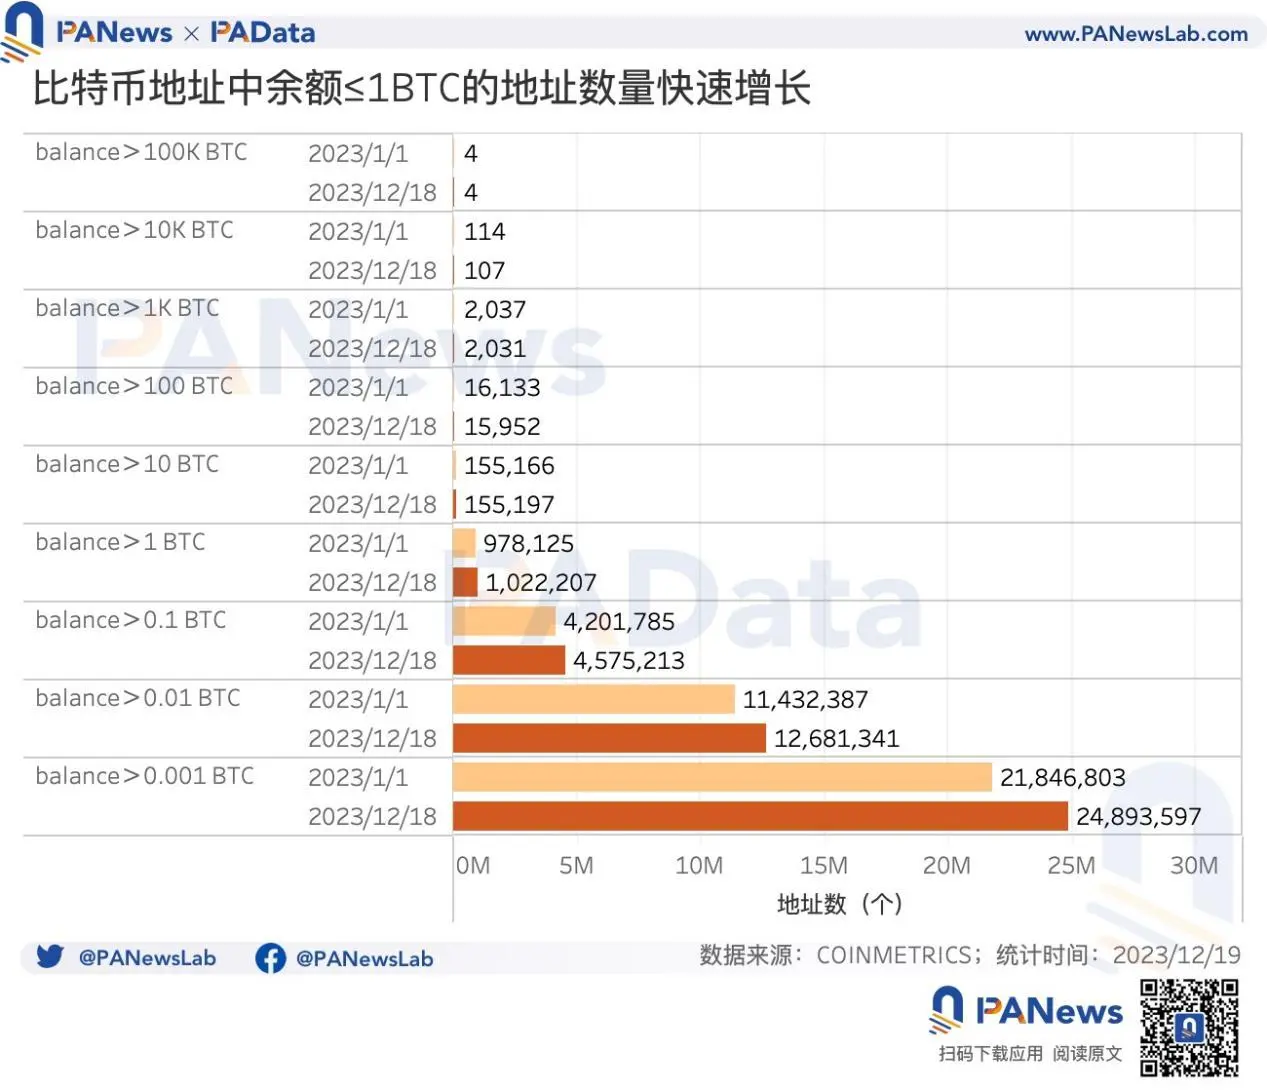
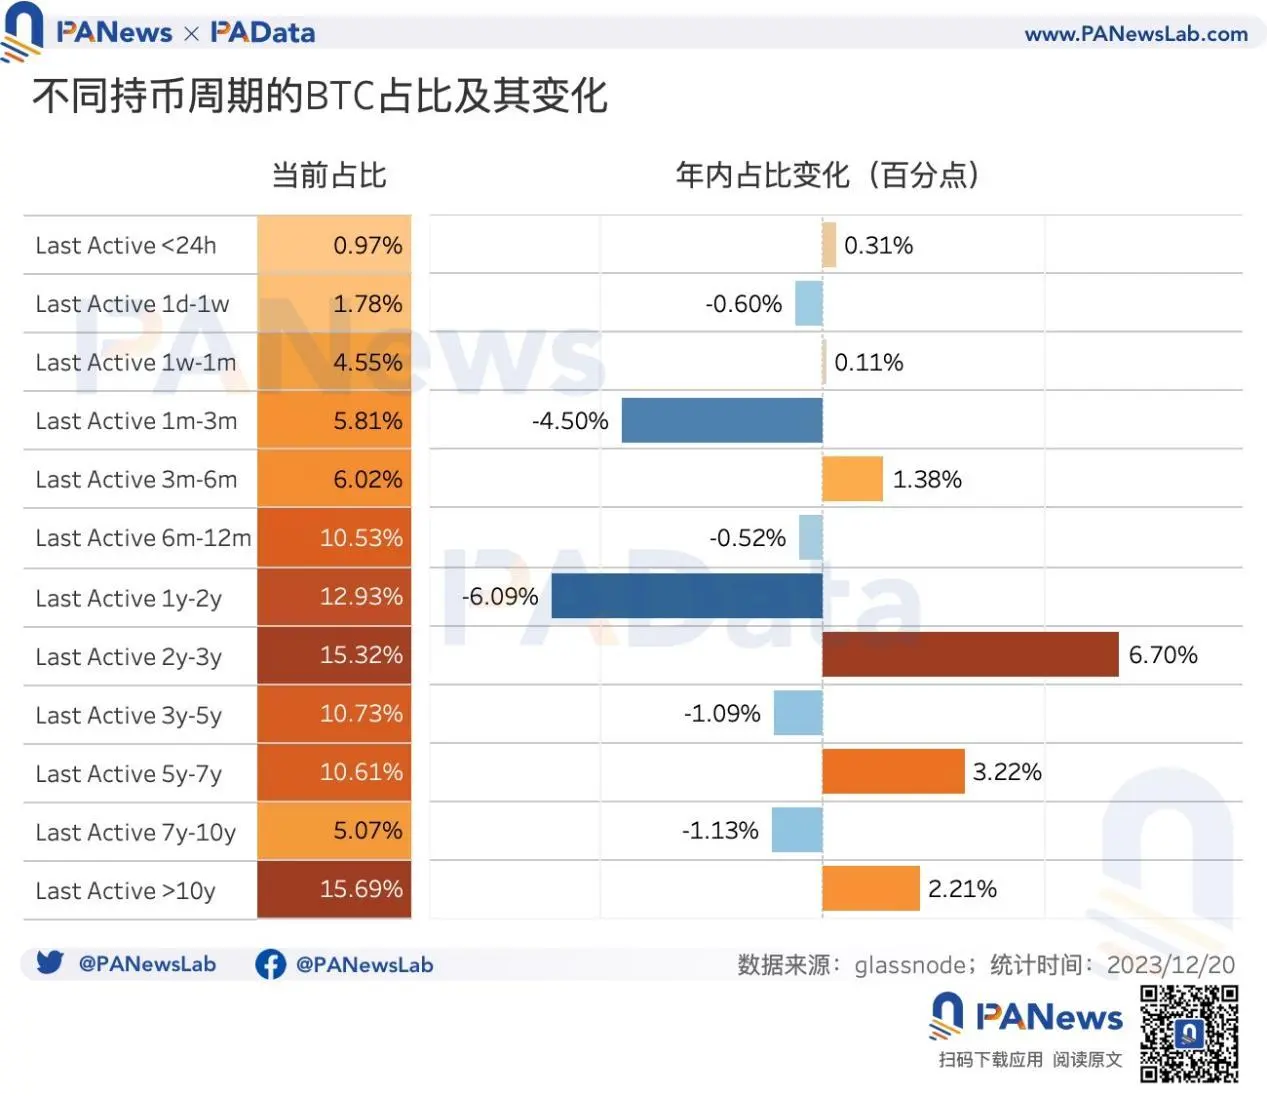
- The asset distribution of general Bitcoin users this year has continued the trend of accelerating small amounts, but the currency holding cycle has tilted from long-term polarization to long-term. The number of addresses with balances between 0.001 and 1BTC accounts for 97.24% of the total addresses. The proportion of chips in years 2 to 3 increased by 6.7 percentage points during the year.
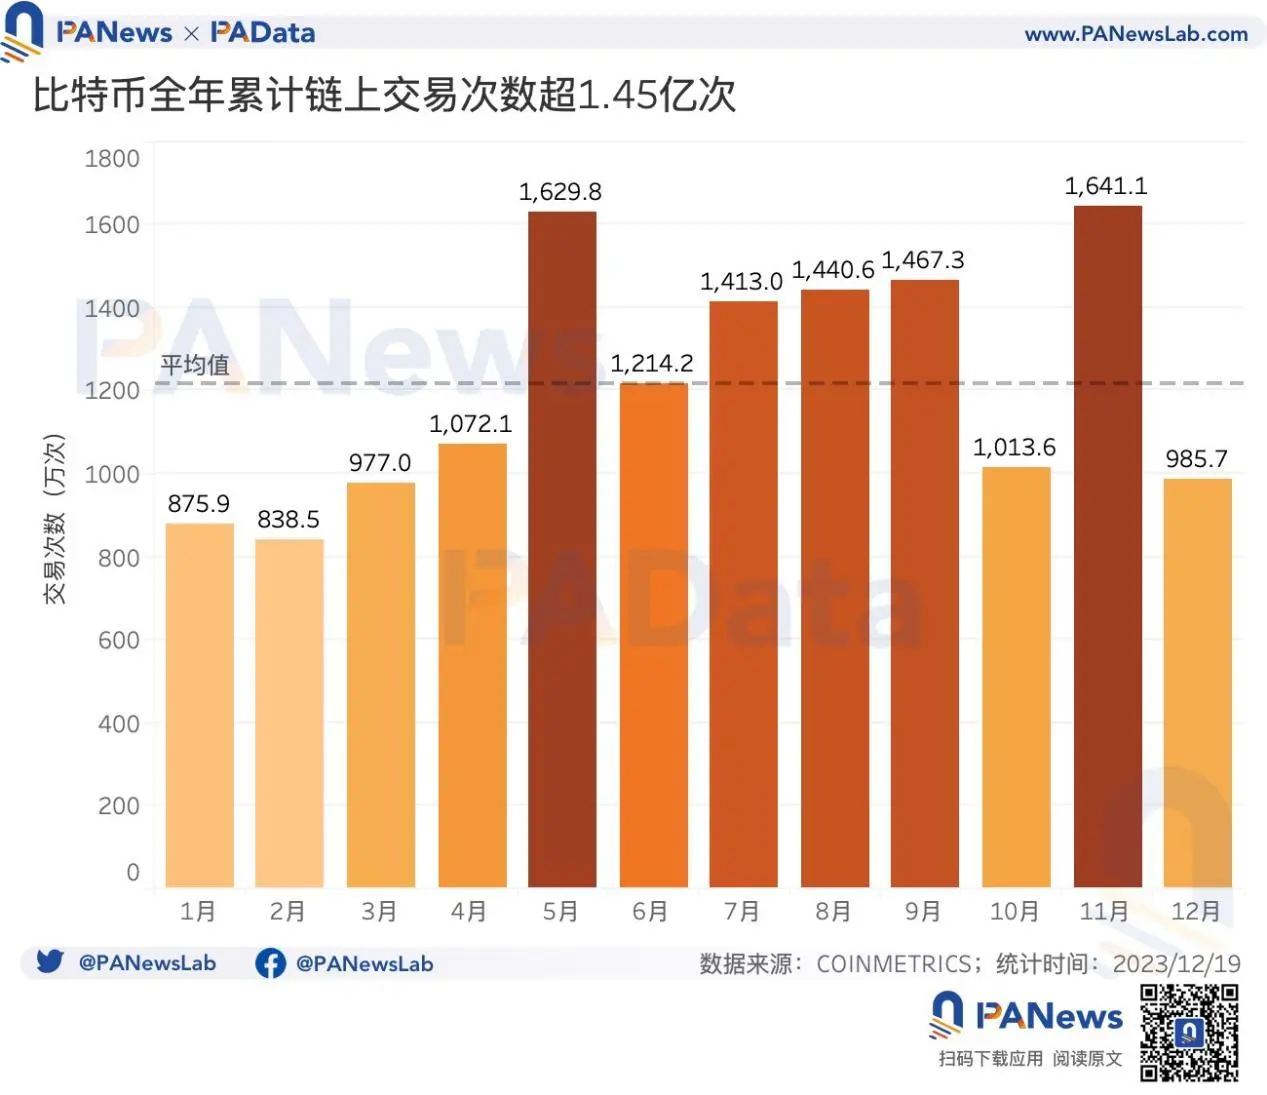
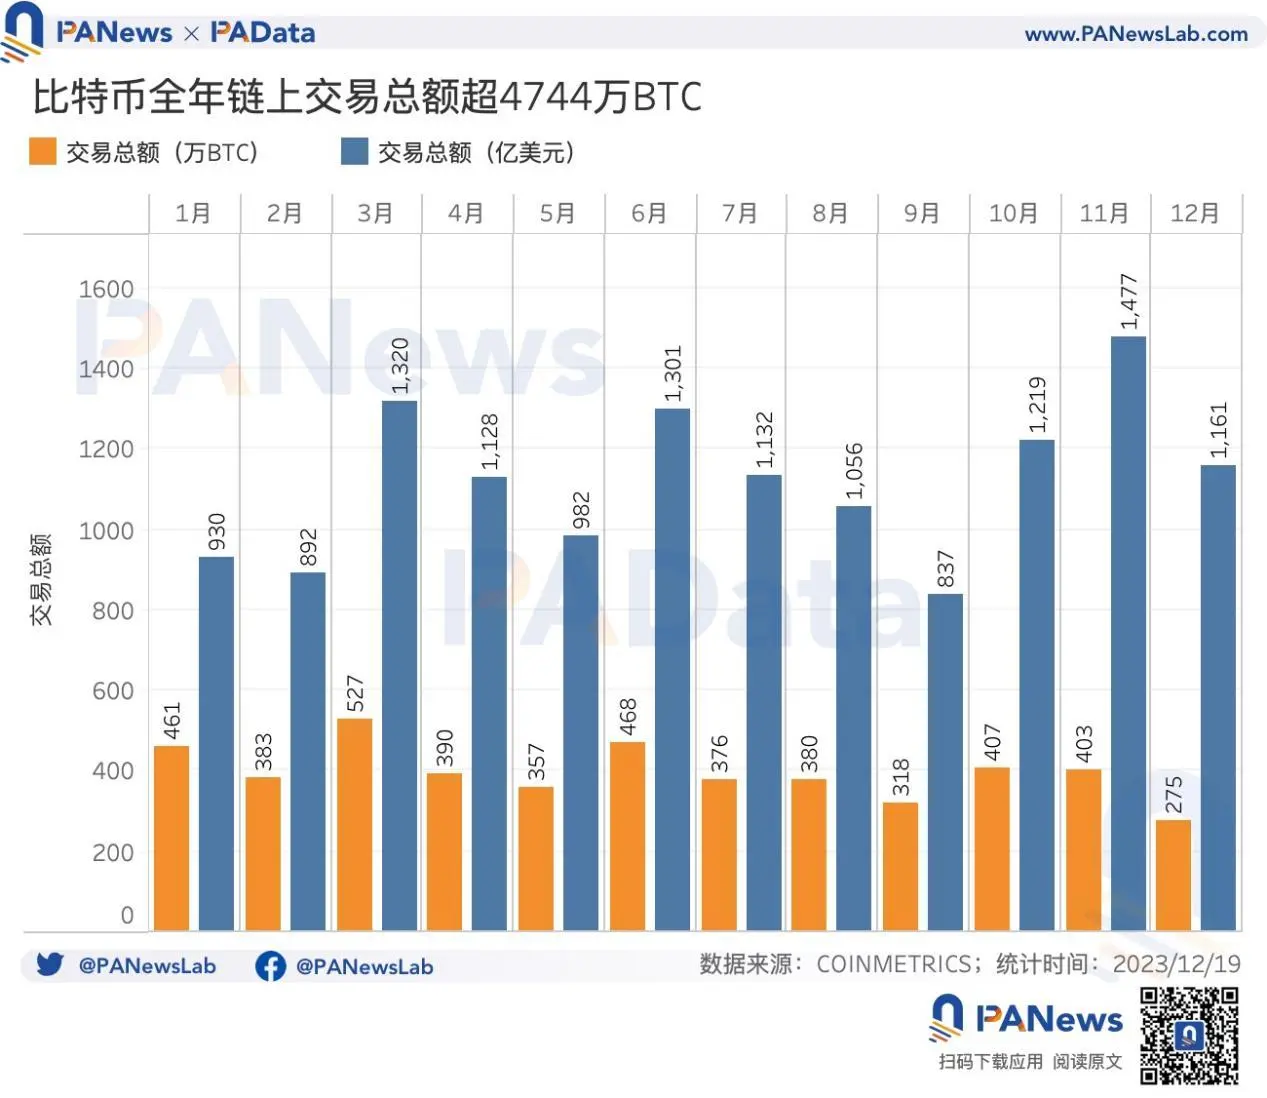
- The number of transactions and the total amount of transactions develop in different ways. This year, the cumulative number of Bitcoin on-chain transactions exceeded 145 million, an increase of about 63% from last year; the total number of on-chain transactions throughout the year was approximately 47.4498 million BTC, a 2547% drop from last year.
- This year, Bitcoin’s cumulative on-chain transaction fees are approximately US$641 million, a surge of 367.88% compared to last year. The average handling fee per transaction this year is approximately US$3.77, an increase of 146.41% compared to last year.
mining
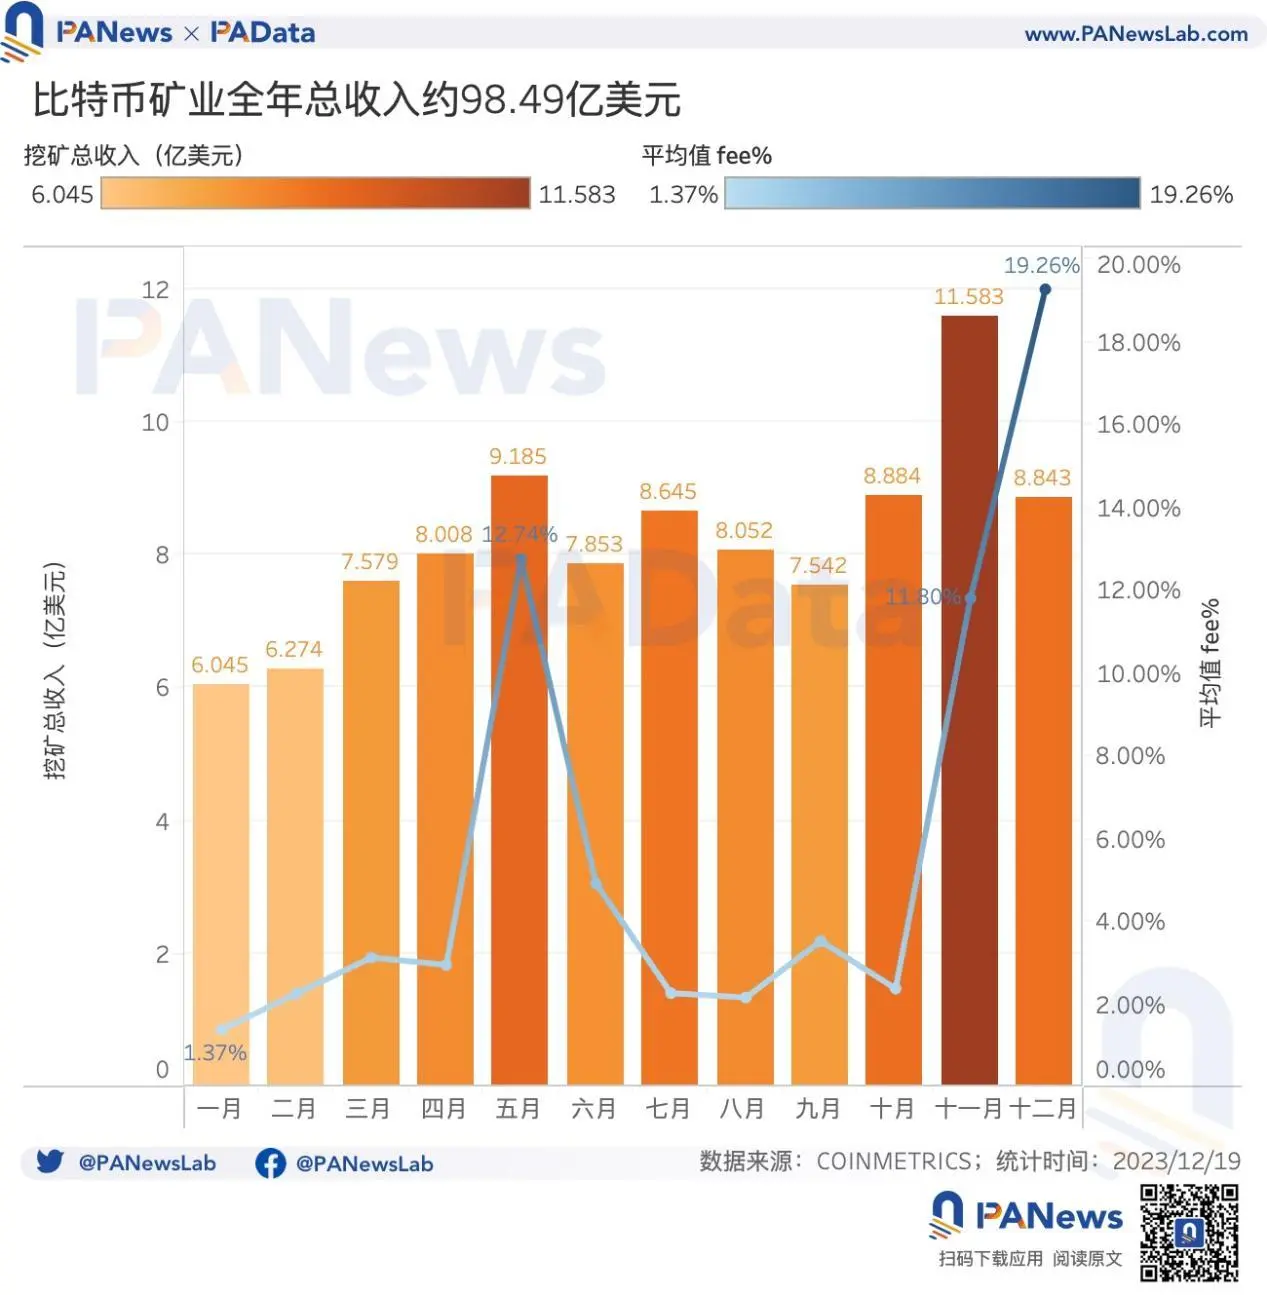
- This year, Bitcoin mining’s total annual revenue (transaction fees and mining rewards) is approximately US$9.849 billion. The average daily handling fee ratio surged to 19.26% in December.
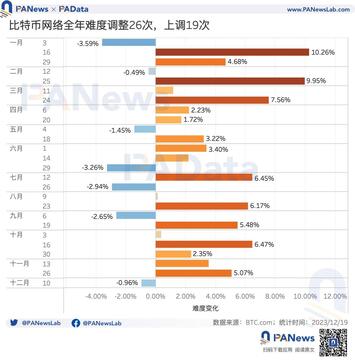
- This year, the mining difficulty increased by 90.35%, and the average daily computing power of the entire network increased by 106.27%. The increase in computing power is smaller than the increase in currency prices, which means that mining has the opportunity to obtain excess returns.
Applicability
- The cumulative number of Inions generated throughout the year has exceeded 49.46 million. There are two peak periods for the growth of Inions throughout the year. The first peak period is from late April to mid-September, and the second peak period lasts from late October to the present.
- Bitcoin DeFi’s TVL increased from US$96 million to US$299 million, an increase of 211.46% during the year. The TVL share of the largest protocol, Lightning Network, dropped from 87.90% at the beginning of the year to 70.95%. The diversified development of the Bitcoin ecosystem has begun to appear.
01 Trading market: The currency price increased by more than 158% throughout the year, and the proportion of profitable chips accounted for more than 87%
The market is the most intuitive window to observe the development of Bitcoin. In 2023, Bitcoin has basically completed the repair of last year’s decline. The currency price has risen from US$16,500 at the beginning of the year to more than US$42,700 at the end of the year. The annual increase is as high as 158.06%, which is close to the level at the beginning of 2022. Moreover, the upward trend of Bitcoin this year is very clear and sustainable, with more than 5% increase and decrease. The average daily price change is only 0.29%, with the highest not exceeding 9.77% and the lowest not exceeding -7.83%.
Bitcoin will usher in its fourth production cut next year, and the expectation of production cuts is considered an important driving force for the rise in currency prices. If the half-year before and after the production reduction (180 days) is taken as a cycle, then in the first half of the first three production cuts, Bitcoin rose by 134.62%, 51.30% and -1.89% respectively; in the second half of the production reduction, Bitcoin rose by 955.74% respectively. , 37.24% and 72.21%. Among the six cycles of three production cuts, Bitcoin only fell in the first half of the year before the third production cut. It was the market’s cold winter period, but the decline was still not significant. Generally speaking, historical data shows that production cuts and currency price increases usually occur at the same time.
According to BTC.com’s forecast, the fourth production cut is expected to occur on April 19, 2024. Currently, Bitcoin has entered the first half-year cycle of production reduction (starting on October 22 this year). The currency price on that day was US$29,900. It is expected that the production reduction next year will provide impetus for the increase in currency prices.
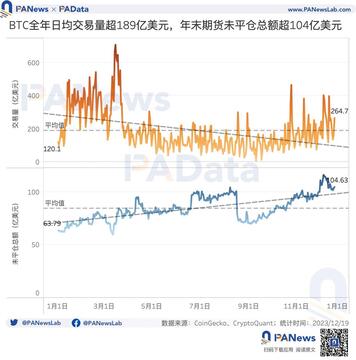
However, although the trend of Bitcoin price recovery this year is very clear, market trading volume has not increased simultaneously. The annual average daily trading volume was approximately US$18.92 billion, showing an overall downward trend during the year. Among them, the transaction volume in the first quarter was the highest, with an average of approximately US$33.4 billion. The transaction volume in the fourth quarter rebounded, with an average of approximately US$17.6 billion.
On the other hand, the Bitcoin futures market continued to be active this year, and the total open interest continued to rise during the year, rising from US$6.379 billion at the beginning of the year to US$10.463 billion at the end of the year, an increase of 64.02%. However, leverage ratios are falling instead. According to data from CryptoQuant, the estimated leverage ratio of the Bitcoin futures market this year fell from 30.67% at the beginning of the year to 20.22% at the end of the year (as of December 21). It has fallen back to the level at the beginning of the year and is basically at the average level in the past three years.
MVRV is the ratio of market capitalization to realized value. If the value is greater than 1, it means that the current market price is higher than the “fair price” at the time of chip trading, and the market price may be overvalued. This year, Bitcoin’s MVRV has been continuously greater than 1 since January 13, rising to 1.96 at the end of the year, and the annual average is about 1.40. This shows that the Bitcoin market this year has basically been overvalued.
An MVRV greater than 1 also generally means that more chips are likely to be profitable. Data from glassnode shows that the proportion of profitable BTC chips in circulation increased from 50.77% at the beginning of the year to 87.76% at the end of the year (as of December 19), which means that most of the chips are in profit. The current proportion of profitable chips is higher than the maximum value last year, and the overall profitability of Bitcoin this year is far better than last year.
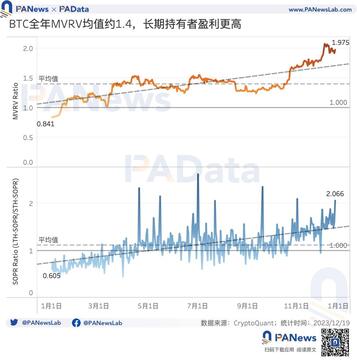
From the perspective of profit strategy, LTH-SOPR/STH-SOPR (output profit ratio of long-term holders/output profit ratio of short-term holders) increased from 0.61 at the beginning of the year to 2.1 at the end of the year, especially since late October. This ratio is almost always higher than 1. The ratio uses 1 as the dividing line. A larger ratio indicates that the profitability of long-term holders is higher than that of short-term holders. Generally speaking, long-term holders have better profitability this year, and this advantage will become more obvious towards the end of the year.
What is worth paying attention to in terms of institutional funds this year is that the application news of spot ETFs has repeatedly affected the Bitcoin trading market (related reading "Number of Bitcoin ETFs: 5 futures ETFs have total assets of nearly 1.3 billion US dollars, Bitcoin is subject to application news How big of an impact will it have?”). The frequent news of applications comes out, which to a certain extent means that the relationship between Bitcoin and traditional financial markets is deepening. However, according to statistics, there is basically no statistical correlation between the price changes of Bitcoin and the Dow Jones Industrial Index and the US Dollar Index this year. Among them, the number of days that Bitcoin is not correlated with the two (the 7-day average of the correlation coefficient is between -0.5-0.5) is 179 days and 200 days respectively, accounting for 51.59% and 57.64% respectively.
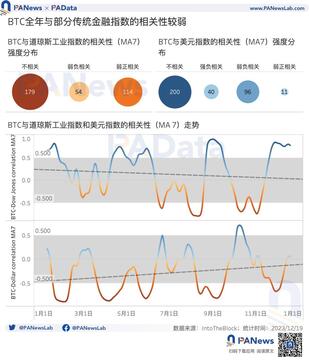
However, during certain periods of time, Bitcoin has a certain correlation with the Dow Jones Industrial Index and the U.S. Dollar Index, with a certain positive correlation with the former and a certain negative correlation with the latter. Specifically, Bitcoin has a weak negative correlation with the two (the 7-day average of the correlation coefficient is between -0.5–0.8) for 54 days and 96 days respectively, accounting for 15.56% and 27.67% respectively; There are 114 and 11 days with weak positive correlation (the 7-day average of the correlation coefficient is between 0.5 and 0.8), accounting for 32.85% and 3.17% respectively; it has a strong negative correlation with the US dollar index (the 7-day average of the correlation coefficient is between 0.5 and 0.8). -0.8 or above), there are 40 days, accounting for 11.53%. Moreover, judging from the trend, the correlation coefficient between Bitcoin and the Dow Jones Industrial Index is on a downward trend this year, while the correlation coefficient with the US dollar index is on an upward trend.
02 On-chain fundamentals: The number of transactions throughout the year surged to 145 million, and the total transaction volume plummeted to 47.44 million BTC
The average number of monthly active addresses on the Bitcoin chain this year is about 948,700, a slight increase of 3.51% from last year’s monthly average of 916,500, but still lower than the average monthly activity level in 2021. Among them, the average number of daily active addresses in September and November this year exceeded 1 million, which is the most active period of the year.
Judging from changes in the address balance distribution structure and currency holding period distribution, the asset distribution of general Bitcoin users this year has continued the trend of accelerating small amounts, but the currency holding cycle has tilted from long-term polarization to long-term.
Judging from the address balance distribution structure, the addresses with balances between 0.001 to 0.01BTC, 0.01 to 0.1BTC, and 0.1 to 1BTC have the largest number, currently accounting for 97.24% of the total number of addresses. In other words, owning 1 BTC is equivalent to surpassing 97% of the currency holding addresses. Moreover, the number of addresses in these three balance ranges increased by 13.95%, 10.92% and 8.89% respectively during the year, a significant increase. On the contrary, within the balance range above 1 BTC, only 1 to 10 BTC still have a certain growth, with an increase of about 4.51% during the year, and the others are almost unchanged. It should also be noted that the number of addresses with balances between 10,000 and 100,000 BTC has decreased by 6.14% this year. Overall, the trend of micro-amounts has been further accelerated.
From the perspective of currency holding cycles, currently, more than 6 months is the main currency holding cycle, including 6 to 12 months, 1 to 2 years, 2 to 3 years, 3 to 5 years, 5 to 7 years and more than 10 years The share of chips in these six cycles exceeded 10%. Unlike last year, where the dividing line for change in proportion was mainly in 1 year, this year the dividing line for change in proportion is mainly in 2 years. In each currency holding period of more than 2 years, the proportion of chips in 2 to 3 years increased by 6.7 percentage points during the year, the number of chips in 5 to 7 years increased by 3.2 percentage points during the year, and the number of chips in 10 years and above increased by 3.2 percentage points during the year. The proportion increased by 2.2 percentage points during the year. But on the contrary, the proportion of the number of chips in the two cycles of less than 24 hours and 1 week to 1 month this year is much smaller than last year. Generally speaking, the short-term trend of the currency holding cycle has not continued, but the long-term trend has been strengthened.
Another on-chain trend that is very different from last year is the divergent development of the number of transactions and the total amount of transactions. This year, the cumulative number of transactions on the Bitcoin chain exceeded 145 million, an increase of about 63% from 88.99 million last year, a very obvious increase. The average monthly cumulative number of transactions this year was 12.141 million, and it showed a monthly growth trend during the year.
However, the ultra-high number of on-chain transactions has not brought about a simultaneous increase in the total transaction volume. The total number of transactions on the Bitcoin chain this year is approximately 47.4498 million BTC, equivalent to approximately US$1.34 trillion. The total amount of currency-based transactions plummeted 2547% from last year’s 1.256 billion BTC. This year’s average monthly cumulative total transaction volume is approximately 3.954 million BTC, equivalent to approximately US$111.97 billion.
The main reason for the divergent development of the number of transactions and the total amount of transactions is the explosion of the Ordinals protocol. Another result of this is the surge in transaction fees. This year, the cumulative on-chain transaction fees of Bitcoin for the entire year are approximately US$641 million, a surge of 367.88% from US$137 million last year. Among them, this year’s transaction fees mainly came from May, November and December (as of December 19). The transaction fees in these three months exceeded US$100 million, accounting for 70.16% of the annual fee income. .
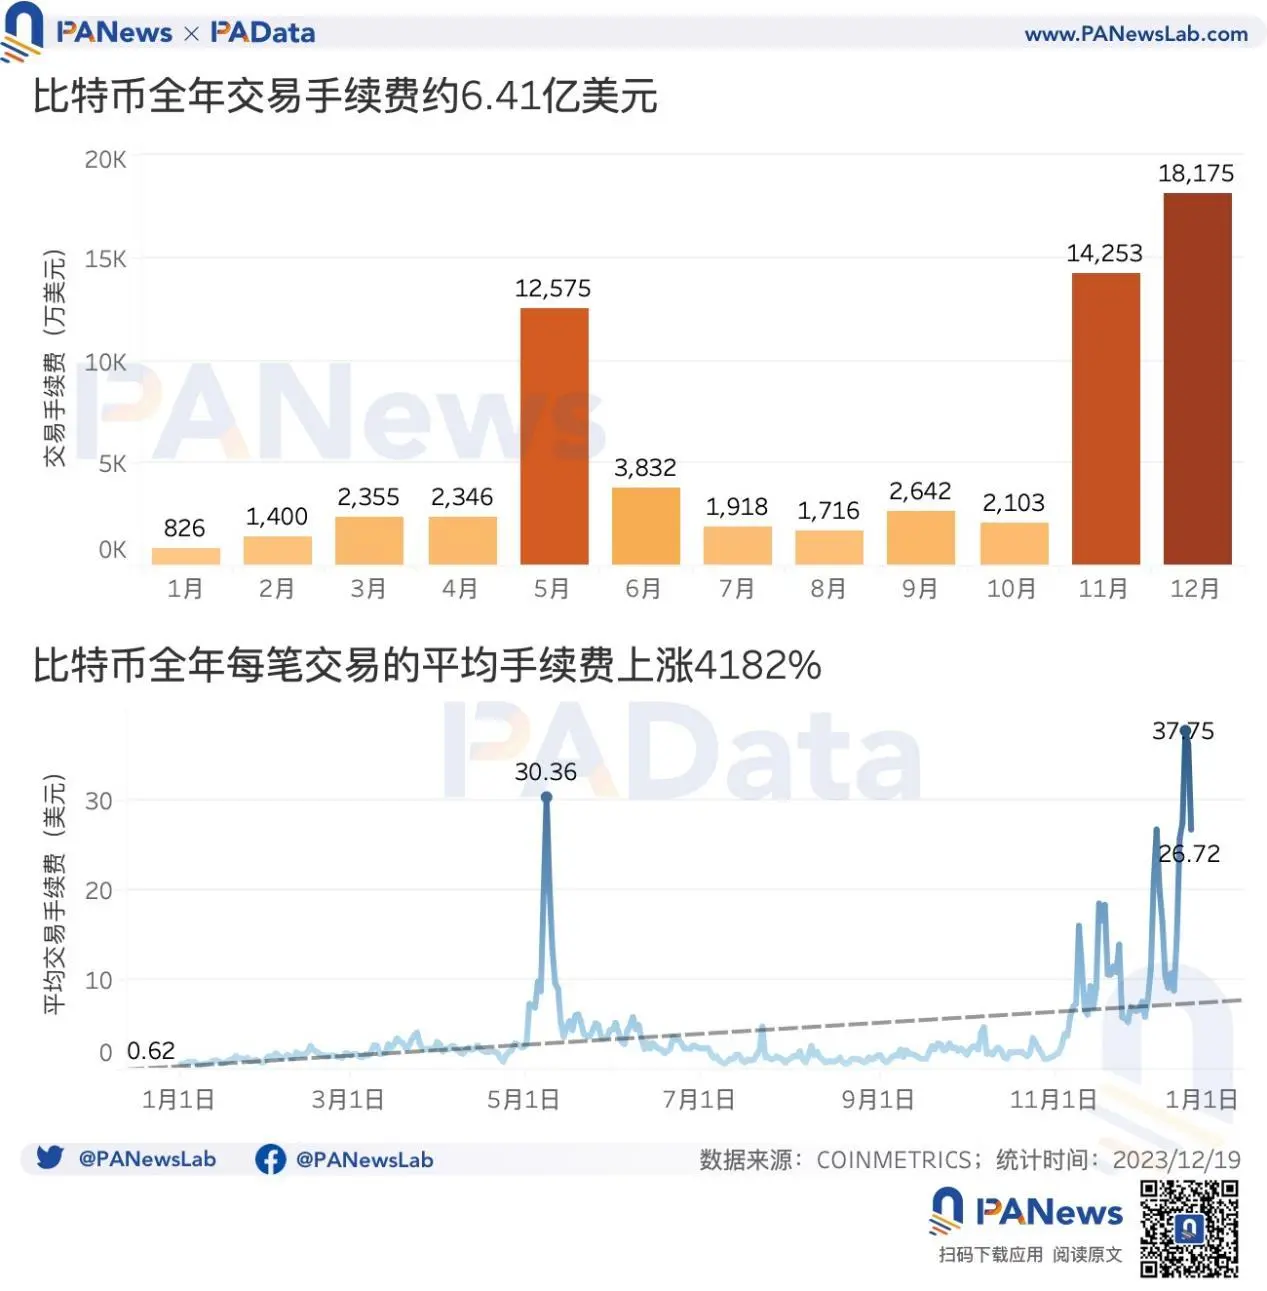
The average handling fee per transaction this year is approximately US$3.77, an increase of 146.41% from US$1.53 last year. The average handling fee per transaction surged from US$0.62 to US$26.72 during the year, an increase of 4182%. The peak was over $37. It can be said that the transaction costs on the Bitcoin chain have increased significantly this year.
03 Mining: Total annual mining revenue exceeded US$9.8 billion, and computing power increased by 106%
Mining has always been an important part of the blockchain industry. This year, Bitcoin mining’s total annual revenue (transaction fees and mining rewards) is approximately US$9.849 billion. The total monthly revenue in November reached US$1.158 billion. Generally speaking, mining revenue showed a growth trend during the year.
Consistent with the trading craze triggered by Ordinals, the proportion of handling fees in mining revenue also showed two peaks during the year. The first peak was in May, when the daily average handling fee accounted for 12.74%, and the second peak was from November to December, when the daily average handling fee accounted for 11.80 and 19.26% respectively. It can be expected that if the mining rewards are halved next year but the trading boom caused by Ordinals continues, the proportion of transaction fees may further increase.
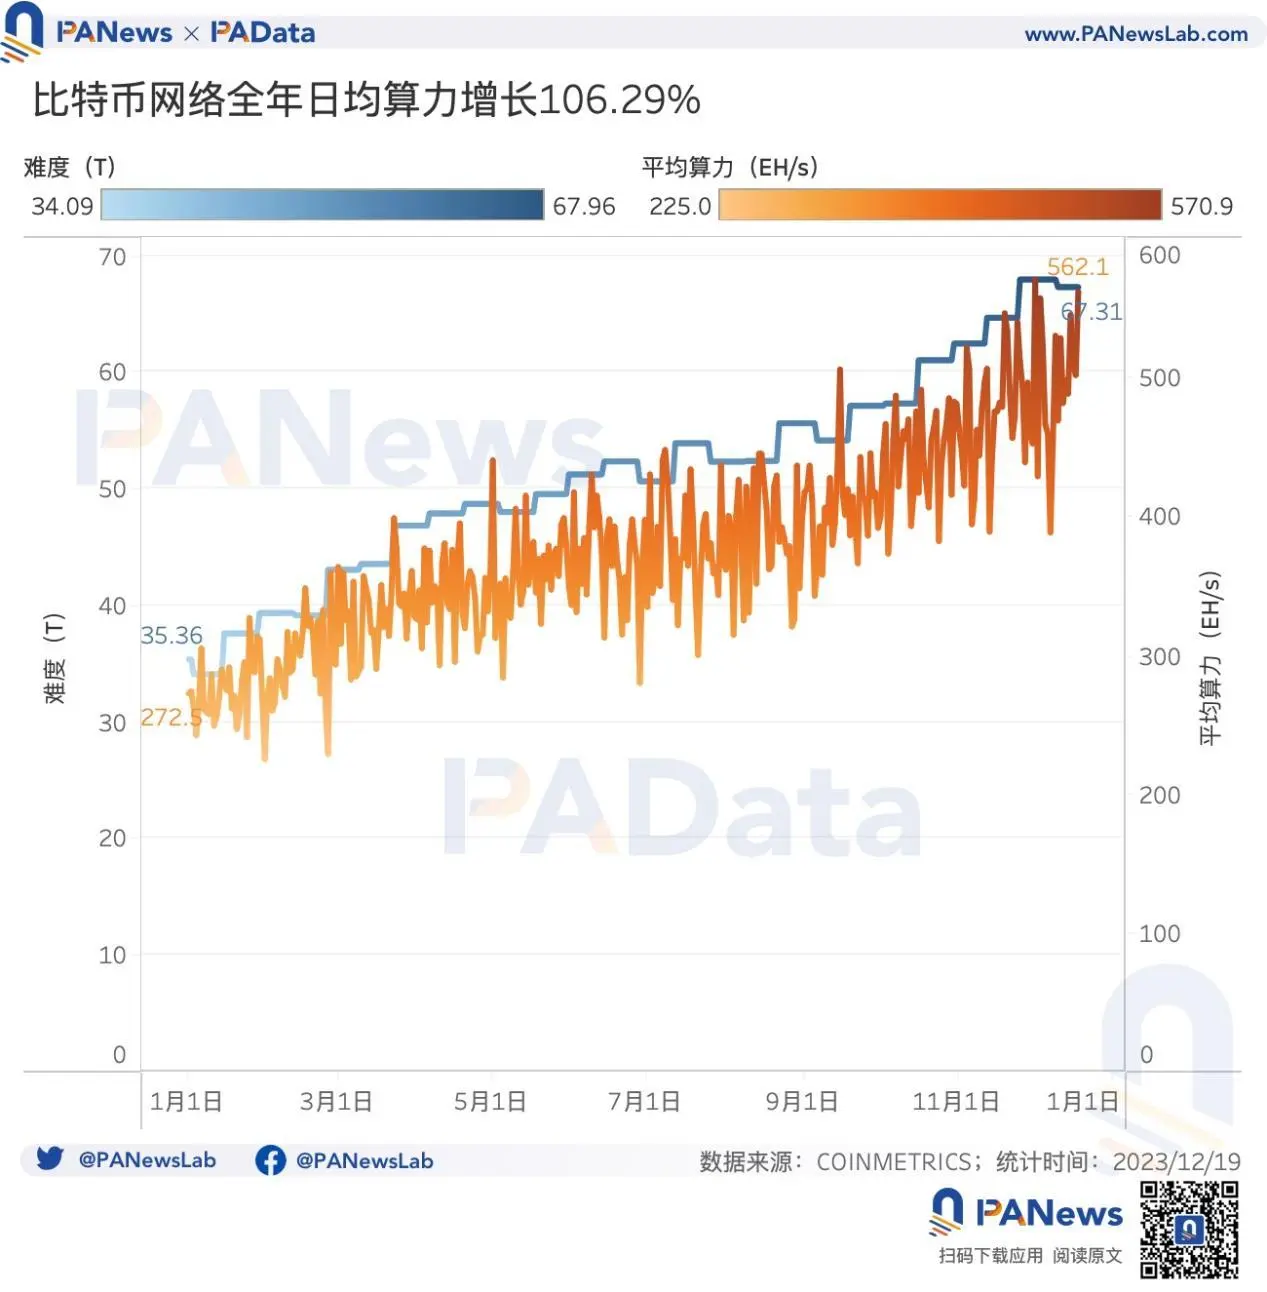
From a cost perspective, this year the mining industry is facing a situation where difficulty and computing power continue to rise. The mining difficulty of the Bitcoin network was adjusted 26 times throughout this year, including 19 upward adjustments. The consecutive upward adjustment periods were concentrated in the two time intervals from late February to late April and from mid-September to late November. Compared with last year, there have been more mining difficulty increases this year and the magnitude of the increase has been larger.
The current mining difficulty of the entire network is approximately 67.31T, an increase of 90.35% from the beginning of the year. Also growing simultaneously is the daily average computing power of the entire network, which is currently about 562.1 EH/s, an increase of 106.27% from the beginning of the year. Unlike last year, when the average daily computing power of the entire network only increased modestly by 11.21%, this year’s computing power has increased significantly. Moreover, what needs comparison is that the increase in computing power this year is less than the increase in currency prices, which means that the mining industry has the opportunity to obtain excess returns.
According to statistics from BTC.com, as of December 22, under the PPS mode, the daily mining income per T of computing power of the Bitcoin mining pool was approximately 0.00000187 BTC, equivalent to approximately US$0.082. Under the FPPS mode, the Bitcoin mining The pool’s daily mining income per T of computing power is approximately 0.00000268 BTC, equivalent to approximately US$0.11. According to COINMETRICS statistics, Bitcoin’s mining revenue per unit of computing power (note: after cross comparison, this revenue is close to the revenue of the FPPS model) increased by 85.21% during the year. Overall, mining revenue has been substantial this year.
04 Application level: The total number of inscriptions exceeds 49.46 million, and BRC-20 becomes a growth engine
The application of Bitcoin has always been without much imagination. In the past, the application of Bitcoin was mainly reflected in the Lightning Network and WBTC. This year, with the rise of Ordinals, the prospects for the development of Bitcoin applications have broadened.
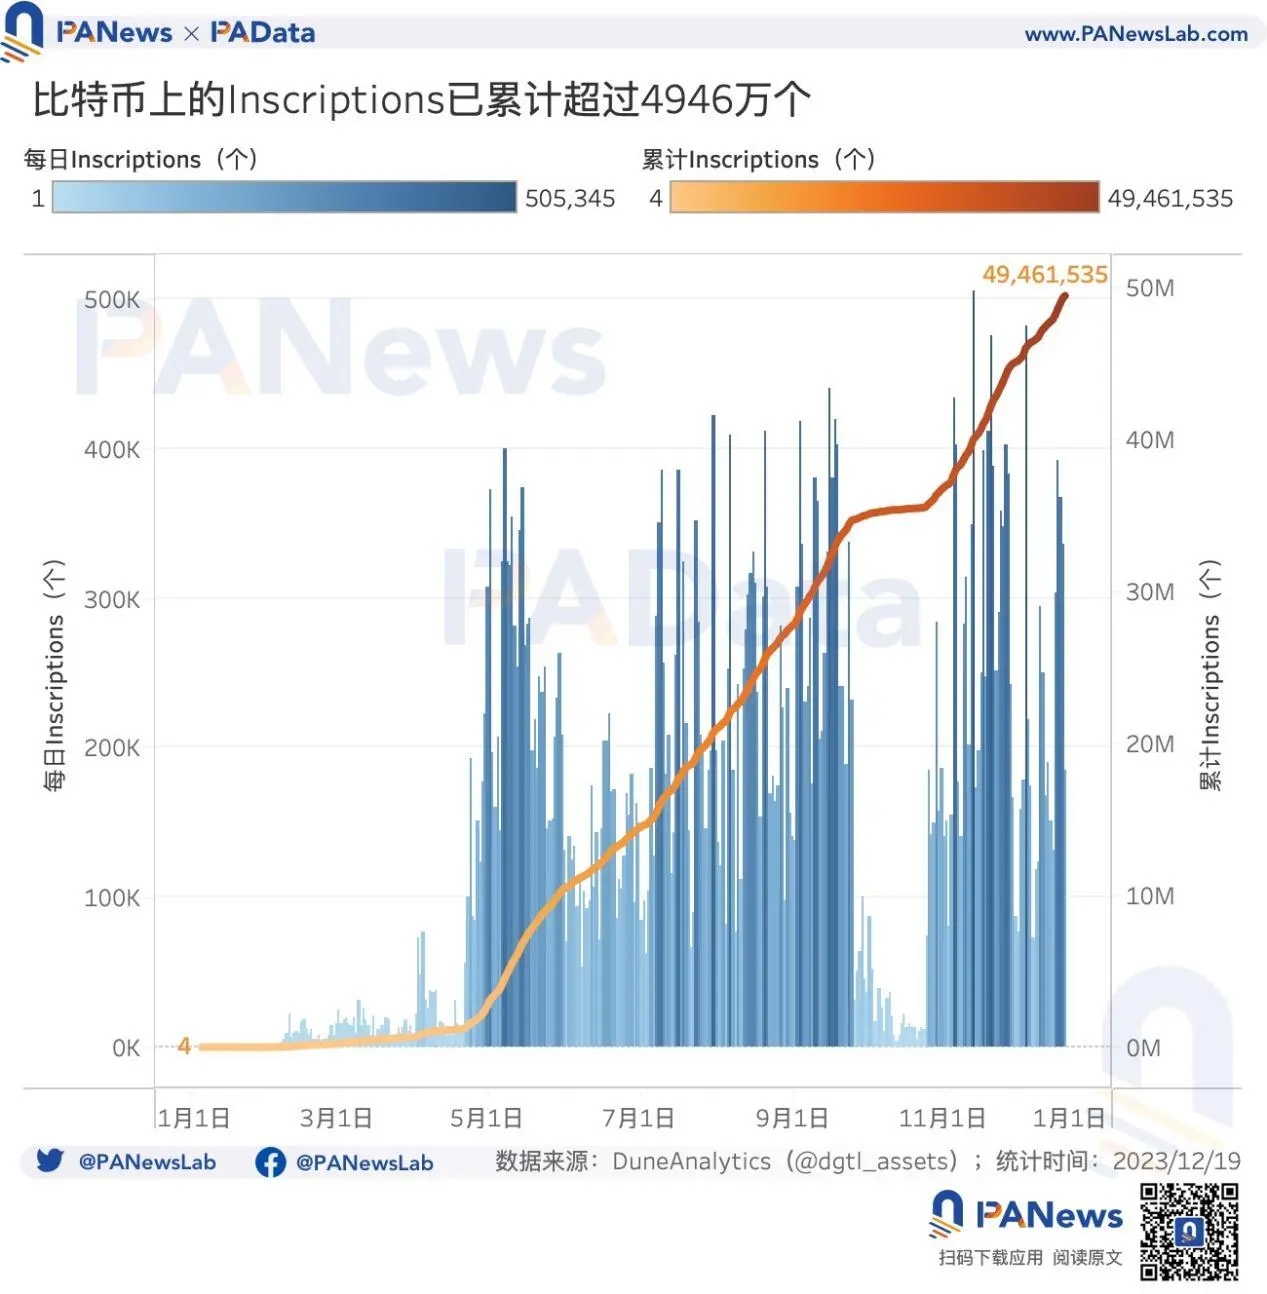
First of all, looking at the most popular Ordinals, as of December 19, the cumulative number of Inions produced has exceeded 49.46 million. You must know that this number was only 4 at the beginning of the year. There are two peak periods for the growth of Inions throughout the year. The first peak period is from late April to mid-September, and the second peak period lasts from late October to the present. During the peak period, the number of new Inions in a single day exceeded 400,000 on many days, and once exceeded 500,000.
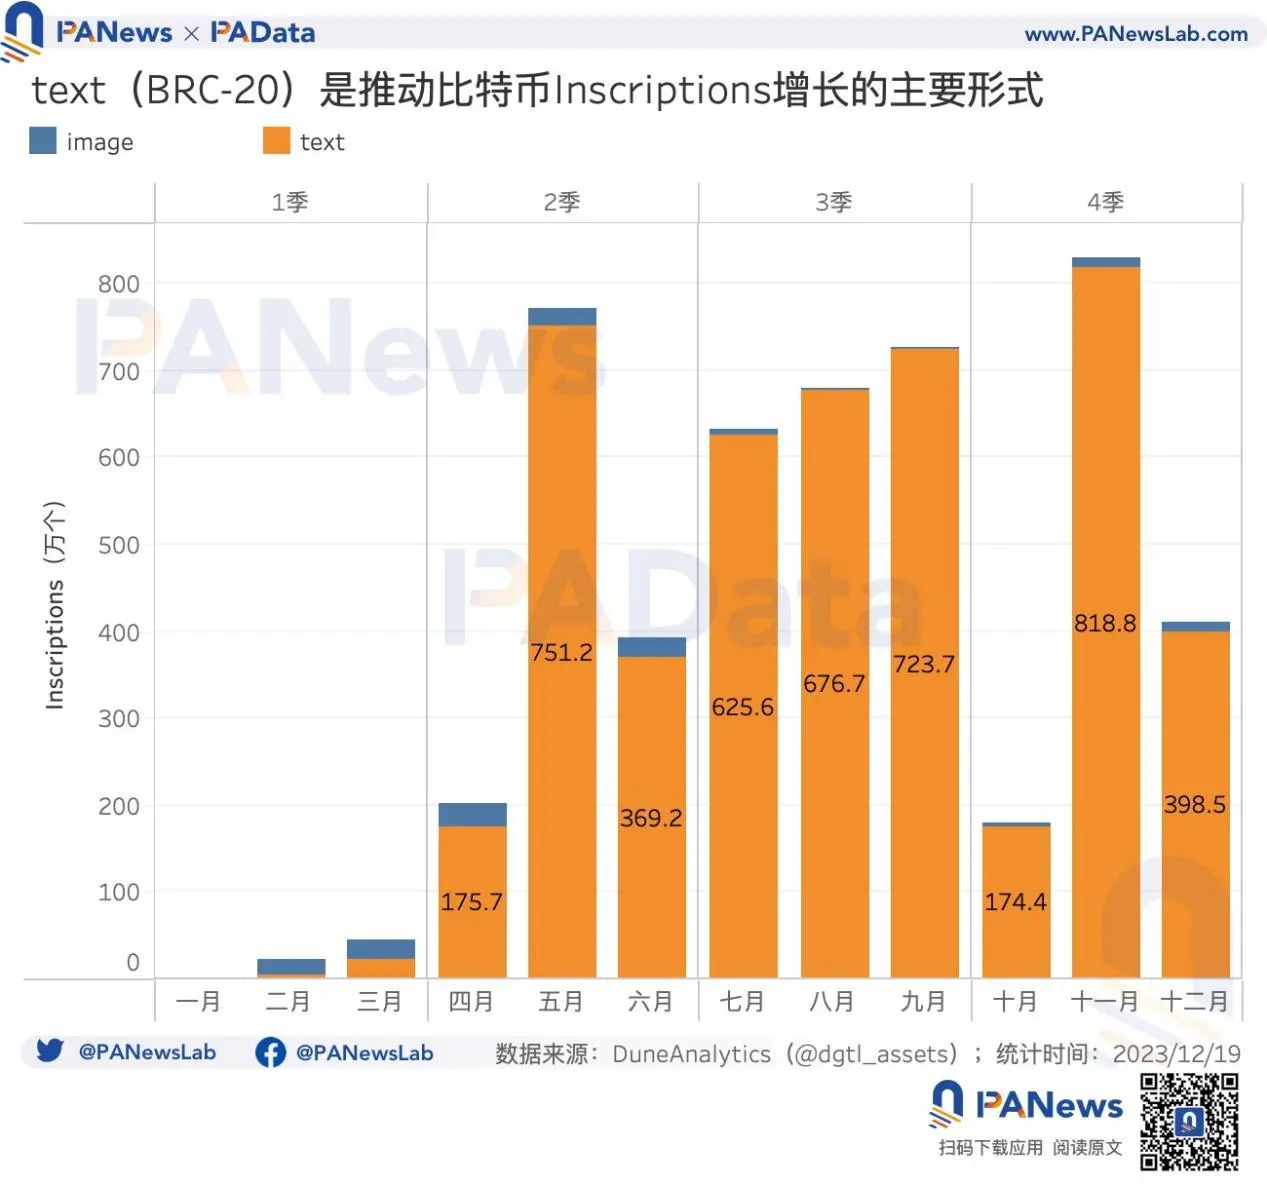
In terms of type, image and text are the two main forms. The former points to NFT-like images, and the latter derives from BRC-20 tokens. When Ordinals first came out, pictures were the main type. In the first quarter, there were 378,000 pictures and only 270,000 texts. But since April, this pattern has quickly reversed, and text has become the mainstream. From the second to the fourth quarter, there were 47.14 million texts, while there were only 1.067 million pictures. This is inseparable from the wealth creation effect of BRC-20 tokens such as ORDI.
At present, the popularity of BRC-20 continues, and the trading market for image Inions is also gradually developing. Compared with the more mature ERC-20 and NFT markets, there is still a lot of room for the development of the Bitcoin ecosystem, especially The emergence of BRC-20 has made some people see the popularity of Ethereum DeFi Summer.
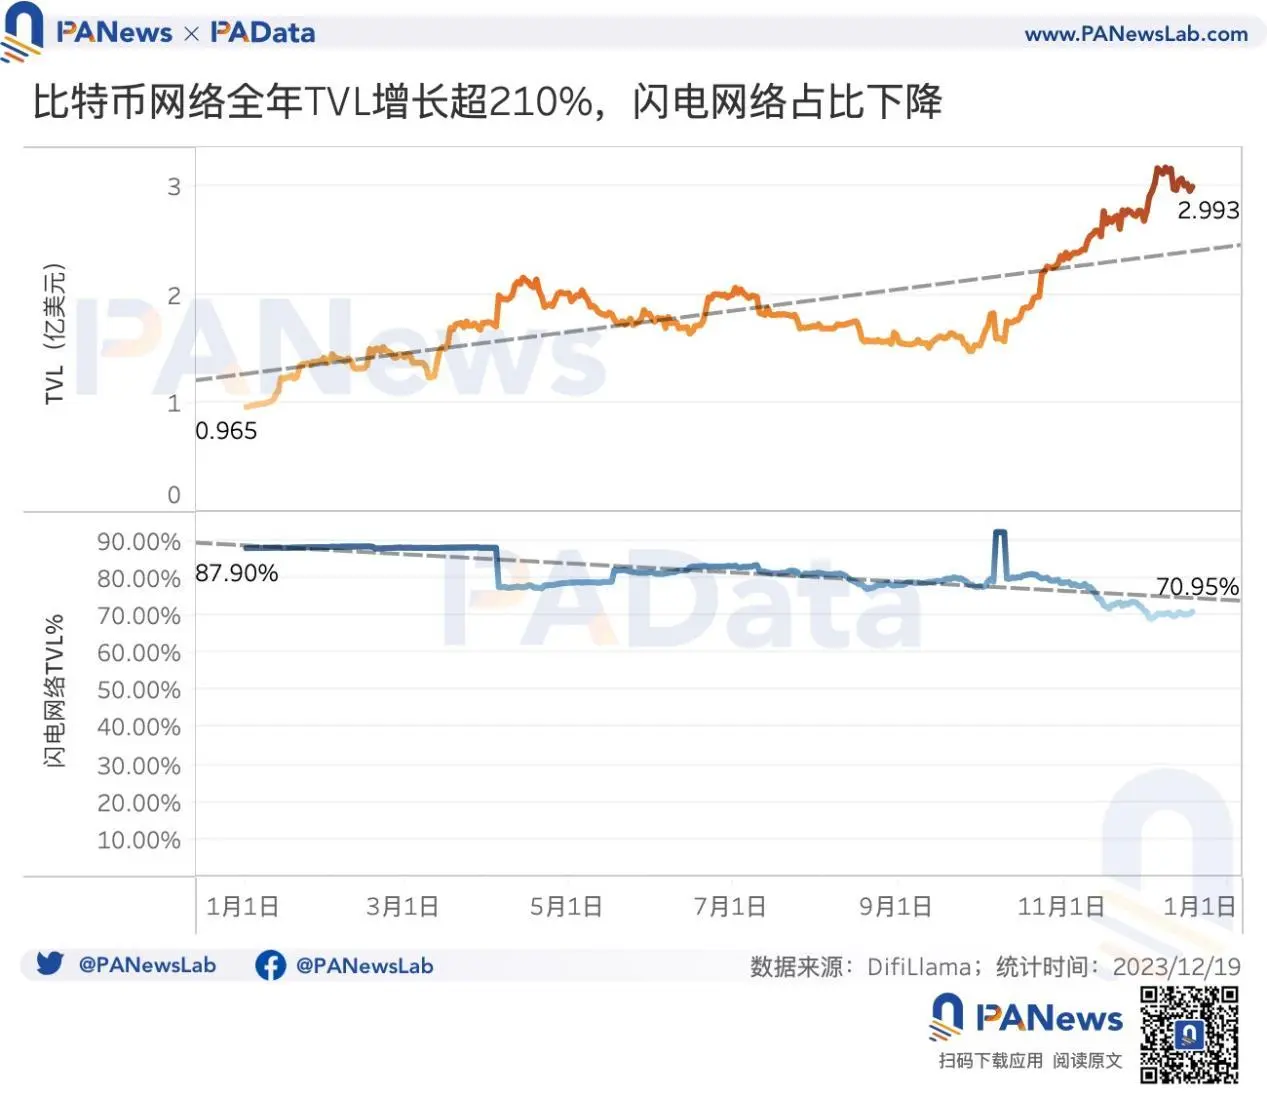
Judging from the TVL of Bitcoin DeFi, it increased from US$96 million to US$299 million this year, an increase of 211.46% during the year. The highest TVL once exceeded US$300 million. Moreover, the data worth noting is that the TVL ratio of Lightning Network, the largest protocol on Bitcoin, dropped from 87.90% at the beginning of the year to 70.95%. Combined with the growth of total TVL, this means that more applications have appeared in the Bitcoin network , and the TVL of these applications is growing rapidly.
