Original source: Follow-up NextQuestion
 Image source: Generated by Unbounded AI
When we see two sets of line gratings next to each other, slightly misaligned with each other, it seems that a line that doesn’t actually exist appears in our minds. This line appears to bend and extend between two sets of actual lines (Figure 1C).
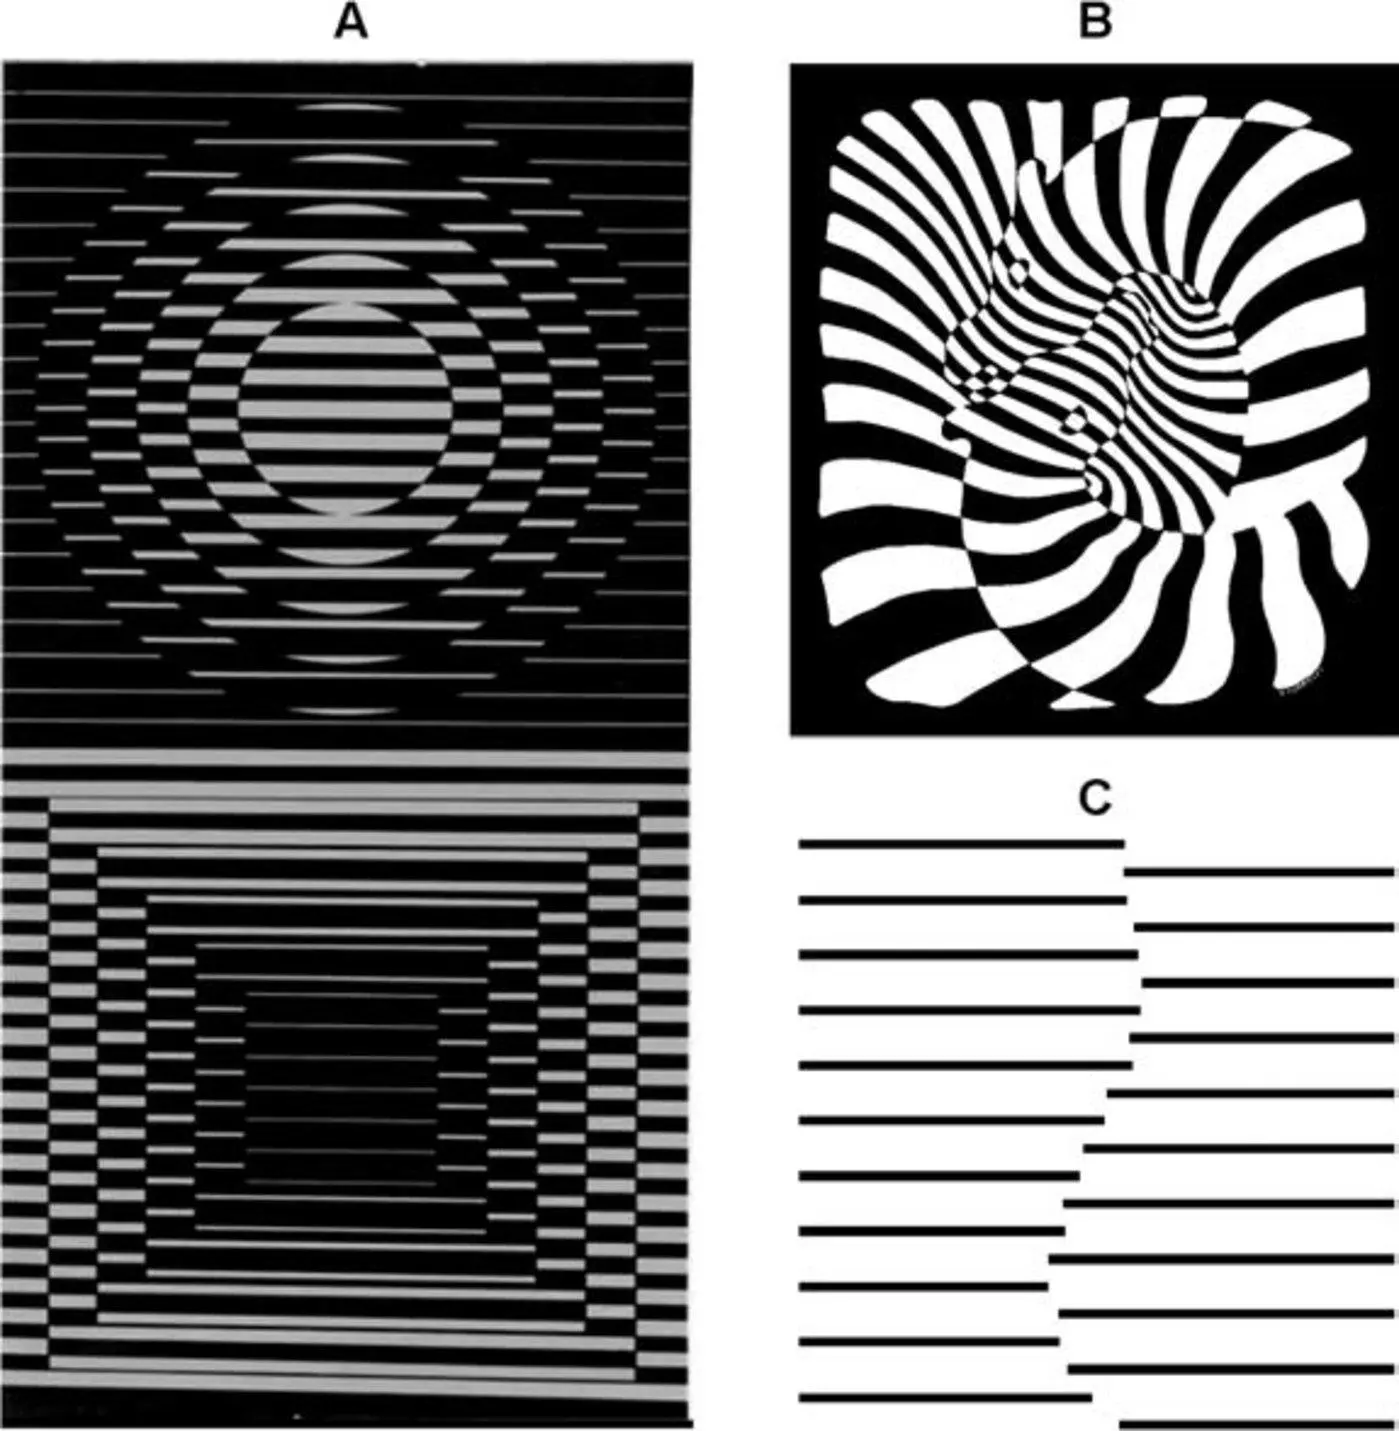 Figure 1: Staggered raster hallucination variant. A: Vasarely (1970), B: Vasarely’ Zebres (1939), C: Classic staggered grating illusion. Source: Vasarely*
Such a simple arrangement can create a surprising visual effect, which we call The abutting grating illusion. What’s even more interesting is that when the number of these lines increases, our perception of hallucinations also becomes stronger.
There are also two neon diffusion illusions that are also interesting:
The Ehrenstein Illusion and the Wallin Illusion. In the Ehrenstein hallucination, a set of radial lines stretches outward. The outward direction of the line is dark, while the part that gathers towards the center is light. If you focus your gaze on the center of the line, the light part of the interior looks like it spreads out into the surrounding dark area, forming a translucent circle.
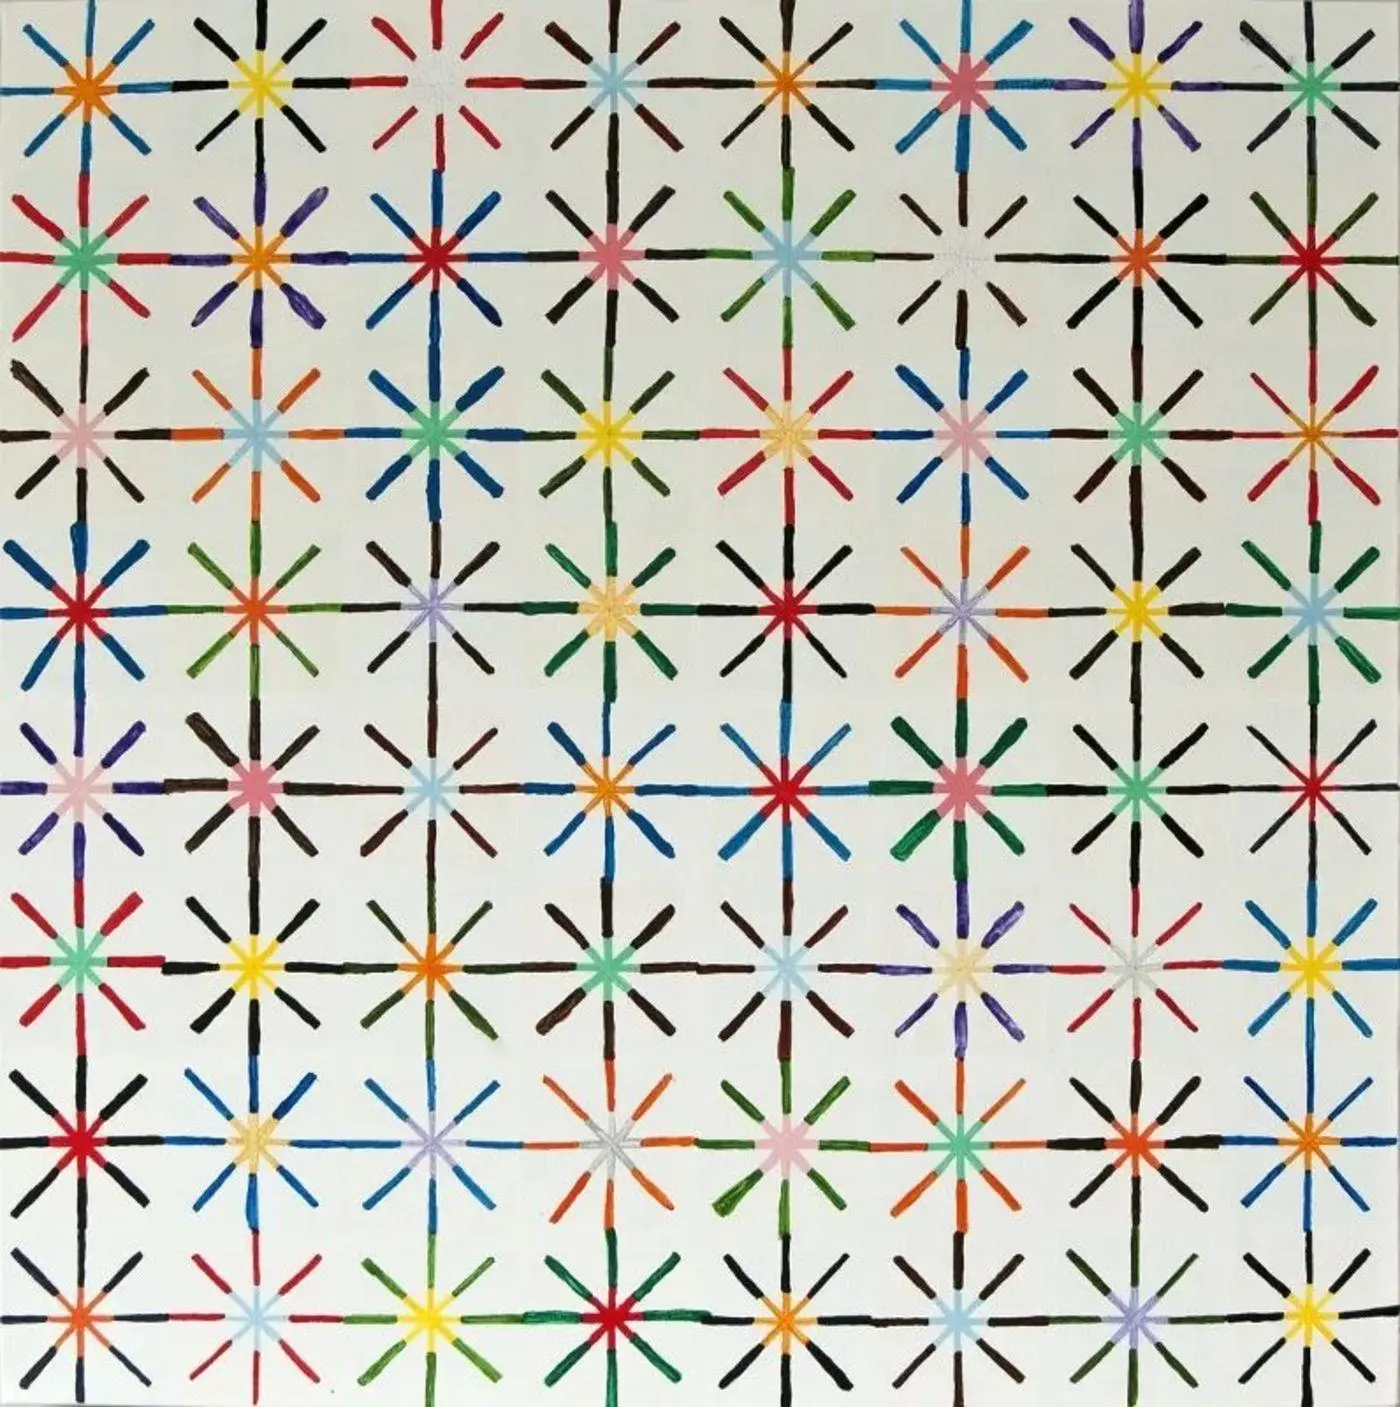 Figure 2: The Ehrenstein hallucination, where a rectilinear lattice pattern that stops at a specific point appears brighter in the center than the background, creating the illusion of a circle. Source: Wikipedia
The Wallin illusion consisted of circles at four corners, one part of each circle was lighter in color, and the others were black. When we gaze at these circles, the light-colored parts seem to diffuse towards the center, eventually forming a translucent square.
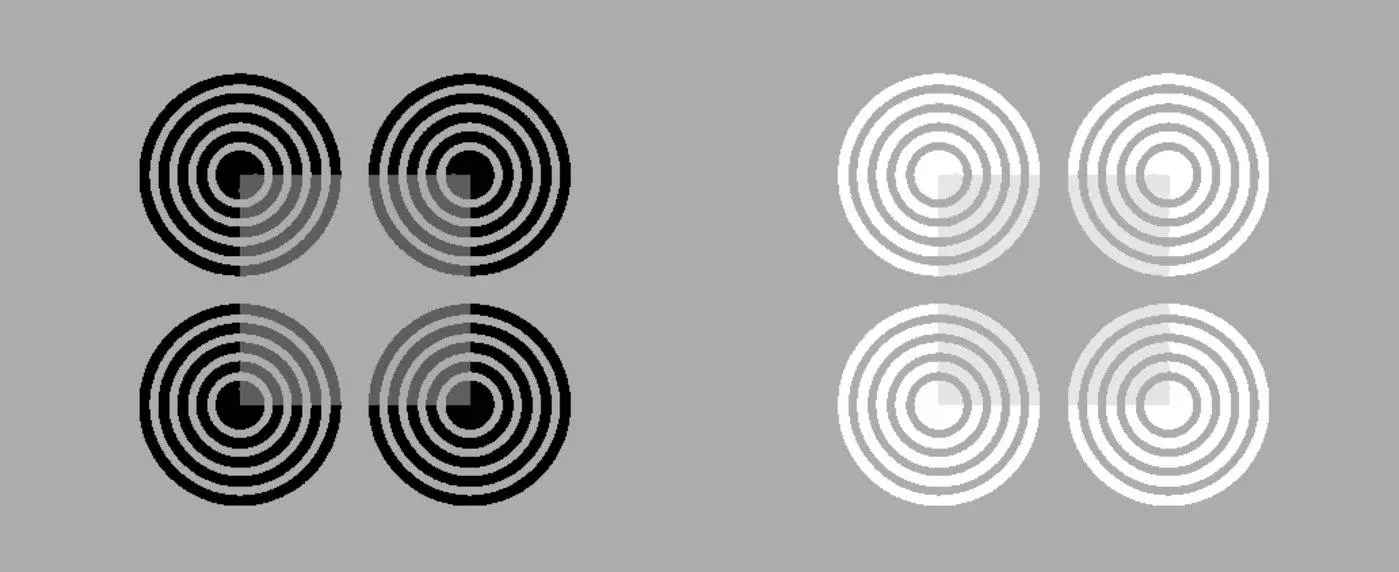 Figure 3: Valin hallucination, where the brighter or darker part of the center spreads towards the center, eventually forming a translucent square. Source: Perception
Algorithm Mechanism of Virtual Contour Perception
Scientists have proposed a variety of theories to explain the algorithmic mechanism of virtual contour perception triggered by these hallucinations.
Some schools believe that it is the lateral suppression of color that enhances the contrast and makes people perceive virtual lines. For example, when a neuron is excited by brightness, it suppresses the neurons in the darker areas around it, which makes the bright areas appear brighter and the dark areas appear darker. The brain may misinterpret the enhancement of contrast as a distinct contour and line[1] [2]。 Another theory suggests that this may be due to higher brain functions, such as brain supplementation through knowledge and memory. When our brains compare the images we see with past representations, they may feel that certain elements are missing, so they automatically “complete” these missing parts, forming a perception of virtual outlines [3]。 There are also many theories, such as that nerve concussions can combine fragmented features to form a perception of features that are not there [4]The cortical magnification factor carefully treats the central visual field and thus exaggerates the characteristics of certain stimuli, for example …
Lateral inhibition :* a conserved juxtaposition signaling mechanism that drives the formation of a variety of fine patterns such as spots and striped borders in initially near-homogeneous tissues during the development of most organisms (Ref. 9)
As for the neurophysiological mechanism of virtual contour perception, although scientists have done a lot of research, there are still many controversies. One of the competing models suggests that this neurophysiological mechanism occurs in the lower visual cortex (V1/V2) and then affects the higher cortex from the bottom up, while the other suggests that this process first localizes to the higher cortex, primarily the lateral occipital cortex (LOC), and then affects V1/V2 from the top down[5] 。
For the neon color diffusion illusion, some studies suggest that V3 and V4 have a considerable impact on shape-related color filling phenomena[6] [7]; At the same time, there are some studies that suggest that cortical activity associated with color appearance resulting from edge-induced filling or uniform surface chromaticity is associated with complementary patterns of activity in dorsal (V3A and V3B/KO) and ventral visual flow (V3v, hV4, and LO). (Figure 4).
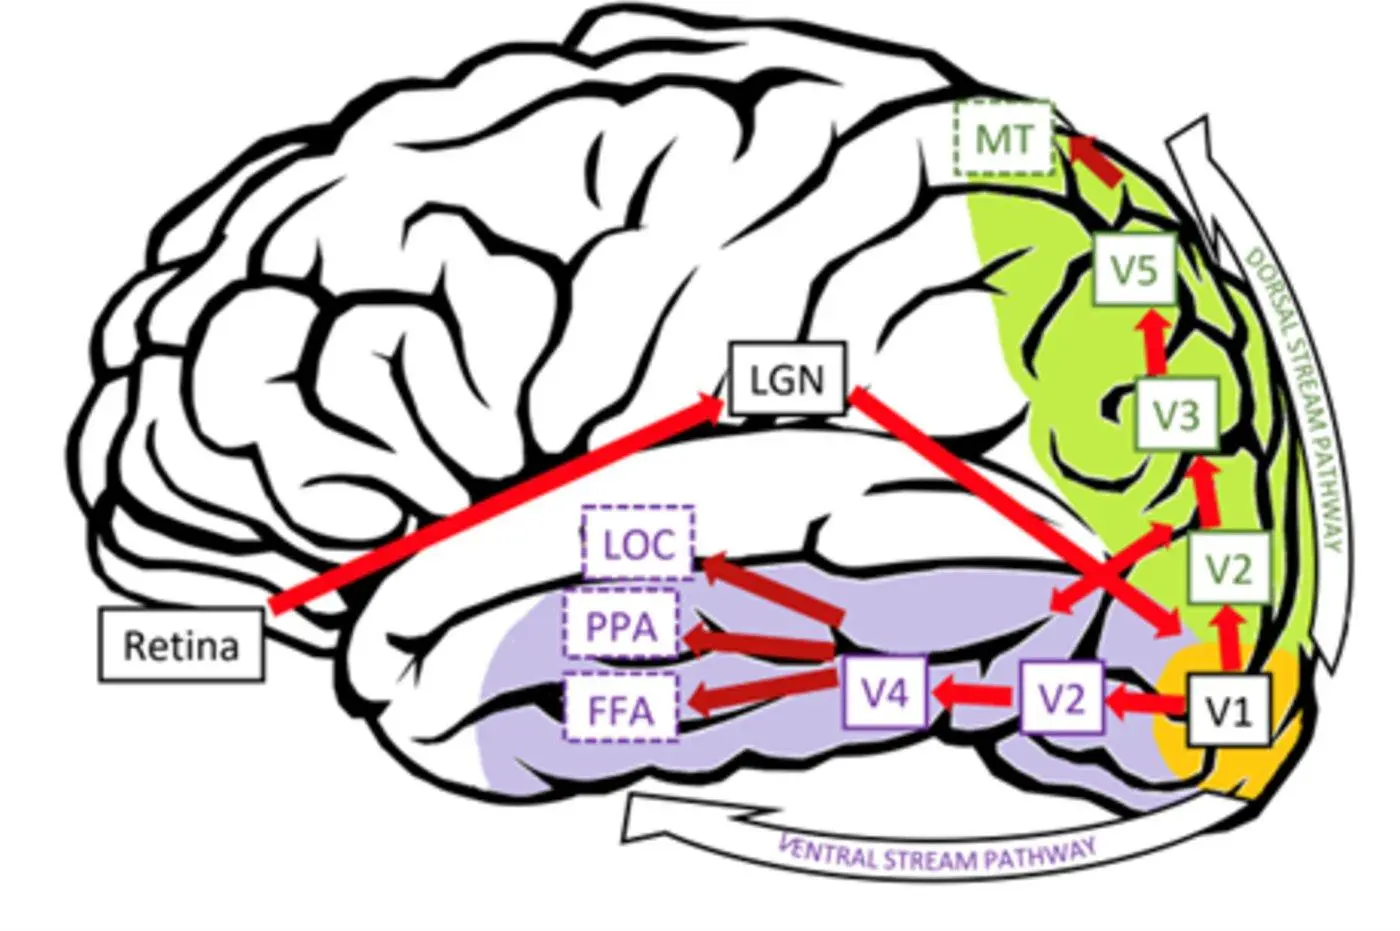 Figure 4: Various functional regions and pathways in the visual cortex. Source: Ref. 7.
Although these theories provide some explanation for the algorithmic and physiological mechanisms of hallucinations, it is still unclear how these visual hallucinations are represented in the mind, and it seems impossible to verify them.
When we see hallucinations, do we really “see” them?
Can we really be sure that we are using “hallucinations” to characterize the stimuli that cause hallucinations?
Reconstructing Hallucinatory Images
A recent paper published in Science Advances tested the two types of visual hallucinations mentioned above and successfully reconstructed images of lines and colors consistent with the hallucinatory experience, demonstrating the effectiveness of the model in materializing subjective experiences[8] 。
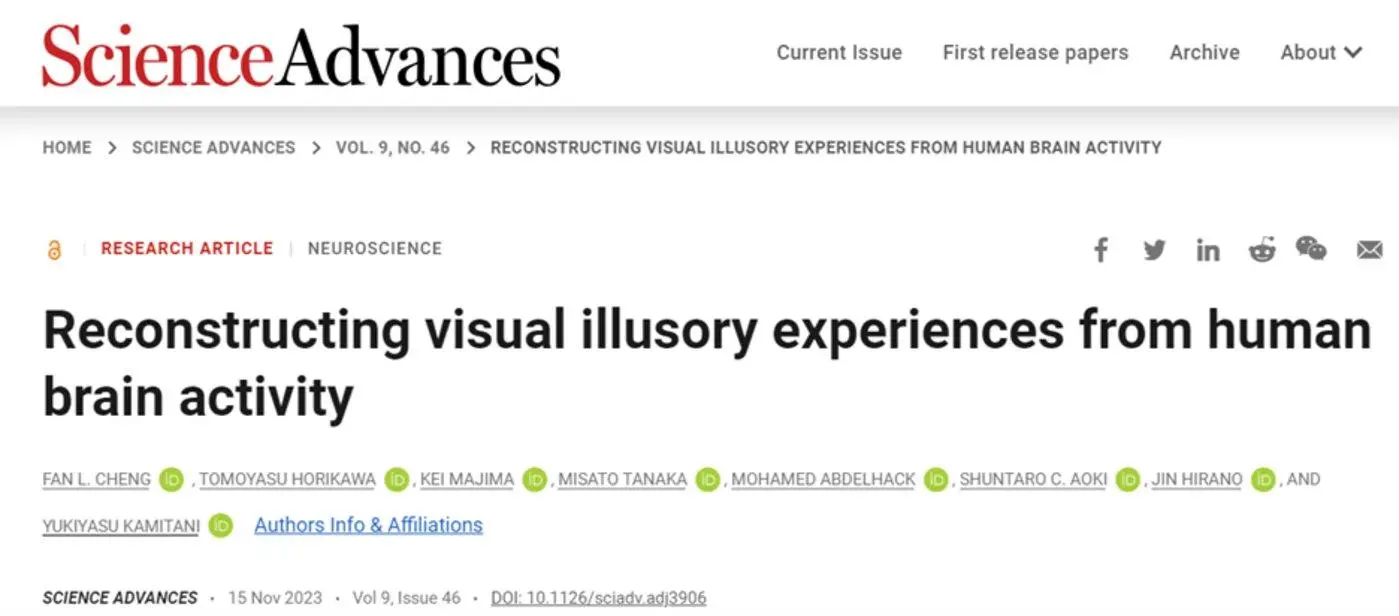 ▷Figure 1: Cover page of the paper. Source: Reference 8
In the experiment, the researchers asked 7 subjects to view three or more visual hallucination images and their corresponding control images and positive control images. **For each illusion, the control picture has been changed. For example, the control image of the interleaved raster illusion greatly reduces the density of the fence, the control image of the Ehrenstein hallucination, in which the tail end of the line that originally caused the hallucination is lighter, while the positive control image changes the radiant center of the line to a light circle, and the control image of the Wallin hallucination removes the black part of the hallucinatory stimulus (the original visual inducement), while the positive control image changes the central part to a lighter color square (see Figure 5 for details).
The images flashed at a frequency of 0.625 Hz for 8 seconds each and were repeated 20 times each. Throughout the experiment, functional magnetic resonance imaging (fMRI) was used to record brain activity as participants watched the images.
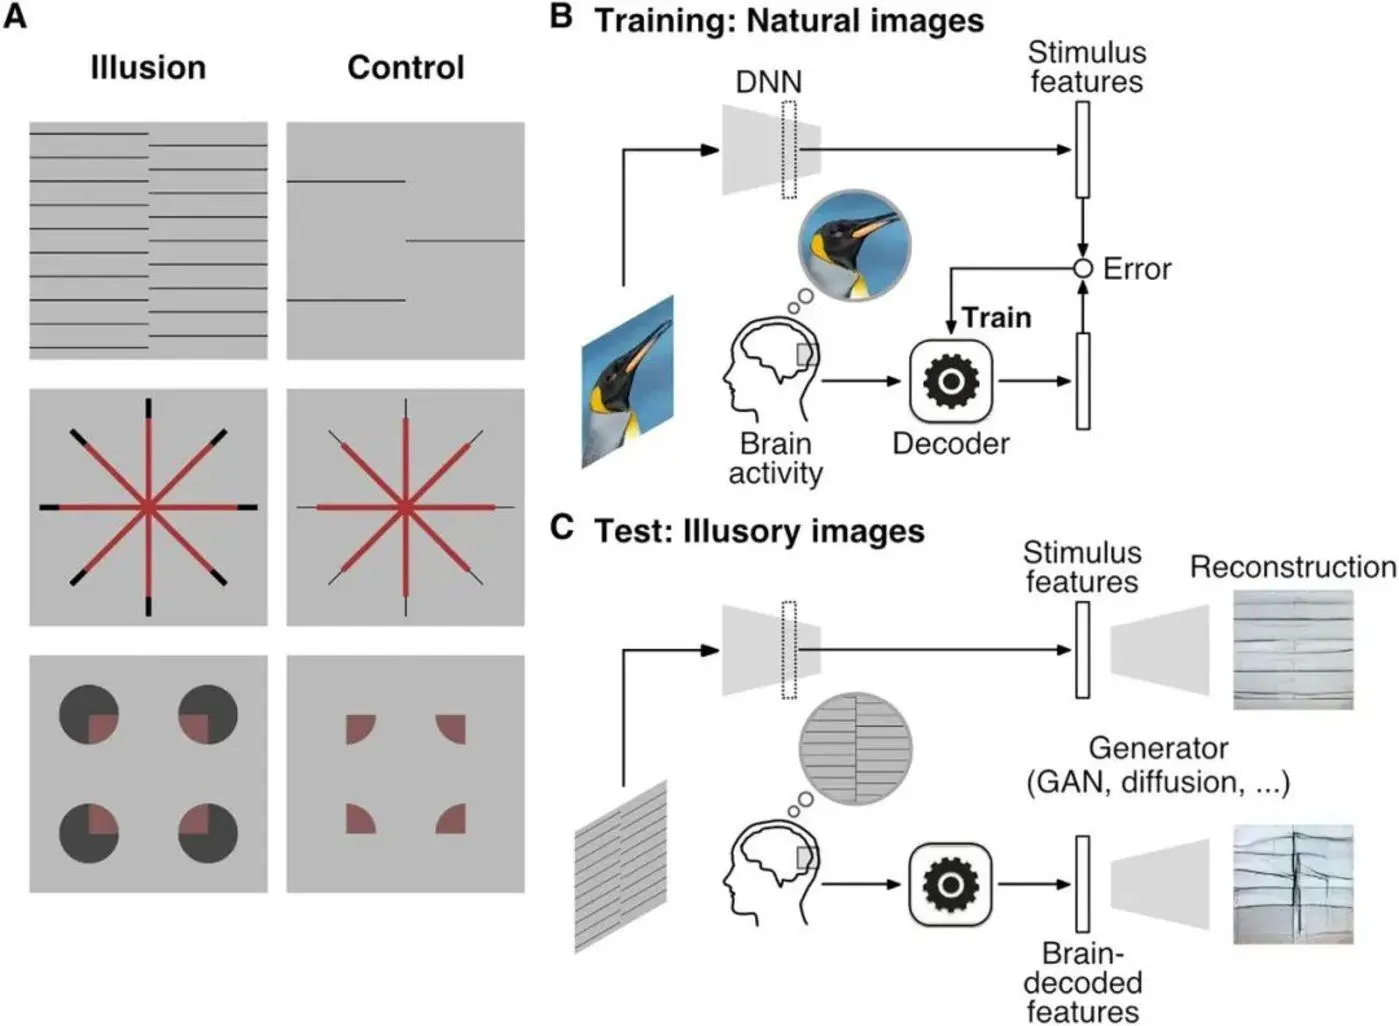 Figure 5: The left column of Figure A is the stimulus that induces the hallucination, and the right column of Figure A is the control stimulus corresponding to the stimulus that induces the hallucination. The first line of Figure A is a staggered raster hallucination, the second line of Figure A is an Ehrenstein hallucination, and the third line of Figure A is a Wallin hallucination. Figure B shows the process of training a DNN using natural images. Figure C shows the brain activity shown in the DNN decoding fMRI data as the stimulus features and the process by which the generator generates a picture based on the DNN decoding results. Source: Science
Next, the researchers fMRI collected brain data was fed into a trained deep neural network (DNN) for decoding. This DNN is a variant of AlexNet, the BAIR/BVLC CaffeNet model, designed by Alex Krizhevsky, director of Open AI. This is a convolutional neural network using a forward propagation algorithm that has been pre-trained to classify 1,000 objects in the ImageNet image database.
** The results showed that the images reconstructed from the mental representations of hallucinatory stimuli exhibited hallucinatory properties. In contrast, images reconstructed directly from the nature of the stimulus itself do not exhibit hallucinatory properties. This also shows that the nature of the hallucination reconstructed from the mental representation is not constructed by the nature and processing of the DNN, but by the nature of the mental representation itself (see Figure 6).
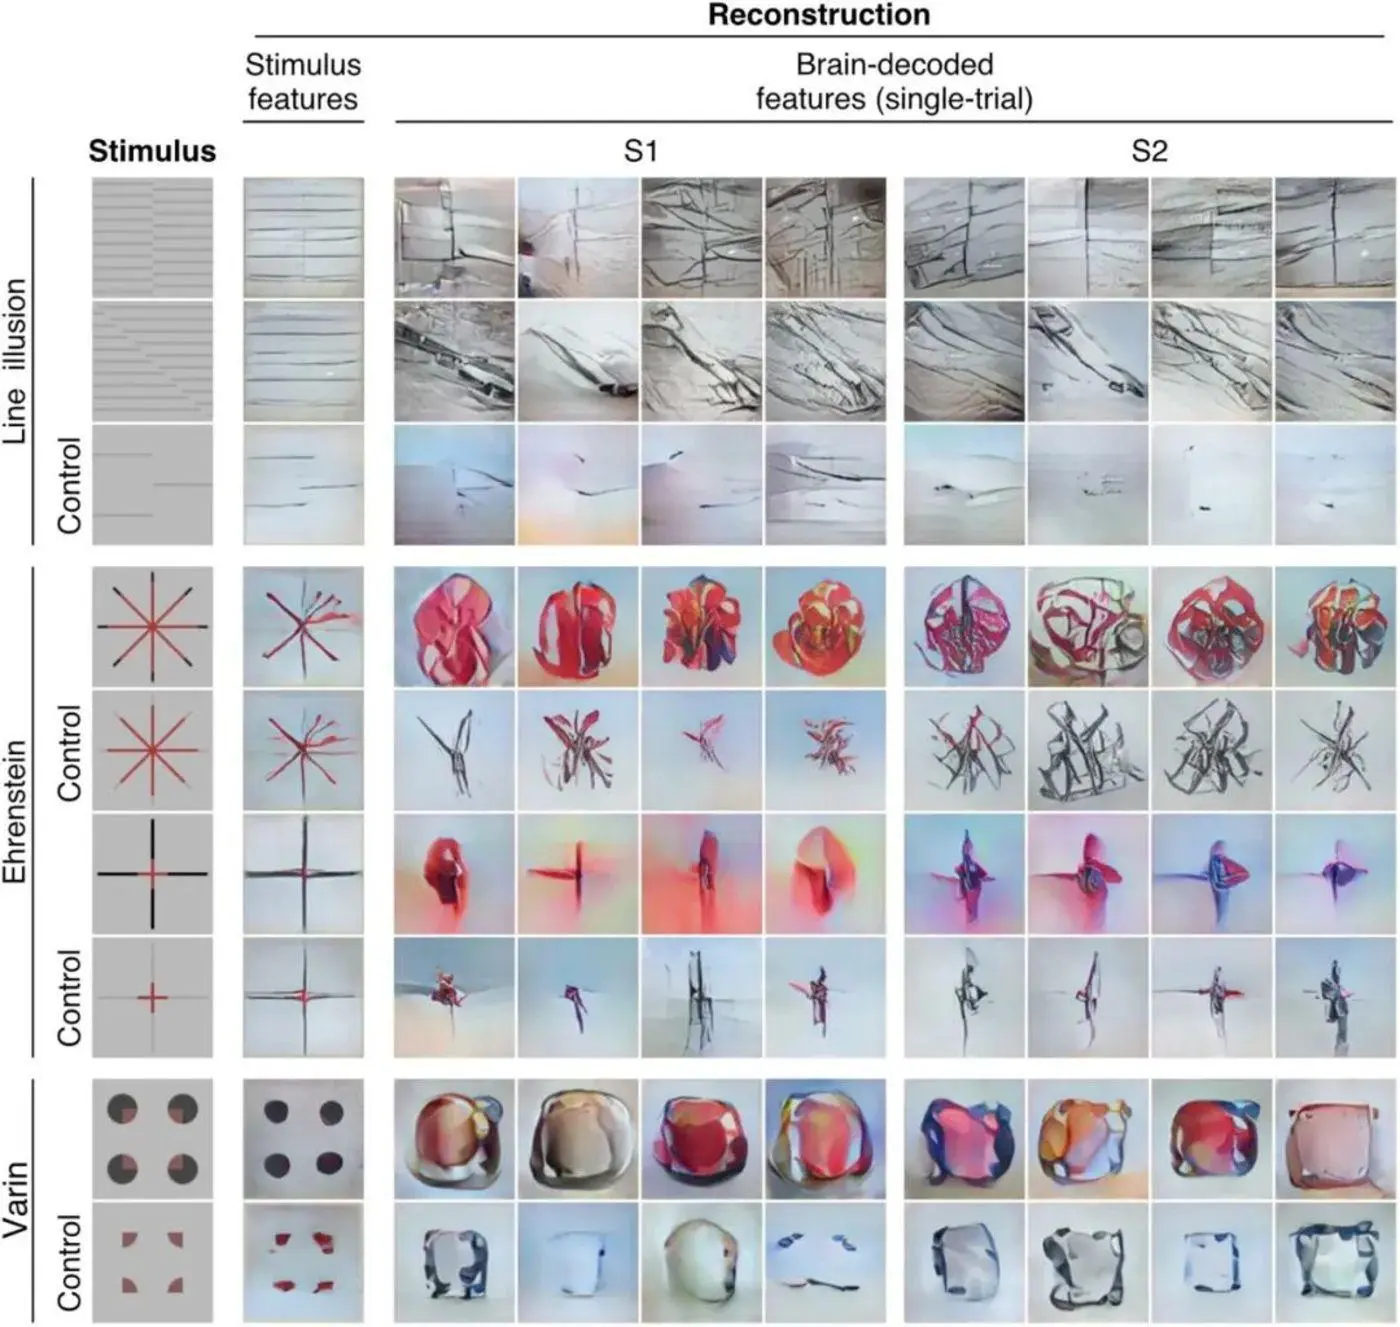 Figure 6: The leftmost column is the stimulus picture. The second column on the left is a picture of the DNN reconstructed from the data of the stimulus image itself in the leftmost column. Figures 3-6 are mental representations reconstructed from the brain activity generated by the leftmost stimulus image of Subject 1. Figures 7-10 are mental representations reconstructed from brain activity generated by the leftmost stimulus images of the two pairs. Lines 1-3 of Figure 1-3 are images of the staggered grating illusion. The first row is about the staggered grating illusion of two columns of grating arrays arranged along 90 degrees, the second row is about the illusion of staggered grating of two columns of grating arranged along 45 degrees, and the third row is about the control of the staggered grating illusion. Lines 4-7 are all pictures of Ehrenstein’s hallucinations. The fourth and sixth lines are about the Ehrenstein hallucination, four has 8 strings and six has 4 lines. Lines 5 and 7 deal with the control of the Ehrenstein hallucination, with five having 8 lines and seven having 4 lines. Lines 8-9 of Figure 8-9 are pictures of Wallin’s hallucinations. The eighth act is a Wallin hallucination, and the ninth act is controlling. Source: Science
**The study is unique in that the images are decoded from data from all visual cortex recorded on fMRI, and that the reconstructed mental representations generally show features that are more hallucinatory in nature than the stimulus itself. **
In the case of interlaced raster hallucinations, the illusory line in the hallucinatory stimulus appears to be much more pronounced than the lines covered by any stimulus itself, while the mental representations reconstructed from the control stimulus do not indicate this; in the case of neon color diffusion hallucinations, in the Ehrenstein hallucination, the part of color diffusion is much larger than in the control section; in the Wallin hallucination, although the control stimulus still shows the outline of the diffusion shape, the part of color diffusion is still much larger than in the control part. Moreover, the control of the stimulus itself is designed only to inhibit the diffusion of color rather than the contour of shape, so in the case of the Wallin hallucination, the hallucinatory property is stronger than the stimulus in the mental representation, and this property is still valid.
Quantifying the Illusion of Reconstruction
The intensity of the hallucinations is not only reflected in the reconstructed images, but can also be quantified through a range of methods. This paper provides a detailed quantitative analysis of the intensity of hallucinations in the mental representations produced by staggered grating hallucinations and neon diffusion hallucinatory stimuli.
The researchers used the Radon Transform to analyze the hallucinatory properties of the staggered grating illusion, that is, the intensity of the virtual lines between the gratings. **As a widely used method for analyzing radiographic data, the Ladong transform can mathematically reconstruct the shape of the original object from the integral values (e.g., density, mass, etc.) obtained by projecting the object from all directions, while only the side description can be known. **
In this study, the Ladong transform is applied to image analysis, and the main direction of line distribution in the reconstructed graph is obtained by summing up the “pixel values” obtained by projecting the image from all directions. Experiments have shown that for all the data on the visual cortex on fMRI, the predominant directions in the reconstructed images show a bimodal distribution, in which about 61.1% of the predominant directions are closer to the predominant direction of the hallucination than to the visually induced direction.
It is evident from the graph that the vertical absolute values in the bimodal distribution in the main direction of the reconstructed image are higher and more clustered than those in the transverse absolute values. As the number of gratings (lines) in the hallucinatory stimuli decreases, the vertical absolute value begins to decrease relative to the transverse absolute value within the bimodal distribution of the main direction in the reconstructed image of the stimulus by mental representation, and the transverse absolute value is significantly higher than the vertical absolute value in the control stimulus. **This result supports the theory that a reduction in the number of gratings (lines) will reduce the degree of hallucination. **
At the same time, the main direction of the hallucinatory concentration area is close to the main direction of the reconstructed image, while the main direction of the non-hallucination area (the area where the visual induction is mainly concentrated) is not close to the main direction of the reconstructed image. This proves that the area in which the hallucinations are located in the reconstructed image is between the two sets of gratings as perceived (see Figure 7B, C, D, E).
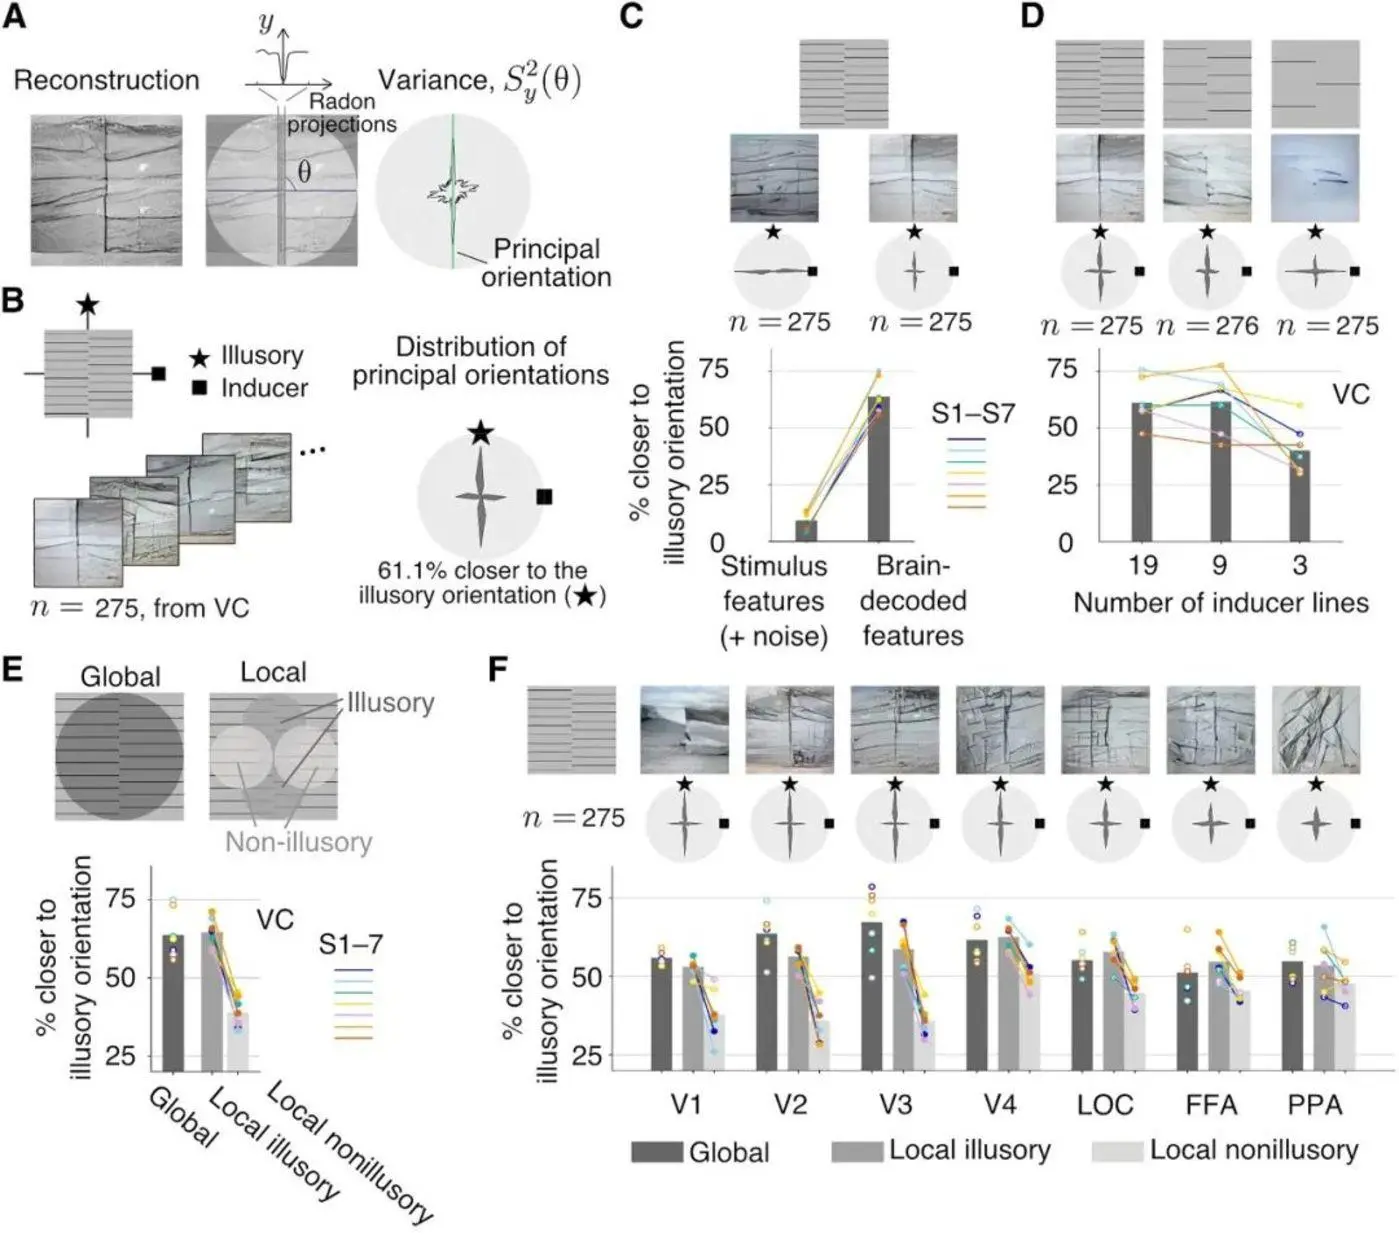 Figure 7: Figure A illustrates the process of the Ladong transformation. Figure B shows that 61.1% of the main directions of the reconstructed picture are closer to the main direction of the hallucinations relative to the induced main direction. Figure C shows that the main direction of the stimulus score is significantly closer to the main direction of induction. Figure D shows that the smaller the number of lines, the closer the main direction of the picture is to the main direction of the inducement. Figure E shows that the main direction of the hallucinatory concentration area is also close to the main direction of the reconstructed image Figure F shows the mental representation reconstructed from the data extracted from different areas of the visual cortex, and V1-V3 is more hallucinatory. Source: Science
The researchers also used linear regression to analyze the hallucinatory nature of the Ehrenstein and Wallin hallucinations, that is, the degree to which the color diffuses outward (forming a translucent plane) from the lines given by the stimulus. They constructed a “redness map” based on the RGB values of the pixels in each image, respectively, for the reconstructed images of hallucinatory mental representations, control mental representations, and positive control mental representations, as well as for the stimulus images and expected subjective hallucinatory images.
Next, the researchers attempted to fit the redness map of the mental representation with a redness map of the stimulus and the expected subjective hallucination. Expected subjective hallucinations and stimuli each have a coefficient (β1 and β2) to fit, and these coefficients represent their respective weights in reconstructed mental representations. That is, the more parts that reconstruct the red part of the mental representation, the greater the coefficient β1. This is because only the subjective hallucinations that are redder at the time of perception have a greater proportion of the subjective hallucinations that make mental representations appear redder (see Fig. 8C, D, G, F).
The results of linear regression showed that based on all the data on the visual cortex from fMRI, the subjective hallucination coefficients of both stimuli that elicited neon-colored diffuse hallucinations were greater than those of the control stimulus and smaller than those of the positive control stimulus. However, the subjective hallucination coefficient of Walling’s hallucination, although greater than that of control, was significantly smaller than that of Ehrenstein’s hallucination (see Fig. 8E, F, I, J).
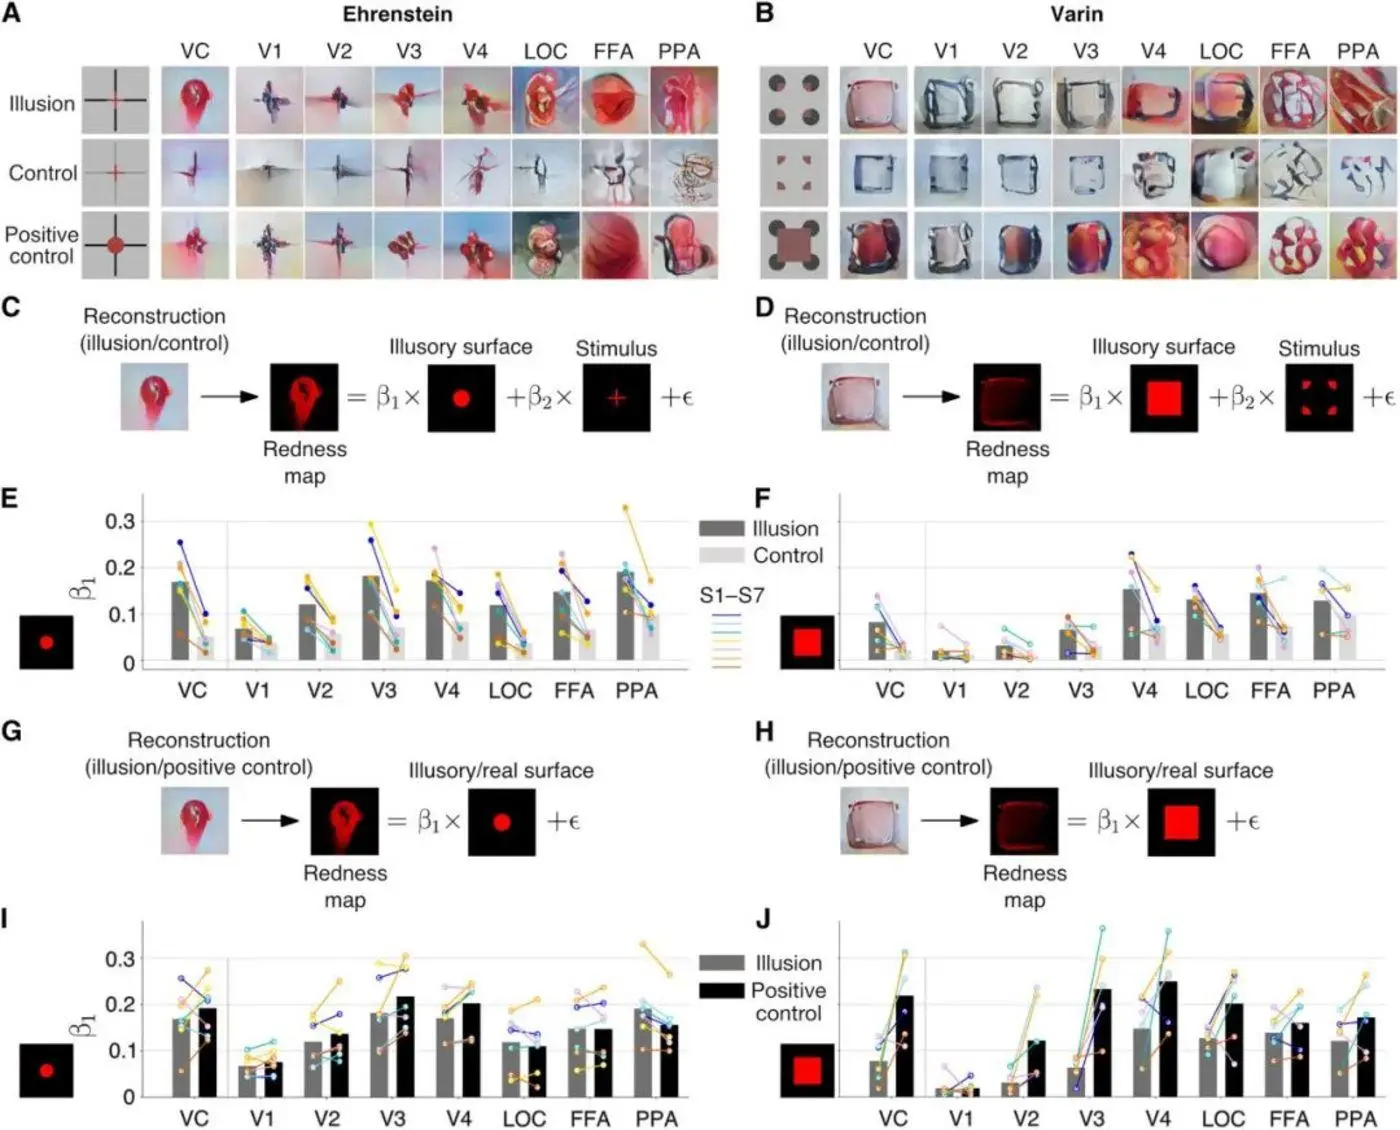 Figure 8: Figure A illustrates the Ehrenstein hallucination, with its control and positive control in different visual cortex regions. Panel B illustrates the Wallin hallucination, the representation of its control and positive control in different visual cortex regions. Panel C shows how linear regression is calculated comparing the Ehrenstein hallucinations and the redness plot under their control. Panel D shows how the linear regression of the contrasting Wallin hallucinations and the redness map they control is calculated. Panel E shows the proportion of the hallucinatory properties of Ehrenstein’s hallucinations relative to the properties of the control hallucinations in each visual cortex region. Figure F shows the proportion of the hallucinatory properties of the Wallin hallucinatory properties relative to the control hallucinatory properties in the various visual cortex regions. Panel G shows how linear regression is calculated for comparing the Ehrenstein hallucient with its positively controlled redness plot. Panel H shows how the linear regression of the contrasting Wallin hallucinations and their positively controlled redness plots is calculated. Figure I shows the proportion of the hallucinatory properties of Ehrenstein’s hallucinations in each visual cortex region relative to the positive control hallucinatory properties. Figure J shows the proportion of the hallucinatory properties of Wallin in each visual cortex region relative to the positive control hallucinatory properties. Source: Science
Visual area corresponding to hallucination
The researchers not only reconstructed the mental representation of hallucinations in the entire visual cortex, but also reconstructed the psychological representations of hallucinations in each specific visual region in the cortex.
These visual regions are arranged in order from the middle and downstream to the upper reaches of the visual pathway (primary to higher functioning), including the primary visual cortex (V1), the secondary visual cortex (V2), the tertiary visual cortex (V3), the quaternary visual cortex (V4), the lateral occipital lobe complex (LOC), the fusiform gyrus (FFA), and the parahippocampal region (PPA).
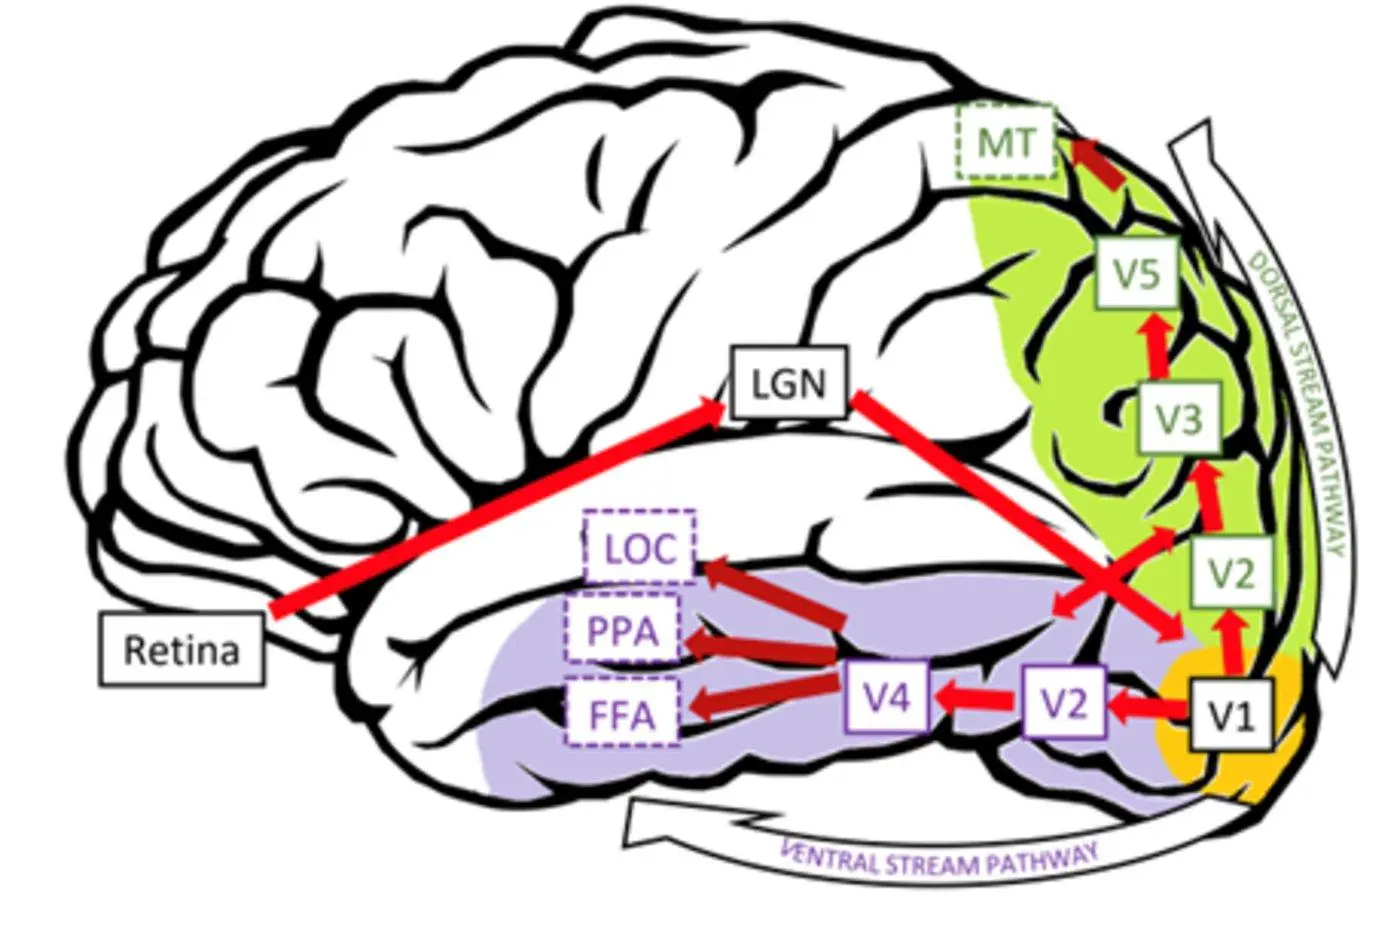 Figure 4: Diagram of various functional regions and pathways in the visual cortex. Source: Ref. 7.
After extracting fMRI data from different regions of the visual cortex and decoding and reconstructing the mental representations respectively, the researchers found that for staggered raster hallucinations, the hallucinatory properties were mainly reflected in V1 to V3 from the pictures alone, and the hallucinatory properties and stimuli in V4 and above regions were not clear. After quantifying the main directions of image reconstruction in each region, the researchers found that the hallucinatory nature peaked between V2 and V4 in the whole image domain, and peaked between V1 and V3 in the hallucinatory concentration domain. These results suggest that the characterization of lines is mainly focused on the early visual region (Figure 7F).
When dealing with neon color diffusion hallucinations, the visual cortex employs different strategies. The study showed that the hallucinatory nature of Ehrenstein’s hallucination was significantly reflected in each area of the visual cortex, which was consistent with the representation of the neon-colored nature of the positively controlling stimulus in each visual cortex region, while the hallucinatory nature of Walling’s hallucination was only significantly reflected in the area of the visual cortex at V4 and above, while the neon-colored nature of the positively controlling stimulus was also significantly reflected in V2 and V3. Combined with the results that the subjective hallucination coefficient of Wallin’s hallucination was smaller than that of the subjective hallucination of the Ehrenstein hallucination, this indicates that even if the nature of the hallucination is the same, different induction settings will cause different information processing methods in the visual cortex. **
When we have visual hallucinations, is it the top-down influence of the primary visual cortex from the higher regions down to construct the hallucinations, or is it caused by the primary visual cortex from the bottom up affecting the higher regions? Although this paper only presents the representations predicted in the previous theories from another perspective, rather than trying to construct a causal relationship between brain activity and the nature of hallucinations, its vivid presentation still provides us with some clues as to how the subjective experience is active in the brain.
Obviously, we can’t simply use one brain region to reconstruct the entire hallucinatory experience, and the induced cues will all have an impact on the mechanism of the same hallucinatory experience. It seems that a more complete theoretical framework is needed to understand the complex mechanism of hallucinations.
The next time you see those dazzling hallucinatory images, you may think of the hallucinations built by these models, the wonderful “advanced vs. beginner” contest that may be playing out in your brain, and then smile and marvel at the wonder of cognition.
References:
[1] . Elliott, S. L., & Shevell, S. K. (2013). “Perceived segmentation of center from surround by only illusory contours causes chromatic lateral inhibition.” This study suggests that illusory contours can invoke center–surround spatial antagonism to alter color appearance, indicating a cortical neural locus for lateral inhibition
[2] . Pak A, Ryu E, Li C, Chubykin AA. Top-Down Feedback Controls the Cortical Representation of Illusory Contours in Mouse Primary Visual Cortex. J Neurosci. 2020 Jan 15; 40(3):648-660. doi: 10.1523/JNEUROSCI.1998-19.2019. Epub 2019 Dec 2. PMID: 31792152; PMCID: PMC6961994.
[3] . Murray MM, Herrmann CS. Illusory contours: a window onto the neurophysiology of constructing perception. Trends Cogn Sci. 2013 Sep; 17(9):471-81. doi: 10.1016/j.tics.2013.07.004. Epub 2013 Aug 6. PMID: 23928336.
[4] . Gove, A., Grossberg, S., & Mingolla, E. (1995). Brightness perception, illusory contours, and corticogeniculate feedback Visual Neuroscience, 12(6), 1027-1052. doi:10.1017/S0952523800006702
[5] . J. F. Knebel, M. M. Murray, Towards a resolution of conflicting models of illusory contour processing in humans. Neuroimage 59, 2808–2817 (2012).
[6] . S. W. Hong, F. Tong, Neural representation of form-contingent color filling-in in the early visual cortex. J. Vis. 17, 10 (2017).
[7] . P. Gerardin, C. Abbatecola, F. Devinck, H. Kennedy, M. Dojat, K. Knoblauch, Neural circuits for long-range color filling-in. Neuroimage 181, 30–43 (2018).
[8] . Fan L. Cheng et al.,Reconstructing visual illusory experiences from human brain activity.Sci. Adv.9,eadj3906(2023). DOI:10.1126/sciadv.adj3906
[9] Cohen, M. et al. (2010) ‘Dynamic filopodia transmit intermittent delta-notch signaling to drive pattern refinement during lateral inhibition’, Developmental Cell, 19(1), pp. 78–89. doi:10.1016/j.devcel.2010.06.006
