![]() Trusted Editorial content, reviewed by leading industry experts and seasoned editors. Ad Disclosure
A crypto analyst has drawn a striking comparison between XRP and the Russell 2000 index, a US stock market index that tracks the performance of smaller publicly traded companies. Based on the similarities found between the two assets, the analyst has suggested that the altcoin could be setting up for an explosive move into price discovery
Trusted Editorial content, reviewed by leading industry experts and seasoned editors. Ad Disclosure
A crypto analyst has drawn a striking comparison between XRP and the Russell 2000 index, a US stock market index that tracks the performance of smaller publicly traded companies. Based on the similarities found between the two assets, the analyst has suggested that the altcoin could be setting up for an explosive move into price discovery
XRP Chart Mirrors Russell 2000 Index Trend
A new technical analysis by market analyst Austin compares XRP’s recent price action with historical price movements of the Russell 2000 index. In an X post, the analyst shared two parallel charts, explaining that in late 2021, the Russell 2000 underwent a massive rally followed by a lengthy period of accumulation and consolidation from 2022 through most of 2024
Related Reading: Analyst Says XRP’s $15 Target Has Still Not Changed – Here’s WhyWhen the small-cap index eventually retested its all-time highs in late 2024, it formed a sharp Elliott Wave ABC corrective pattern that shook out weak hands. Following this, the index staged a dramatic V-bottom reversal in early 2025 and broke out into full price discovery territory
According to Austin’s analysis, XRP’s current chart appears to mirror a nearly identical blueprint to the Russell 2000 price action between 2021 and 2025. After its own massive pump and prolonged accumulation phase, XRP recently surged to retest its previous all-time high resistance near the $3.30 level on the chart. Following that retest, the cryptocurrency entered a similar ABC correction, mirroring almost step by step the movements of the Russell 2000 before its explosive breakout
![XRP]() Source: Chart from Austin on XNotably, the chart reveals that the A and B waves of the corrective three-wave pattern have already completed, and the price is currently working through the C wave. The chart structure suggests a potential crash to the $1.00-$1.27 range before any meaningful reversal attempt. If this occurs, it would represent a decline of roughly 5.22%- 25.37% from current levels of around $1.34
Source: Chart from Austin on XNotably, the chart reveals that the A and B waves of the corrective three-wave pattern have already completed, and the price is currently working through the C wave. The chart structure suggests a potential crash to the $1.00-$1.27 range before any meaningful reversal attempt. If this occurs, it would represent a decline of roughly 5.22%- 25.37% from current levels of around $1.34
The key question Austin is now asking is whether the token is on the verge of the same V-bottom inflection point that was observed in the Russell 2000 chart. If history repeats and structural parallel holds, the analyst suggests that the XRP correction currently unsettling holders could be the final shakeout before a launch into price discovery
Analyst Shares Targets For Price Discovery
The most important aspect of the Russell 2000 analysis is the potential for XRP to enter price discovery mode and begin trading above its 2018 all-time high. The green arrow projection on the price chart points toward price discovery targets well above $5
Related Reading: XRP’s Macro Plan Hasn’t Changed, And This Target Remains ValidOnce XRP completes its wave C correction, Austin predicts that the cryptocurrency could rapidly launch to the $7.5 to $10 range. With its price still hovering below $1.4, a breakout to $10 would represent a staggering increase of more than 645%
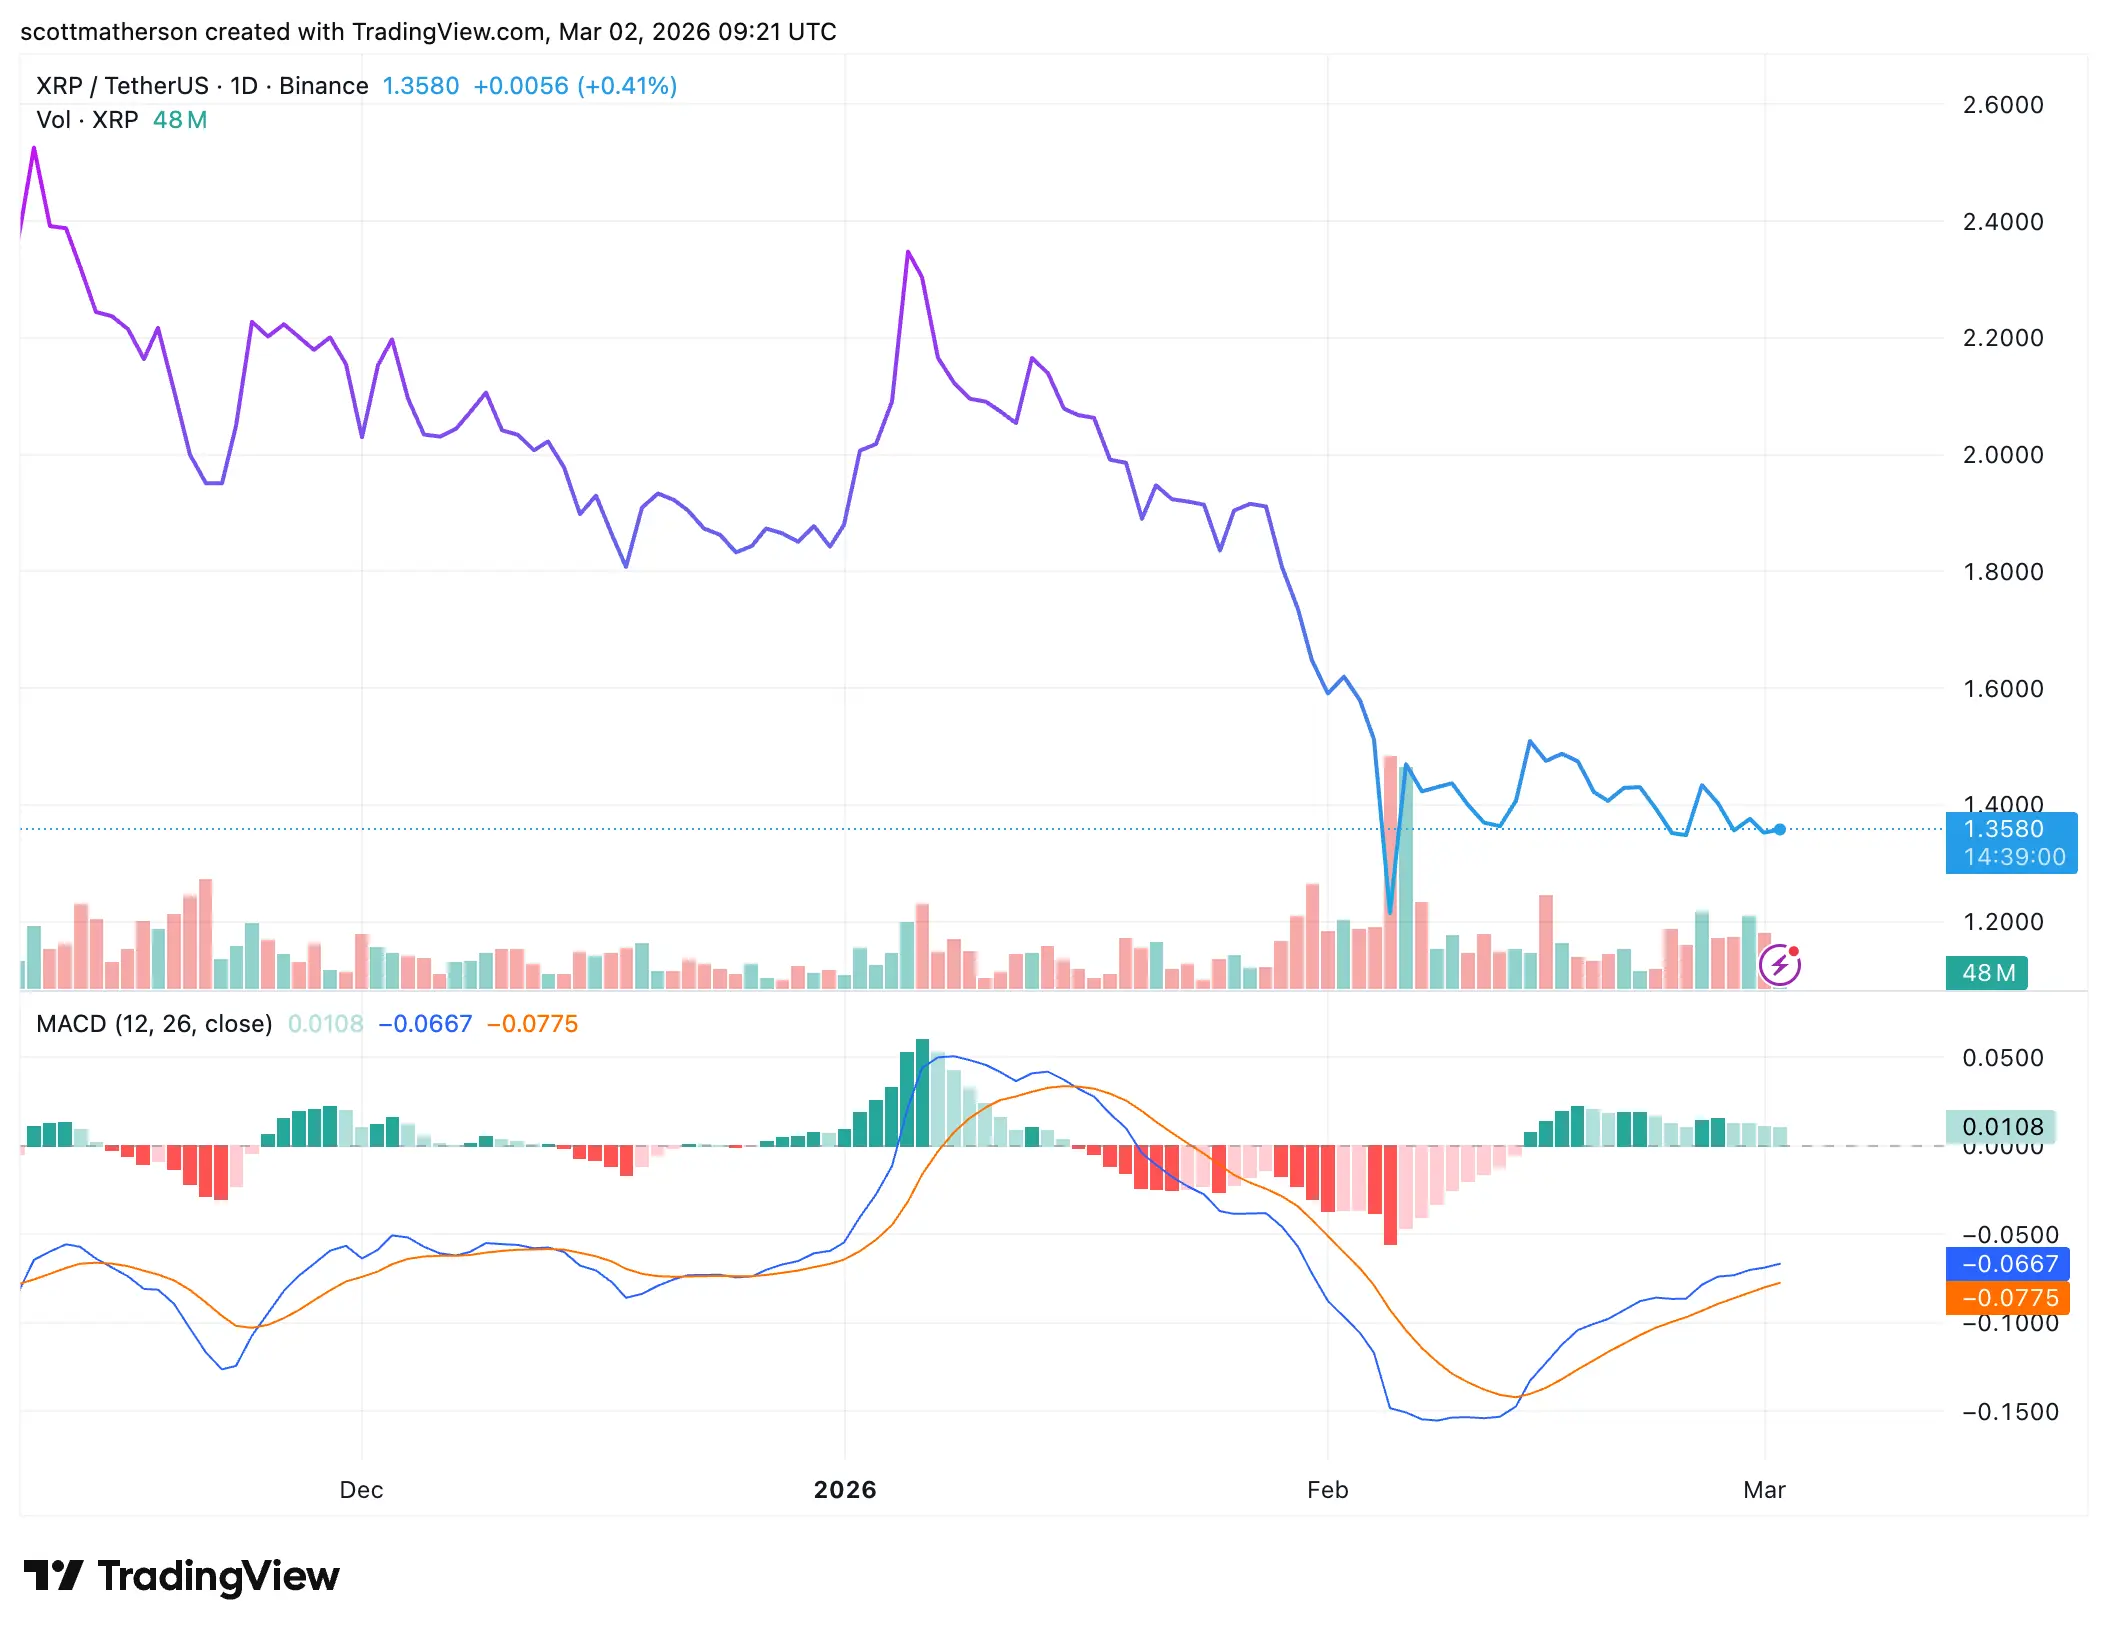 XRP trading at $1.35 on the 1D chart | Source: XRPUSDT on Tradingview.comFeatured image from Adobe Stock, chart from Tradingview.com
![]() Editorial Process for bitcoinist is centered on delivering thoroughly researched, accurate, and unbiased content. We uphold strict sourcing standards, and each page undergoes diligent review by our team of top technology experts and seasoned editors. This process ensures the integrity, relevance, and value of our content for our readers.
Editorial Process for bitcoinist is centered on delivering thoroughly researched, accurate, and unbiased content. We uphold strict sourcing standards, and each page undergoes diligent review by our team of top technology experts and seasoned editors. This process ensures the integrity, relevance, and value of our content for our readers.
Disclaimer: The information on this page may come from third parties and does not represent the views or opinions of Gate. The content displayed on this page is for reference only and does not constitute any financial, investment, or legal advice. Gate does not guarantee the accuracy or completeness of the information and shall not be liable for any losses arising from the use of this information. Virtual asset investments carry high risks and are subject to significant price volatility. You may lose all of your invested principal. Please fully understand the relevant risks and make prudent decisions based on your own financial situation and risk tolerance. For details, please refer to
Disclaimer.
Related Articles
What next as XRP rises to $1.33 but fails to break out
XRP is currently trading around $1.33, showing slight upward movement but lacking a breakout. Volume is up, indicating potential positioning rather than strong conviction. Key price levels to watch are $1.30 as support and $1.34-$1.35 as resistance, with XRP remaining range-bound in the meantime.
CoinDesk16h ago
XRP Holds Ground as Inflows Rise but Price Trails Highs
Key Insights:
XRP trades about 60% below its peak despite steady ETF inflows, reflecting a gap between improving fundamentals and current market valuation levels.
Institutional exposure through XRP ETFs reached 1.1 billion dollars, yet analysts say inflow scale remains too small to
CryptoFrontNews04-03 07:16
Crypto Price Prediction For Today, April 3: Cardano (ADA), Bitcoin (BTC), XRP
Crypto markets moved into April with a cautious tone, and the latest price action across Cardano, Bitcoin, and XRP shows a similar pattern.
Prices are not collapsing, yet buyers have not shown enough strength to push markets back toward recent highs. That balance between weak demand and
CaptainAltcoin04-03 07:10
