
Market technician Patrick Karim shared a striking long-term chart this week with a simple message:
“Crude Oil. Whatever happens on the Monday open is irrelevant on the longer-term roadmaps. The pathway for higher prices for crude oil has been laid out by silver & gold.”
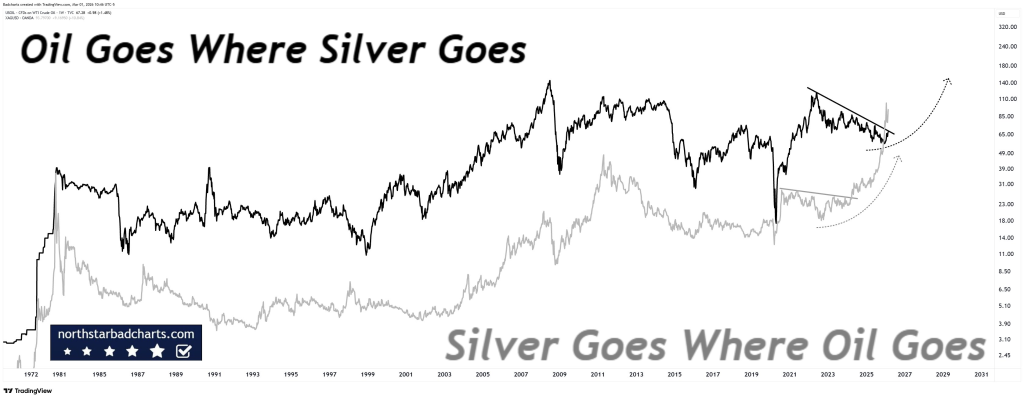
The chart compares decades of price action between crude oil and silver. One line tracks oil. The other tracks silver. The message is visual and blunt: major structural moves in silver tend to precede or align with large directional changes in oil.
This is about multi-year structure.
What the Long-Term Chart Is Showing
The chart stretches back to the 1970s. Across multiple cycles (inflation spikes, recessions, commodity booms, and crashes) oil and silver move in broad alignment during major macro phases.
When precious metals enter structural uptrends, oil often follows.
Right now, silver has already broken into a powerful bull phase. After consolidating for years, it exploded higher, printed new highs, corrected sharply, and is now rebuilding structure near key resistance. The longer-term pattern shows higher highs and higher lows across the macro timeframe.
Oil, by contrast, has been compressing.
Source: X/@badcharts1
On Karim’s chart, crude appears to be forming a large multi-year consolidation with a descending trendline capping recent rallies. Price has pulled back from prior highs but has not broken down structurally. It looks coiled.
There’s also a curved projection sketched on the right side of the chart. That projection mirrors silver’s prior breakout path and implies that oil could follow a similar expansion phase once resistance gives way.
The implication is clear: metals have already signaled the inflationary pressure. Oil may simply be lagging.
Read also: ChatGPT Predicts the Price of Silver and Gold If the U.S.–Iran War Escalates Further
Why Silver and Gold Could Be Leading
Precious metals tend to respond first to monetary instability, currency debasement fears, and geopolitical stress. They move when capital seeks protection.
Energy often reacts later, when inflation pressure feeds directly into supply chains and real-economy pricing.
Silver’s breakout above long-standing resistance indicates that liquidity conditions and inflation expectations are shifting. Gold has also remained structurally strong despite volatility in equities and crypto.
If metals are in the early phase of a broader commodity cycle, oil would not stay suppressed for long.
Karim’s point about the Monday open being irrelevant speaks to this idea. Short-term gaps driven by headlines do not change multi-year trend structure. Weekly and monthly charts define the real roadmap.
As long as crude oil holds its long-term support zones and continues compressing beneath that descending resistance, the setup resembles a classic coil before expansion.
A decisive breakout above that multi-year trendline would likely trigger momentum flows and repositioning across commodity markets.
If silver continues higher, Karim’s thesis indicates oil will not remain behind for long.
Read also: Strait of Hormuz Freeze: Oil Tankers Turn Back as War Risk Insurance Vanishes Overnight
Disclaimer: The information on this page may come from third parties and does not represent the views or opinions of Gate. The content displayed on this page is for reference only and does not constitute any financial, investment, or legal advice. Gate does not guarantee the accuracy or completeness of the information and shall not be liable for any losses arising from the use of this information. Virtual asset investments carry high risks and are subject to significant price volatility. You may lose all of your invested principal. Please fully understand the relevant risks and make prudent decisions based on your own financial situation and risk tolerance. For details, please refer to
Disclaimer.
Related Articles
BTC is trading in a tight range around $67,000, and SOL futures open interest hits a new two-month high
On April 3, the crypto market continued to trade in choppy conditions. Bitcoin was consolidating around $67,000, maintaining its broader downward trend that began last October. The futures market saw thin trading, with Solana futures open interest hitting a new high, and the volatility index falling to its lowest level since February. Market structure indicates that short positions are increasing.
GateNews39m ago
Crypto consolidates as volatility cools and futures markets tilt bearish
The crypto market continued to exhibit signs of choppiness on Friday, with bitcoin BTC$66,729.05 trading at $67,000 in the middle of a trading range that spans back to early February.
A selection of altcoins picked up during the lower liquidity Asia hours, prompting the likes of ALGO and RENDER to
CoinDesk43m ago
Reputed Crypto Trader Calls the Bottom at $54,000 BTC Price, Bullish Expectations Grow
Reputed crypto trader calls the bottom at $54,000 BTC price.
This led to a massive surge in price pump expectations.
The price of BTC could rally towards new ATH prices after the bottom is set.
The price of Bitcoin (BTC) continues to trade in the $66,000 price range, hinting at
CryptoNewsLand1h ago
Bitcoin price repeats a downward pattern as the third wave begins; BTC’s key support at $65,636 is being tested
Bitcoin’s price is trading in a tight range around $67,044, moving within a downtrend channel. The third wave of decline has already retraced by about 5%. Technical indicators show that price momentum is weakening, and short-term holders face losses. Key support levels are $65,750 and $64,920; if those levels break, the price could test as low as $57,883. Investors should monitor market conditions and manage risk cautiously.
GateNews2h ago
Can Ethereum’s “Megawhale” betting $2.6 billion stop a pullback? ETH could face a 43% downside risk
The Ethereum price is trading in a range near $2,055, facing the risk of a technical pullback. Although a whale has increased its holdings, price momentum is weakening. Investors should watch the key support level at $2,024 and potential market pressure, which could lead to further downside. Investors should carefully evaluate the potential impact.
GateNews2h ago
Algorand price surges 23%, triggering a crypto market frenzy as Google's AI whitepaper integrates with Revolut
Algorand (ALGO) price surged 23% within 24 hours, mainly driven by Google’s quantum AI whitepaper, with Algorand cited multiple times. The 24-hour trading volume jumped 429%, drawing institutional investors’ attention. The ALGO price rebounded to $0.1052, still below its all-time high, so the market needs to closely watch the subsequent trend.
GateNews2h ago
