The Cardano price has been grinding lower for months now. Since late 2025, each bounce has topped out beneath the last one, and sellers have consistently stepped in before any real recovery could take shape. But there is now a growing argument that the worst may already be behind it.
Analyst Mr Brownstone pointed out on X that there is a legitimate chance the February 2026 low marked the end of a larger corrective phase.
His view is based on Elliott Wave structure, specifically the idea that a PRIMARY WAVE (2) may have completed at that low. It’s an optimistic take, but one that still requires confirmation.
What the Cardano Chart Is Showing
On the 4H chart, the ADA price dropped sharply into the February low around the $0.22 area. That level clearly stands out as a major pivot, as price reacted quickly and bounced from it. Since then, the fall has slowed down, and ADA has begun to establish a range rather than continuing to plummet lower.
The alternative wave count, shown in yellow, indicates that the overall correction may have ended at that stage. If that interpretation is correct, ADA would now be transitioning from a prolonged correction into the early stages of a new upward phase.
However, the analysis also makes it clear that confirmation is not immediate.In order for the overall bullish pattern to be confirmed, the Cardano price must reclaim $0.74. Until then, this is a developing pattern and not yet a reversal.
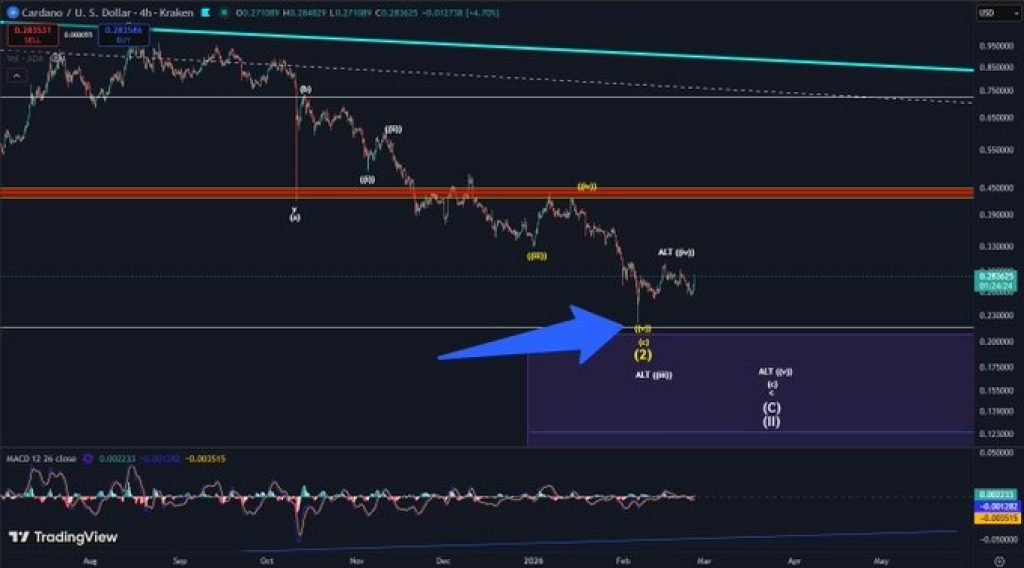
Source: X/MrBrownStone
Cardano Price Key Level Bulls Must Defend
The most important level on the chart right now sits near $0.222. That February low is the line separating optimism from another wave down.
However, if the ADA price declines from the current levels and creates a higher low above the $0.222 level, it would further reinforce the argument for the bottom already being in.
If ADA pulls back and forms a higher low, it would show that sellers are losing control and that buyers are stepping in sooner than they did during the previous drops.
_****TAO vs. Other AI Cryptos: Why Bittensor Is Different (And Why It Could Be the Bitcoin of AI)**
But if price slips under $0.222, that idea falls apart. At that point, the market would be signaling that the correction still has unfinished business. In that case, the market may need one more deeper flush before the correction truly ends.
According to the analysis, even that scenario could represent the final phase of the pullback, but it would delay any strong recovery narrative.
The Cardano price is no longer falling in a straight line. The panic phase has eased, and the chart looks more like it’s catching its breath than breaking down. Sellers aren’t pressing with the same force, and price is hovering instead of sliding.
The real test comes on the next dip. If buyers step in before $0.222 gives way, this stretch could end up being the floor. If that level cracks, the market likely isn’t done cleaning itself out.
Disclaimer: The information on this page may come from third parties and does not represent the views or opinions of Gate. The content displayed on this page is for reference only and does not constitute any financial, investment, or legal advice. Gate does not guarantee the accuracy or completeness of the information and shall not be liable for any losses arising from the use of this information. Virtual asset investments carry high risks and are subject to significant price volatility. You may lose all of your invested principal. Please fully understand the relevant risks and make prudent decisions based on your own financial situation and risk tolerance. For details, please refer to
Disclaimer.
Related Articles
The mid-range trap of Solana – Here’s why traders should be cautious!
Solana (SOL) faces challenges after a Bitcoin surge, exhibiting mixed signals. Despite prior momentum, prices struggle to break resistance at $89.9. Current support is at $76.6-$89.9, with bearish indicators suggesting potential further declines despite possible short-term rebounds.
TapChiBitcoin19m ago
Analyst: The key resistance levels for ETH are at $2029 and $2079.
Gate News reports that on March 29, analyst Ali Charts stated that Ethereum's current key resistance levels are at $2029 and $2079; the support levels below are at $1881, $1584, and $1238.
GateNews34m ago
Bitcoin Prepares to Close March in Red, Making Its Sixth Consecutive Close, Why Is This Bullish?
Bitcoin prepares to close March in red.
This could mark its sixth consecutive close, a pattern seen before in 2018-2019.
Previously this pattern was printed, the price of BTC pulled a pump over 300%.
The crypto community is waiting with dread as they see how Bitcoin prepares to close Mar
CryptoNewsLand44m ago
We Asked 2 AIs: What Must XRP Do to Escape the Ongoing Crisis?
Alongside the rest of the crypto market, Ripple’s cross-border token tried to break out in the middle of the business week, surging to a monthly peak of over $1.60. However, the subsequent rejection pushed it south to under $1.50 as of press time.
Even the most recent developments on the Ripple
CryptoPotato50m ago
