On February 26, news reports indicate that Solana (SOL) price rebounded strongly in the past 24 hours, rising over 10%. It quickly climbed from a two-week low of $75 to nearly $89, driven mainly by a renewed market risk appetite. As Bitcoin recovered to the $66,800–$68,000 range, the total crypto market capitalization also recovered to approximately $2.28 trillion–$2.38 trillion. Mainstream assets generally strengthened, with Ethereum, XRP, and Dogecoin all recording gains to varying degrees.
 (Source: Farside Investors)
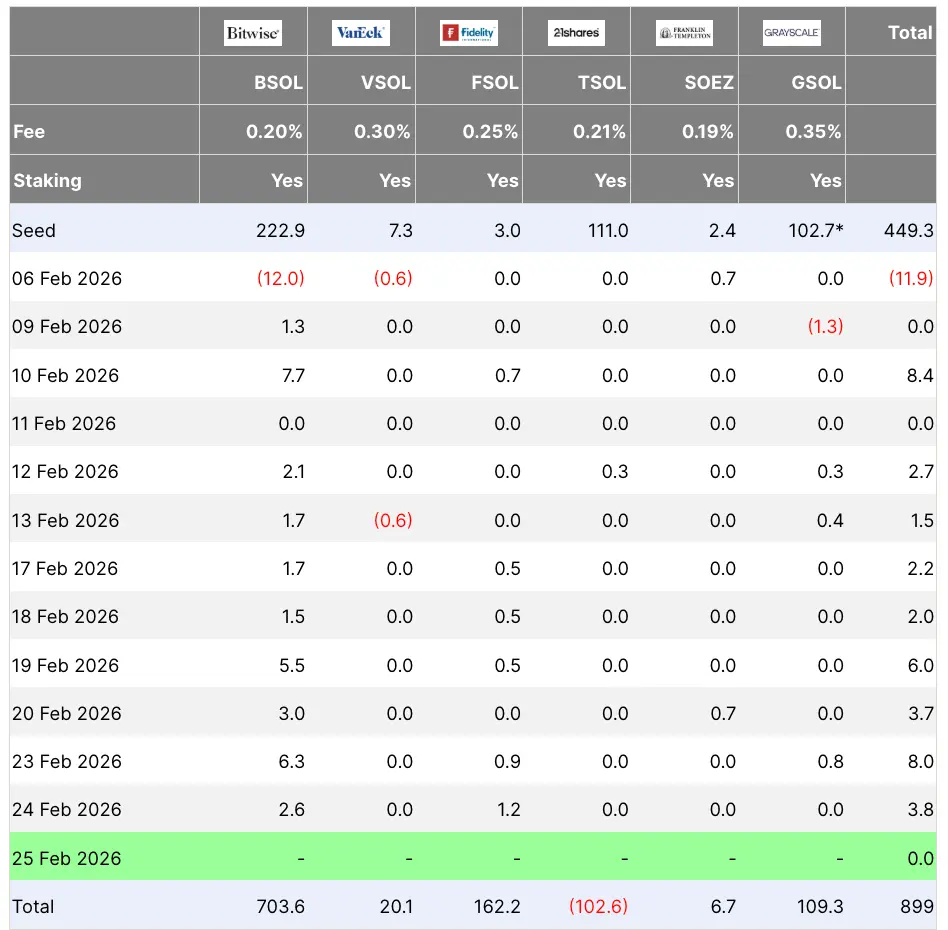
Institutional capital inflows also supported SOL. On February 24, U.S. spot Bitcoin ETFs saw a net inflow of about $258 million, with Fidelity’s FBTC attracting $82.8 million, indicating a renewed institutional interest in crypto allocations. Meanwhile, the spot Solana ETF has accumulated a net inflow of about $40 million since early February, directly reinforcing market expectations and buying pressure for the Solana ecosystem.
(Source: Farside Investors)
Institutional capital inflows also supported SOL. On February 24, U.S. spot Bitcoin ETFs saw a net inflow of about $258 million, with Fidelity’s FBTC attracting $82.8 million, indicating a renewed institutional interest in crypto allocations. Meanwhile, the spot Solana ETF has accumulated a net inflow of about $40 million since early February, directly reinforcing market expectations and buying pressure for the Solana ecosystem.
Derivatives data also signals positive momentum. Open interest in SOL contracts increased by over 5% to approximately $5.27 billion, with about $15.4 million in short positions being passively closed, suggesting significant short squeeze dynamics that accelerated the price rally. From a technical perspective, the six-hour chart has broken above a symmetrical triangle pattern, with a target around $110, resonating with the 50-day moving average.
Key technical levels indicate that if the price remains above the 100-day moving average (around $86) and closes above the 20-day exponential moving average (around $88) on the daily chart, it could further test psychological levels at $95 and $100 in the short term. On-chain data platform Glassnode notes that there is relatively little long-term trapped supply above $85, implying limited selling pressure above that level and supporting trend continuation.
In terms of indicators, the RSI has risen to around 72, entering the high zone, and the MACD has generated a bullish crossover, suggesting ongoing bullish momentum. However, short-term consolidation may be needed. Resistance levels are concentrated around $90, $95, and $115, with $100 remaining a key breakout level. Analysts believe that if Bitcoin continues to challenge the $72,000 zone, SOL’s price could gain further upward momentum. Market focus will shift to whether SOL can stabilize above the EMA key band and sustain its upward structure.
Disclaimer: The information on this page may come from third parties and does not represent the views or opinions of Gate. The content displayed on this page is for reference only and does not constitute any financial, investment, or legal advice. Gate does not guarantee the accuracy or completeness of the information and shall not be liable for any losses arising from the use of this information. Virtual asset investments carry high risks and are subject to significant price volatility. You may lose all of your invested principal. Please fully understand the relevant risks and make prudent decisions based on your own financial situation and risk tolerance. For details, please refer to
Disclaimer.
Related Articles
$1.7M in ONE Day – Hyperliquid Is Quietly Destroying Solana
Highlighting An Increasing DeFi Trading activity Hyperliquid 24H Fees. The Hyperliquid 24H fee boom indicates the continued growth of the decentralized trading platforms. Hyperliquid is a high-speed blockchain that is developed to trade perpetual futures. Users can buy and sell crypto derivatives
Coinfomania29m ago
Yesterday, the US SOL spot ETF experienced a net outflow of $8,225,500.
According to SoSoValue data, the US SOL spot ETF experienced a net outflow of $8,225,500 on March 6, with the Invesco Galaxy Solana ETF recording a net inflow of $426,900, and the Fidelity Solana Fund ETF recording a net outflow of $4,997,400. Currently, the total net asset value of SOL spot ETFs is $807 million.
GateNews2h ago
The price of Solana may drop sharply after failing to stay above $94.
The Solana (SOL) price chart is showing signs of weakening overall. Currently, the value of this token has decreased by about 10% compared to last month, reflecting a general cooling of the cryptocurrency market. However, this decline masks a noteworthy development. Over the period
TapChiBitcoin2h ago
Yesterday, the US SOL spot ETF experienced a net outflow of $8,225,500, with Fidelity FSOL seeing an outflow of nearly $5 million.
On March 6th, the US SOL spot ETF experienced a net outflow of $8.2255 million, with the Invesco Galaxy Solana ETF seeing a net inflow of $426,900, while the Fidelity Solana Fund ETF had a net outflow of $4.9974 million. The total net asset value is $807 million, with a historical cumulative net inflow of $958 million.
GateNews9h ago
SOL Life increased by 507.92% after launching Alpha, current price is 0.0007232 USDT
Gate News bot message, Gate Market Display, since launching Alpha, SOL has increased by 507.92%, now priced at 0.0007232 USDT.
CryptoRadar10h ago
Solana Price Prediction 2026: Pepeto Targets 267x Over SOL and AVAX as SEC Drops Justin Sun Lawsuit Signaling Enforcement Pivot
The SEC just dropped its lawsuit against Justin Sun with a $10 million settlement from Rainberry, and when the most aggressive crypto enforcement agency in the world starts settling cases and walking away from lawsuits it spent years building, it means the regulatory posture has fundamentally s
CaptainAltcoin15h ago