The price of Toncoin (TON) remains in a dark mood as it continues to fall below the $1.29 mark at the time of writing on Thursday. Since the beginning of the week, this coin has lost more than 4% of its value, clearly reflecting increasing selling pressure. The weakening of on-chain indicators, combined with data from the derivatives market, shows that investor participation is shrinking, further reinforcing a less optimistic scenario. From a technical perspective, TON remains “trapped” in a long-term downtrend, making the risk of deeper declines a top concern for the market.
Investor Participation in Toncoin Is Weakening
Data from DefiLlama shows that weekly trading volume on Toncoin’s decentralized exchanges (DEX) has dropped to just $12.6 million USD so far this week — the lowest since early January 2024. This clear decline indicates that trader interest and liquidity for Toncoin are cooling off, adding to negative signals for the short-term price outlook.
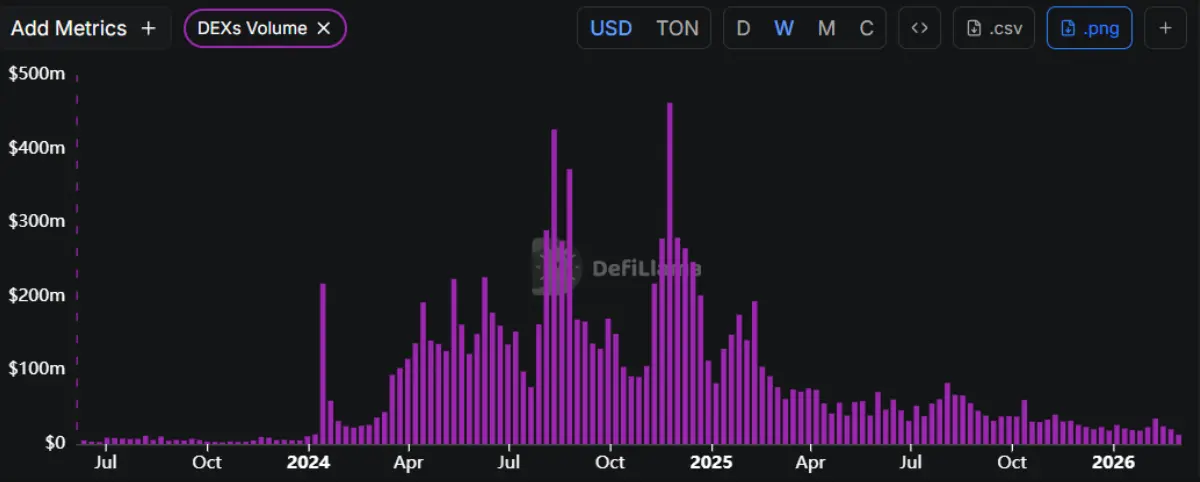 Weekly DEX trading volume chart of TON | Source: DefiLlama
In the derivatives market, the picture is also not very bright, as the TON funding rate continues to stay in negative territory, reflecting prevailing bearish sentiment. This indicator turned negative on Tuesday and decreased to -0.011% on Thursday, approaching levels seen on February 19 — when TON experienced a sharp plunge. A negative funding rate indicates that short sellers are paying fees to long positions, confirming that the market is leaning toward a bearish outlook for Toncoin.
Weekly DEX trading volume chart of TON | Source: DefiLlama
In the derivatives market, the picture is also not very bright, as the TON funding rate continues to stay in negative territory, reflecting prevailing bearish sentiment. This indicator turned negative on Tuesday and decreased to -0.011% on Thursday, approaching levels seen on February 19 — when TON experienced a sharp plunge. A negative funding rate indicates that short sellers are paying fees to long positions, confirming that the market is leaning toward a bearish outlook for Toncoin.
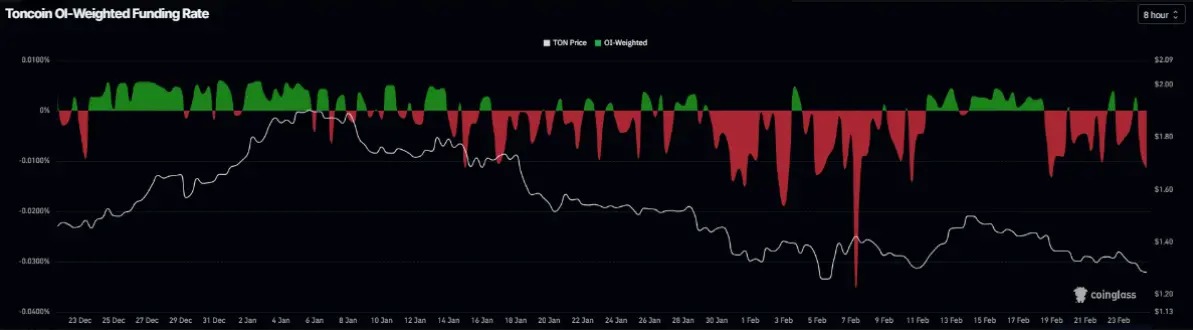 Toncoin funding rate chart | Source: Coinglass
Toncoin Price Forecast: Extended Correction as Bears Target the $1.12 Level
As of Thursday, Toncoin is trading around $1.28. The short-term technical picture continues to lean slightly negative, with the price still held below the 50-day and 100-day EMAs. This suggests the dominant downtrend remains in place, especially after TON failed to break above the important resistance trendline near $1.40.
On the daily timeframe, the RSI hovers around 36 and stays below the neutral 50 level, indicating selling pressure still dominates and there are no signs of weakening downward momentum. Additionally, the MACD indicator has returned to the negative zone, with the MACD line below the signal line and a slight negative histogram — a sign that bullish momentum is clearly weakening after an unsuccessful recovery attempt below the resistance area.
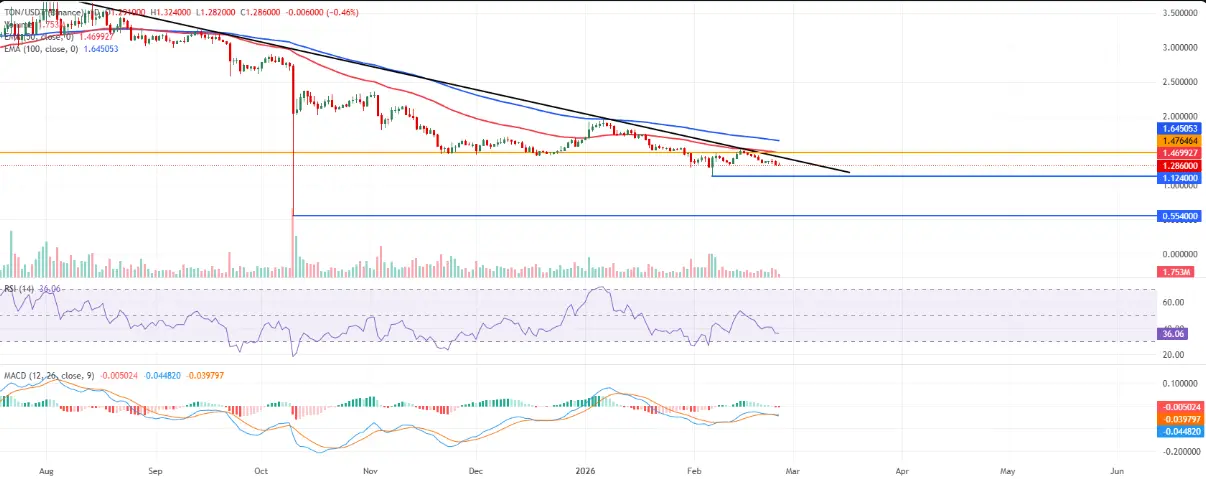 Daily TON/USDT chart | Source: TradingView
From a technical standpoint, the nearest resistance zone is around $1.40, where the previous downward trendline was broken and where recent price failures occurred. Further resistance is at $1.47, serving as a stronger barrier that blocks the recovery toward the 50-day EMA cluster.
Daily TON/USDT chart | Source: TradingView
From a technical standpoint, the nearest resistance zone is around $1.40, where the previous downward trendline was broken and where recent price failures occurred. Further resistance is at $1.47, serving as a stronger barrier that blocks the recovery toward the 50-day EMA cluster.
On the downside, immediate support is at the short-term low around $1.26. A decisive break below this level could trigger a deeper decline, pushing the price back toward $1.12 — where bears are likely to continue testing the strength of the broader bottom area.
Overall, as long as Toncoin remains below $1.40, any rebound attempts face increasing selling pressure, and the short-term downtrend is likely to remain the dominant scenario.
SN_Nour
Disclaimer: The information on this page may come from third parties and does not represent the views or opinions of Gate. The content displayed on this page is for reference only and does not constitute any financial, investment, or legal advice. Gate does not guarantee the accuracy or completeness of the information and shall not be liable for any losses arising from the use of this information. Virtual asset investments carry high risks and are subject to significant price volatility. You may lose all of your invested principal. Please fully understand the relevant risks and make prudent decisions based on your own financial situation and risk tolerance. For details, please refer to
Disclaimer.
Related Articles
COS Price Rally Gains Strengthen Due to Persistent Whale Accumulation With Breakout Suggesting 31...
Contentos (COS) is gaining attention in the crypto market with an impressive price surge of 11.98%. As a decentralized content ecosystem, it empowers creators. Recent analysis shows a significant upward momentum, with potential for further price increases driven by whale investments and rising trading volume.
BlockChainReporter46m ago
$RIVER Price Action Is Flawless: Here’s Why Bulls Are in Control
RIVER has had one of the more compelling stories in crypto over the past week. After the recent airdrop and ecosystem announcements, the token attracted strong buying interest. that pushed it well above previous consolidation levels.
Now, as the initial hype settles, The chart is showing
CaptainAltcoin3h ago
Dogecoin at a Turning Point — Will $0.094 Resistance Finally Break?
Dogecoin was trading between $0.0925 and $0.09173 with the price stabilizing around $0.0925.
The immediate $0.09443 resistance caps the current range. A move above this level could expand today’s trading activity.
Past historical price movements coincide with a number of trend support res
CryptoNewsLand3h ago
Cardano Price Holds Above $0.26 as Upgrade Buzz Builds Toward $0.30
Key Insights
Cardano price trades above $0.26 as investors position ahead of the Leios and Midnight upgrades, while derivatives data reflect rising bullish sentiment.
Futures open interest reached $416 million while funding rates favor long positions, signaling stronger trader confidence des
CryptoFrontNews3h ago
XRP Price Structure Tightens While Heatmap Highlights $1.30 Liquidity Zone
XRP trades near $1.37 support after a 0.9% daily decline, while the $1.44 level remains the immediate resistance in the current range.
A three-week liquidity heatmap highlights a large order cluster around $1.30, indicating a strong liquidity zone below price.
A three-month Gaussian
CryptoNewsLand4h ago
Internet Computer Price Nears Wedge Breakout — Will Momentum Hold Above $2.54?
Internet Computers continues trading within a falling wedge that has developed since November. Price now approaches the pattern’s upper boundary as volatility tightens.
ICP is trading around the $2.57 mark which is a bit higher than the $2.54 support. In the meantime, the immediate
CryptoNewsLand4h ago