Litecoin (LTC) continues its correction trend, trading below the $50.50 USD level at the time of writing on Wednesday, after losing about 4% in the previous session. The downward pressure is not only reflected on the chart but also reinforced by derivatives data, with open interest (OI) steadily declining while the number of short positions increases. In this context, LTC’s technical outlook still shows no clear signs of improvement.
Litecoin Derivatives Data Show Downtrend
Data from Litecoin futures markets indicate that OI fell back to $328.6 million USD on Tuesday, extending the decline that began in mid-January. The continuous decrease in OI reflects reduced investor participation and sends a pessimistic signal about the short-term market outlook.
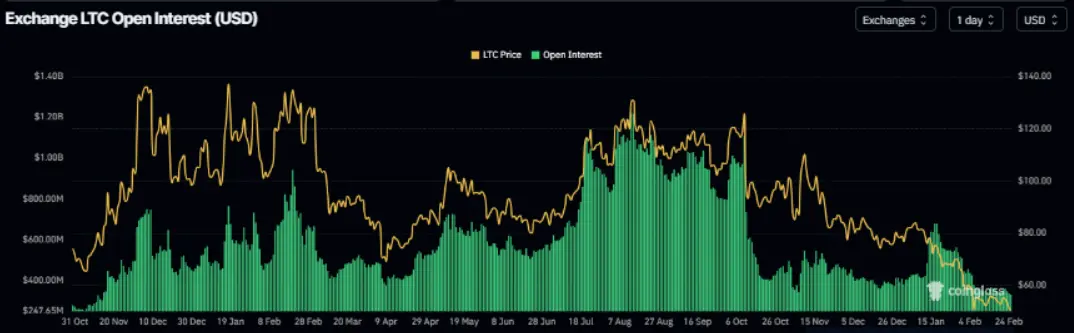 Litecoin Open Interest Volume Chart | Source: Coinglass
Additionally, the long/short ratio for Litecoin was only 0.94 on the same day and has failed to stay above 1 for the third time this month. This suggests traders are cautious about opening new long positions. The long/short ratio below 1 further emphasizes prevailing bearish sentiment, with most of the market leaning toward continued price declines.
Litecoin Open Interest Volume Chart | Source: Coinglass
Additionally, the long/short ratio for Litecoin was only 0.94 on the same day and has failed to stay above 1 for the third time this month. This suggests traders are cautious about opening new long positions. The long/short ratio below 1 further emphasizes prevailing bearish sentiment, with most of the market leaning toward continued price declines.
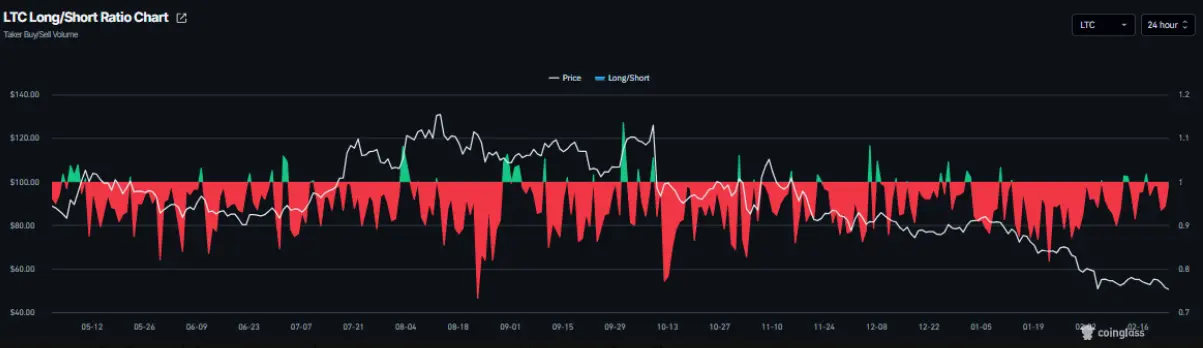 Litecoin Buy/Sell Short Ratio Chart | Source: Coinglass
Litecoin Price Forecast: Bears Target $45
As of Wednesday, Litecoin’s price hovered around $50.39 USD. The 50-day exponential moving average (EMA) continues to slope downward and is currently at $62.36 USD, reinforcing the bearish trend as the price remains below this level. Every recovery attempt quickly weakens near the 50-day EMA, indicating bulls lack the strength to trigger a reliable reversal.
On the daily timeframe, the MACD remains above its signal line and close to zero. However, the positive histogram is shrinking, reflecting diminishing bullish momentum and ongoing correction risks.
The Relative Strength Index (RSI) stands at 32.26, below the neutral 50 level. This indicates selling pressure still dominates, and RSI approaching oversold territory suggests the market could soon see technical rebounds, although there is not enough evidence yet to confirm a trend reversal.
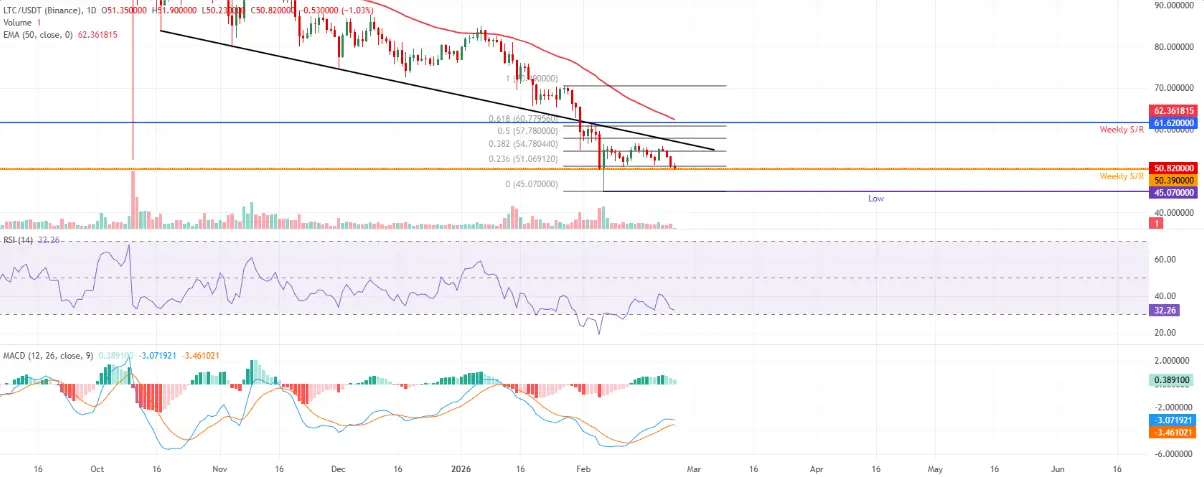 Daily LTC/USDT Chart | Source: TradingView
Based on Fibonacci retracement from the high of $70.49 USD to the low of $45.07 USD, the 23.6% level at $51.06 USD acts as a short-term resistance zone. Further, the 38.2% retracement at $54.78 USD remains a significant barrier for recovery. On the downside, immediate support is around $50.39 USD, while higher resistance is identified at $61.62 USD.
Daily LTC/USDT Chart | Source: TradingView
Based on Fibonacci retracement from the high of $70.49 USD to the low of $45.07 USD, the 23.6% level at $51.06 USD acts as a short-term resistance zone. Further, the 38.2% retracement at $54.78 USD remains a significant barrier for recovery. On the downside, immediate support is around $50.39 USD, while higher resistance is identified at $61.62 USD.
In a bullish scenario, if the price breaks above and sustains over $51.06 USD, Litecoin could extend its recovery toward $54.78 USD. Conversely, a daily close below $50.39 USD is likely to trigger new selling pressure, pushing the price back to test the February 6 low of $45.07 USD, consistent with the prevailing downtrend.
Disclaimer: The information on this page may come from third parties and does not represent the views or opinions of Gate. The content displayed on this page is for reference only and does not constitute any financial, investment, or legal advice. Gate does not guarantee the accuracy or completeness of the information and shall not be liable for any losses arising from the use of this information. Virtual asset investments carry high risks and are subject to significant price volatility. You may lose all of your invested principal. Please fully understand the relevant risks and make prudent decisions based on your own financial situation and risk tolerance. For details, please refer to
Disclaimer.
Related Articles
PEPE Stalls After 15% February Drop — Is a Breakout Coming Soon?
PEPE is consolidating near $0.0000033 after a 15% February decline.
Resistance at $0.0000038 blocks recovery despite easing selling pressure.
Breakdown below $0.0000028 support could trigger another downside move.
PepeCoin — PEPE, traders now face a quieter market after a sharp February
CryptoNewsLand20m ago
VIA on Fire: 31.12% Surge Sparks Trader Excitement
VIA's price surged by 31.12% to $0.003697, following a 67.21% rise in 24 hours and increased trading volume. This movement reflects heightened trader interest amid broader market trends, with key support at $0.003 and resistance at $0.006.
Coinfomania1h ago
鏈上熱到爆、以太幣卻漲不動?專家揭「致命死穴」:恐下探 1,500 美元
CryptoQuant 報告指出,以太坊面臨「採用悖論」,雖然網路活躍度創新高,但幣價卻下滑。若熊市持續,到第三季末以太幣可能跌至 1,500 美元。智能合約活躍度上升與以太幣價格脫鉤,交易所流入量更能反映價格動態。投資需求疲軟,資金持續流失是主要隱憂。
区块客1h ago
Dogecoin (DOGE) phát tín hiệu khởi sắc khi dòng tiền nhà đầu tư cá nhân quay lại
Dogecoin (DOGE) is experiencing a recovery, currently up over 2% and nearing the psychological $0.1000 mark. Increased speculative activity is attracting traders to the derivatives market, and technical indicators suggest a cautious positive outlook for DOGE.
TapChiBitcoin1h ago
DePIN and AI Lead the Charge – Analyzing the Top Weekly Crypto Gainers
The cryptocurrency market serves as an indicator for new technological trends, and weekly data for the cryptocurrency market collected by CoinMarketCap show that investor sentiment has recently changed a lot. The market remains directionless overall, yet an exclusive set of projects, particularly in
BlockChainReporter1h ago
Liệu RAVE có sẵn sàng tăng 30% sau khi lấy lại được mức hỗ trợ này?
RaveDAO (RAVE) hiện đang giao dịch ở mức $0,2475 sau khi ghi nhận mức tăng ấn tượng 16,45%. Đáng chú ý, sự gia tăng mạnh mẽ trong hoạt động thị trường đã được ghi nhận, với khối lượng giao dịch tăng vọt 125%, đạt $88,15 triệu. Điều này phản ánh sự quan tâm lớn từ các nhà đầu tư và nhà giao dịch đối
TapChiBitcoin2h ago