Hedera (HBAR) is trading below $0.101 at the time of writing on Wednesday, after failing to break through the key resistance zone at the end of last week. Derivatives market data indicate that HBAR’s recovery potential remains quite fragile: open interest (OI) continues to decline, and the funding rate remains negative, reflecting cautious investor sentiment. In this context, current technical signals do not support a clear bullish scenario for Hedera.
Hedera Derivatives Data Shows Downtrend
Hedera futures open interest (OI) dropped to $104.58 million on Wednesday, extending the weakening trend that began in early January. Notably, this indicator is approaching the February 6 low of $88.89 million. The prolonged decline in OI suggests decreasing participation from investors and indicates a less optimistic short-term price outlook.
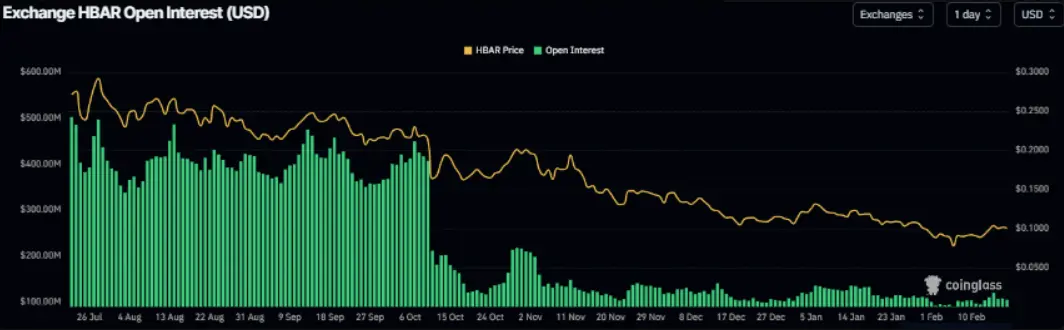 HBAR Open Interest Volume Chart | Source: CoinglassAdditionally, the funding rate data, weighted by OI from Coinglass, shows that the bearish prediction for Hedera continues to dominate over bullish expectations. The indicator turned negative on Monday and fell sharply to -0.011% on Tuesday. Negative funding rates mean short positions pay fees to long positions, emphasizing the prevailing bearish market sentiment toward HBAR.
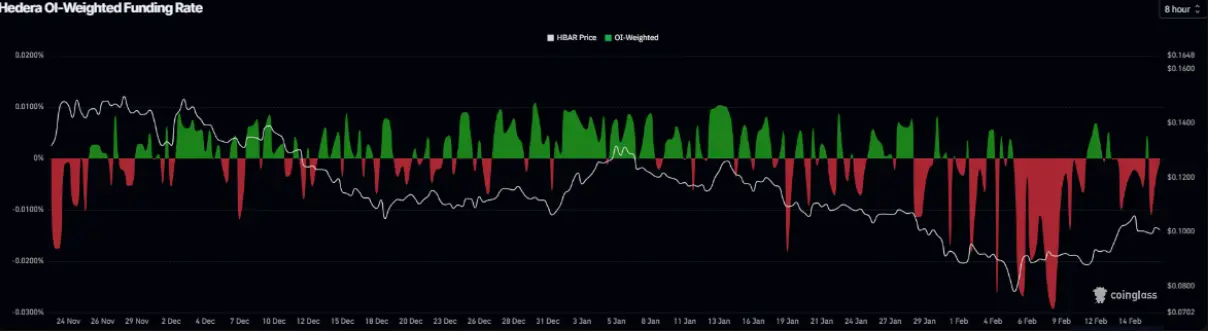 HBAR Funding Rate Chart | Source: Coinglass## Hedera Price Forecast: Rejected at Key Resistance Zone
Hedera’s price faced strong selling pressure around the 50-day exponential moving average (EMA) at $0.105 on Saturday, before slightly retracing in the following session. Notably, the 50-day EMA nearly coincides with the upper trendline of a descending wedge pattern — formed by connecting the peaks and troughs since late June — reinforcing this zone as a significant resistance area. As of Wednesday, HBAR is trading around $0.010.
In a continued correction scenario, HBAR’s price is likely to retreat toward the weekly support zone at $0.090. If selling pressure is strong enough to close below this level, the decline could extend to the next support at $0.072 — the low established on October 10.
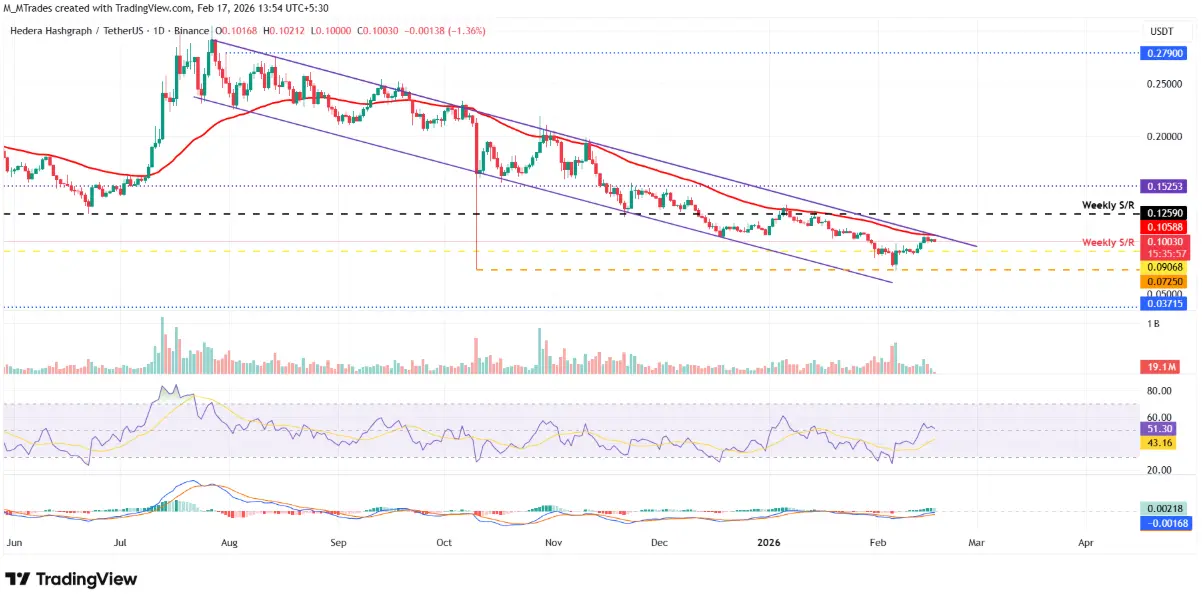 Daily HBAR/USDT Chart | Source: TradingView
Regarding momentum, the relative strength index (RSI) on the daily timeframe is currently around 51 and trending downward toward the neutral 50 level, indicating that buying power is gradually waning. For a sustained downtrend, RSI would need to break below this neutral threshold. On the positive side, the MACD indicator still shows a bullish crossover triggered on February 10, suggesting that the upward trend has not been entirely invalidated.
Conversely, if HBAR regains momentum and successfully closes above the 50-day EMA at $0.105, the price could continue upward to test the next weekly resistance zone around $0.125.
Disclaimer: The information on this page may come from third parties and does not represent the views or opinions of Gate. The content displayed on this page is for reference only and does not constitute any financial, investment, or legal advice. Gate does not guarantee the accuracy or completeness of the information and shall not be liable for any losses arising from the use of this information. Virtual asset investments carry high risks and are subject to significant price volatility. You may lose all of your invested principal. Please fully understand the relevant risks and make prudent decisions based on your own financial situation and risk tolerance. For details, please refer to
Disclaimer.
Related Articles
Fidelity Investments: Bitcoin testing long-term support—are bullish divergences signaling a potential base being formed?
Fidelity Investments’ chief macroeconomic officer, Jurrien Timmer, analyzes Bitcoin’s price action and believes it is finding support in the $65k to $70k range, showing strong technical signals. Bitcoin is currently at relatively low levels versus the power-law support line and the Golden Ratio Z-score, which could be setting up a bullish divergence. If it can hold steady, the market may correct and rebound, but investors need to watch out for inflation and liquidity risks.
ChainNewsAbmedia1h ago
XRP Faces Selling Pressure While Key Support Near $1.28 Holds
Key Insights:
XRP continues forming lower highs and lows, while price remains below major moving averages, reinforcing a sustained bearish structure across timeframes.
Open interest spikes during volatility signaled speculative trading, yet declining levels now reflect reduced risk
CryptoNewsLand8h ago
Cardano Price Near $0.245 Level as Market Momentum Weakens
Cardano's price is stabilizing around the $0.245 support level amid market consolidation and declining momentum. The inability to break resistance at $0.268 raises concerns about upward strength. Meanwhile, development of the new node version 10.7.0 is in testing, promising enhancements for the ecosystem.
CryptoNewsLand8h ago
Dogecoin Holds Near $0.09 as April Pattern Shapes Outlook
Key Insights
Dogecoin maintains stability above the $0.09 support, with buyers defending the level despite consistent selling pressure that limits strong upward momentum in early April trading sessions.
April performance remains historically mixed, with past rallies and declines shaping
CryptoNewsLand8h ago
Here’s why bitcoin’s drop below $68,000 raises the risk of a crash under $60,000
President Donald Trump's renewed aggressive posturing toward Iran has pushed bitcoin lower by roughly 2% over the past 24 hours to $67,000. While this price action is consistent with routine volatility, beneath the surface, market structure looks fragile.
This is mainly due to flows in the
CoinDesk8h ago
PEPE Signals Range-Bound Move as Momentum Weakens
PEPE's trading remains cautious with neutral RSI and weak MACD, indicating limited momentum and ongoing selling pressure. Oversold stochastic hints at possible short-term rebounds, but traders await confirmation before entering positions amid mixed signals.
CryptoNewsLand9h ago
