
Key Takeaways
-
XRP is down over 25% in 30 days, underperforming most major altcoins.
-
Price has lost both the 50-week and 100 MA, signaling weakening momentum.
-
XRP’s current structure closely mirrors CRO’s 2024 fractal, which led to a ~50% drop.
-
If the pattern holds, XRP could consolidate near $1.60 before targeting deeper support around $0.30.
-
Reclaiming the 50-week MA near $2.40 would invalidate the bearish fractal.
The broader altcoins crypto market has faced heavy selling pressure over the past 30 days, with Ethereum (ETH) sliding more than 28%, keeping sentiment weak across the board.
Among major altcoins, XRP has been one of the weakest performers, dropping over 16% in the past week and extending its 30-day decline to 25%. More importantly, a growing number of traders are now pointing to a fractal similarity with Cronos (CRO) — a setup that previously led to a deep corrective move.
If history rhymes, XRP may not be done falling just yet.
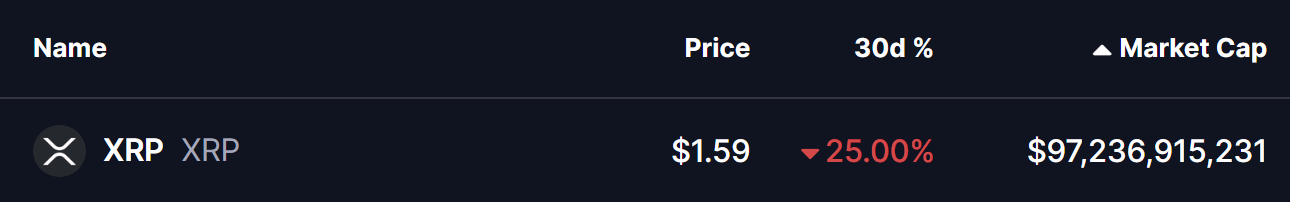
Source: Coinmarketcap
Fractal Setup Hints at Further Downside
A side-by-side comparison of CRO and XRP reveals some striking similarities in structure.
Back in late 2024, Cronos was rejected from the upper boundary of a right-angled ascending broadening wedge before entering a sharp corrective phase. Soon after, CRO slipped below its 50 and 100 moving averages, signaling weakening momentum. What followed was a prolonged sell-off that eventually stretched into a near 50% drawdown, pushing price back into its accumulation support zone.
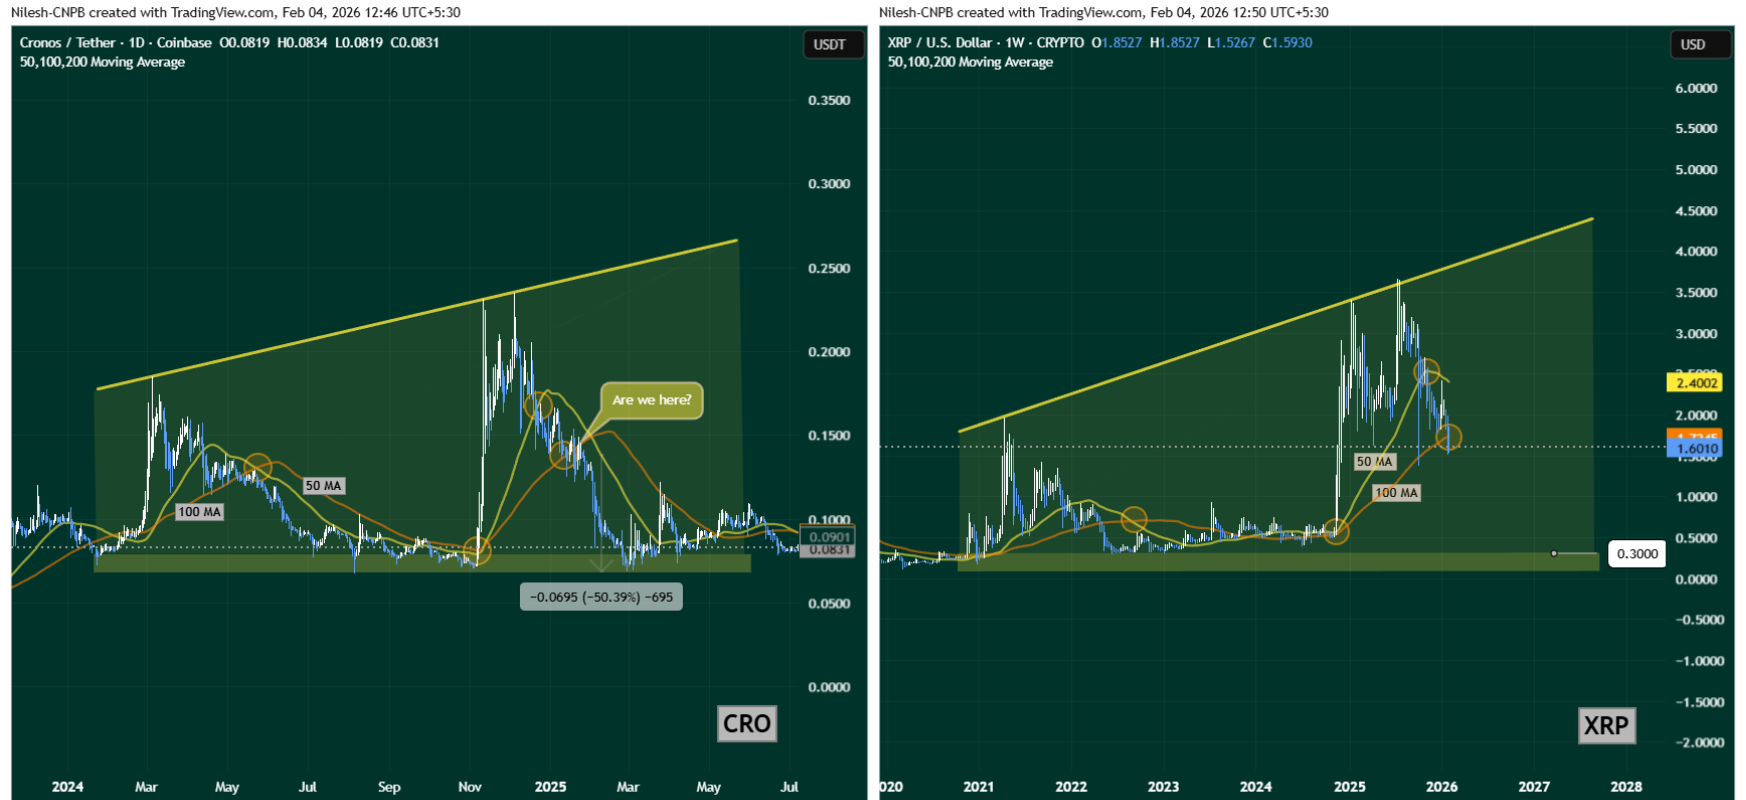
CRO and XRP Fractal Chart/Coinsprobe (Source: Tradingview)
XRP now appears to be following a very similar script.
After peaking near upper resistance around $3.65 in mid-2025, XRP rolled over and entered a steep correction. Price first lost its 50-week moving average, and this week confirmed a breakdown below the 100 MA — closely mirroring CRO’s mid-correction phase that later triggered its larger drop.
With the fractal lining up almost point-for-point, the technical picture suggests that bearish momentum remains firmly in control.
The moving averages are rolling over, price is making lower highs, and XRP is struggling to regain any meaningful strength — all classic signs of a market still searching for a bottom.
What’s Next for XRP?
If this fractal continues to play out, XRP may first consolidate around the current $1.60 area as short-term buyers attempt to stabilize price.
However, if selling pressure persists, the chart opens the door for a deeper move toward the long-term support zone near $0.30 over the coming months — roughly aligning with the magnitude of CRO’s historical decline.
On the flip side, bulls still have a chance to invalidate this bearish setup.
A strong reclaim of the 50-week moving average near $2.40 would be an early sign that momentum is shifting back in XRP’s favor and that this fractal comparison may fail.
For now though, the weekly structure keeps XRP technically vulnerable. Until key moving averages are recovered, the path of least resistance appears tilted to the downside, with traders closely watching whether this familiar CRO-style fractal plays out once again.
Disclaimer: The views and analysis presented in this article are for informational purposes only and reflect the author’s perspective, not financial advice. Technical patterns and indicators discussed are subject to market volatility and may or may not yield the anticipated results. Investors are advised to exercise caution, conduct independent research, and make decisions aligned with their individual risk tolerance.
About Author: Nilesh Hembade is the Founder and Lead Author of Coinsprobe, with over 5 years of experience in the cryptocurrency and blockchain industry. Since launching Coinsprobe in 2023, he has been providing daily, research-driven insights through in-depth market analysis, on-chain data, and technical research.
Disclaimer: The information on this page may come from third parties and does not represent the views or opinions of Gate. The content displayed on this page is for reference only and does not constitute any financial, investment, or legal advice. Gate does not guarantee the accuracy or completeness of the information and shall not be liable for any losses arising from the use of this information. Virtual asset investments carry high risks and are subject to significant price volatility. You may lose all of your invested principal. Please fully understand the relevant risks and make prudent decisions based on your own financial situation and risk tolerance. For details, please refer to
Disclaimer.
Related Articles
XRP volatility hits cycle lows as $1.40 support comes into focus
XRP is currently trading in a narrow range just above $1.40, with low volatility suggesting an imminent breakout. Recent price movements show resistance at $1.43 and support around $1.40, keeping traders attentive to upcoming shifts.
CoinDesk53m ago
XRP Today News: Ripple stablecoin enters Singapore sandbox, maintaining $1.42 as a key support level
Ripple is testing its RLUSD stablecoin in the Monetary Authority of Singapore's regulatory sandbox, aiming to leverage blockchain technology to automate trade finance payment processes to reduce costs and enhance efficiency. This pilot will enable auto-triggered payments without manual approval, increasing transaction transparency. XRP is currently trading in the range of $1.41 to $1.42, with analysts bullish on its long-term value potential.
MarketWhisper3h ago
Technical Analysis March 26: BTC, ETH, BNB, XRP, SOL, DOGE, HYPE, ADA, BCH, LINK
Bitcoin (BTC) is currently trading around 71,342 USD, continuing to encounter strong resistance at the 72,000 USD level. Nevertheless, the bulls are maintaining considerable pressure. Trader Daan Crypto Trades stated on X that BTC needs to break through and hold firmly above this zone to have a chance to "retest the 80,000 USD mark".
The market is inherently dry
TapChiBitcoin5h ago
US XRP Spot ETF saw net inflows of $1.264 million yesterday, with a certain asset management institution's product contributing all inflows
Gate News: On March 26, according to SoSoValue data, the U.S. XRP spot ETF recorded a single-day net inflow of $1.264 million on March 25 (U.S. Eastern Time). Among these, the XRP ETF under a certain asset management institution was the only product with net inflows, with a single-day net inflow of $1.264 million. This product's historical cumulative net inflow has reached $377 million. As of press time, the U.S. XRP spot ETF total net assets stand at $996 million, with XRP net asset ratio at 1.15%, and historical cumulative net inflows reaching $1.211 billion.
GateNews5h ago
