
Key Takeaways
-
HBAR is down over 26% in 30 days, under heavy altcoin selling pressure.
-
Price has lost the 100-week MA, signaling weakening momentum.
-
HBAR’s structure closely mirrors CRO’s 2024 bearish fractal.
-
A breakdown below $0.084 could expose $0.041 as the next major support.
-
Reclaiming $0.1547 would invalidate the bearish fractal setup.
The broader altcoins crypto market has faced strong selling pressure over the past 30 days, with Ethereum (ETH) sliding more than 28%, keeping pressure firmly on major altcoins.
Among them, Hedera (HBAR) has been particularly weak — dropping over 13% in the past week and extending its 30-day decline beyond 26%. What’s catching traders’ attention now is a familiar fractal pattern from Cronos (CRO), which suggests HBAR may be setting up for a deeper downside move in the near term.
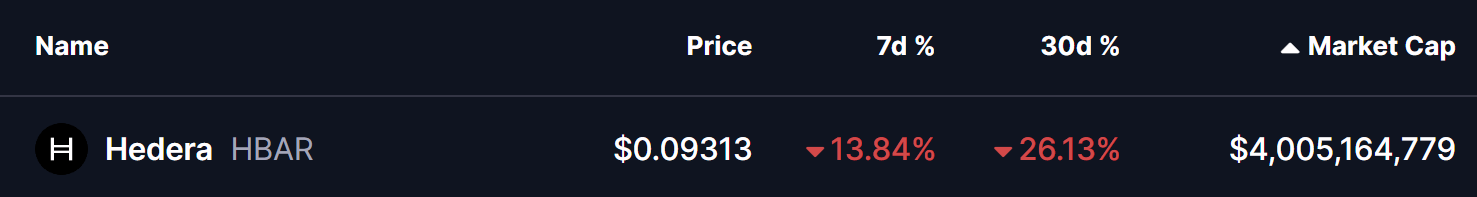
Source: Coinmarketcap
Fractal Setup Hints at Further Downside
A side-by-side comparison of CRO and HBAR reveals striking similarities.
Back in late 2024, Cronos broke out from a falling wedge and staged a strong rally — only to roll over shortly after. Price slipped below the 100 moving average, signaling weakening momentum. What followed was a sharp corrective phase that eventually dragged CRO into its accumulation support zone, completing a deep drawdown.
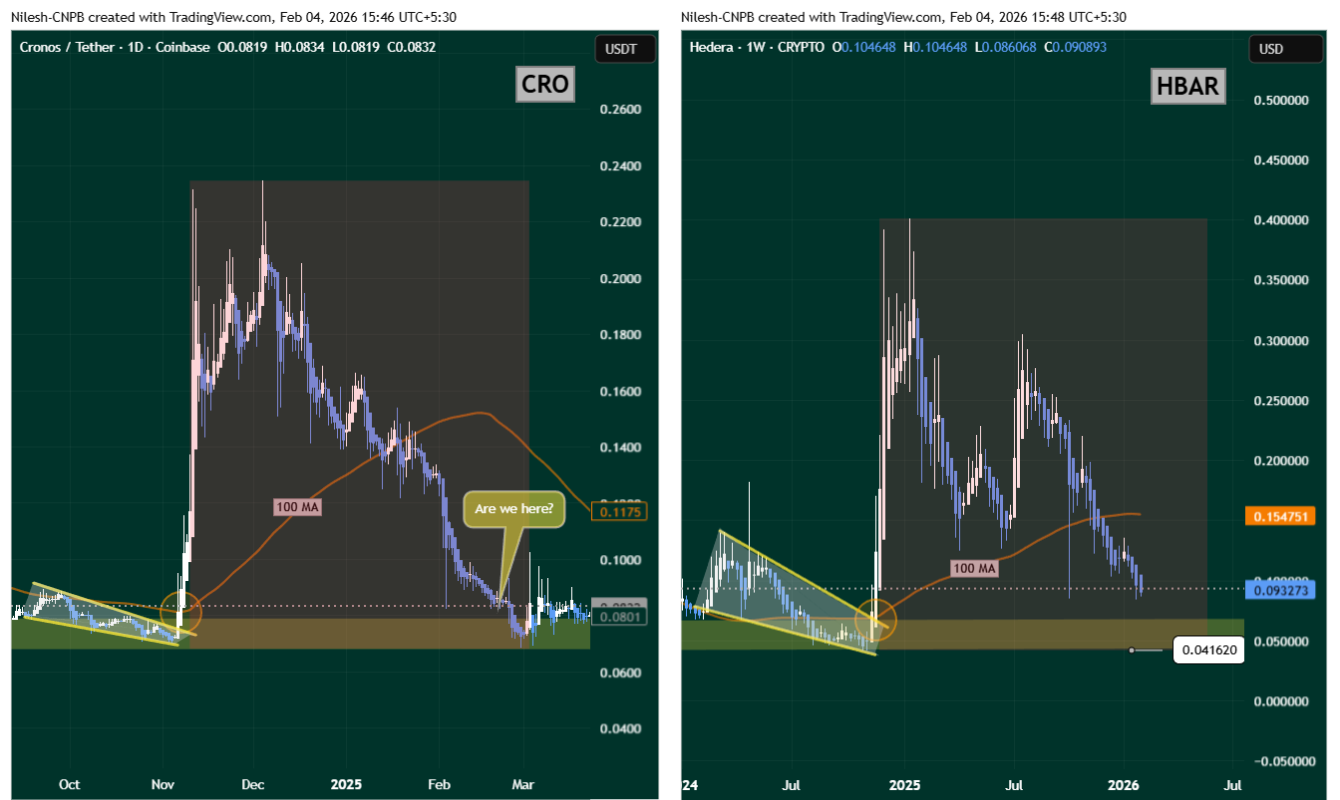
CRO and HBAR Fractal Chart/Coinsprobe (Source: Tradingview)
HBAR now appears to be following a very similar script.
After its own falling wedge breakout rally, Hedera entered a steep correction. Price has since lost the 100-week moving average and is now pressing into the $0.084 support area, closely aligning with CRO’s final stage correction before its deeper drop.
With this fractal lining up almost point-for-point, the technical picture suggests bearish momentum is still in control.
Moving averages are rolling over, structure is weakening, and buyers are struggling to reclaim higher levels — all classic signs of a market still searching for a durable bottom.
What’s Next for HBAR?
If this fractal continues to play out, a clean breakdown below the $0.084 support could open the door for a move toward the deeper accumulation zone near $0.041 over the coming weeks.
That would mirror CRO’s historical decline after it lost key moving averages and failed to hold its initial support.
On the flip side, bulls still have a chance to invalidate this bearish setup.
A strong reclaim of the 100-week moving average near $0.1547 would be an early signal that momentum is shifting back in HBAR’s favor — and that this CRO-style fractal may fail.
For now, however, the weekly structure keeps HBAR technically vulnerable. Until major resistance levels are recovered, the path of least resistance remains tilted to the downside, with traders closely watching whether this familiar fractal plays out once again.
Disclaimer: The views and analysis presented in this article are for informational purposes only and reflect the author’s perspective, not financial advice. Technical patterns and indicators discussed are subject to market volatility and may or may not yield the anticipated results. Investors are advised to exercise caution, conduct independent research, and make decisions aligned with their individual risk tolerance.
About Author: Nilesh Hembade is the Founder and Lead Author of Coinsprobe, with over 5 years of experience in the cryptocurrency and blockchain industry. Since launching Coinsprobe in 2023, he has been providing daily, research-driven insights through in-depth market analysis, on-chain data, and technical research.
Disclaimer: The information on this page may come from third parties and does not represent the views or opinions of Gate. The content displayed on this page is for reference only and does not constitute any financial, investment, or legal advice. Gate does not guarantee the accuracy or completeness of the information and shall not be liable for any losses arising from the use of this information. Virtual asset investments carry high risks and are subject to significant price volatility. You may lose all of your invested principal. Please fully understand the relevant risks and make prudent decisions based on your own financial situation and risk tolerance. For details, please refer to
Disclaimer.
Related Articles
ETH/BTC Price Ratio Rebounds to 0.0313 in Q1 2026 as Ethereum User Base Surges 82%
In Q1 2026, the Ethereum-to-Bitcoin price ratio reached a three-month high at 0.0313. Ethereum added 284,000 users and surpassed $180 billion in stablecoin supply. Bitcoin remained strong above $74,000, driven by significant ETF inflows.
GateNews15m ago
Why is Bitcoin up today? Trump says Iran is seeking a truce, and risk assets move higher across the board
On April 15, Bitcoin rebounded about 6% after Trump said Iran is seeking to reach an agreement, breaking above $75,000. Expectations for the resumption of U.S.-Iran negotiations warmed up, lifting Asian stock markets. Technically, roughly $6 billion worth of short positions were forced to close, accelerating the rebound. Analysts said that if the U.S.-Iran situation continues to ease, Bitcoin could break through $80,000, and they predicted it may reach $150,000 by year-end.
MarketWhisper4h ago
Bitmine is promoted to the NYSE main board! Tom Lee: US stocks may be at a bottom, and selling pressure on Ether could ease
Bitmine officially transferred from the NYSE American market to the main board, marking a significant milestone for the company. Despite a sharp drop in its share price, it still increased the share repurchase program to $4 billion. The company holds a large amount of Ether, and expects that a rebound in the crypto market will help improve its assets and share price performance.
CryptoCity4h ago
ETH 15-minute up 0.66%: On-chain large transfers in sync drove a net inflow of funds, boosting spot buying pressure
2026-04-15 00:00 to 00:15 (UTC), ETH shows a local anomaly. The 15-minute return rate is +0.66%. The trading price range is 2321.93–2343.2 USDT, with a range of 0.92%. During this period, market attention increased, volatility slightly intensified, buy pressure in the order book shifted upward in the short term, and quickly pushed spot prices up into a key resistance area.
The main drivers of this anomaly are large on-chain transfers and inflows of capital in combination. At the beginning of the window, multiple large ETH transfers appeared, including 8,676 ETH and 6,551 ETH, respectively, transferring from a large source to the
GateNews5h ago
BTC 15-minute drop of 0.54%: Liquidity worsens and whales actively reduce positions, putting short-term pressure on the market
From 22:15 to 22:30 (UTC) on 2026-04-14, BTC saw a short-term pullback of 0.54% within the high-range band of 73911.6 - 74314.4 USDT, with a return of -0.54%. During this period, market swings were evident, volatility intensified, attention from the market quickly increased, and downward pressure on the order book was prominent.
The main drivers behind this unusual move were the continued deterioration of market liquidity and a clear lack of order book depth, which made the BTC price extremely sensitive to large sell orders. At the same time, during the key time window, whale wallets carried out large transfers and also engaged in active de-risking,
GateNews6h ago
ETH 15-minute drop of 0.61%: Sell orders concentrate and release while bearish sentiment intensifies, increasing downward pressure
2026-04-14 22:15 to 2026-04-14 22:30 (UTC) during this period, on the 15-minute K-line, ETH recorded a -0.61% return, with a price range of 2313.68 to 2328.54 USDT and a fluctuation of 0.64%. During this period, market attention increased, trading volume expanded noticeably, and heightened short-term volatility sparked strong interest in the subsequent trend.
The main drivers behind this unusual move are the concentrated release of sell orders and continued net outflows of on-chain funds. Specifically, the sell volume share rose to 52%, higher than the buy side at 48%, indicating heavy selling pressure
GateNews6h ago
