
Key Takeaways
-
SAND price is showing early signs of stabilization after recent downside pressure.
-
Buyers appear to be defending a key support zone, hinting at a potential short-term rebound.
-
A breakout above nearby resistance could open the door for a stronger recovery move.
Gaming-focused crypto tokens are back in the spotlight after Axie Infinity (AXS) posted a sharp rally of over 16% in a single day and more than 246% over the past month, reigniting optimism around the gaming narrative. Riding this renewed momentum, Sandbox (SAND) has also stepped into focus, climbing nearly 45% as overall market sentiment turns constructive.
Beyond the recent price bounce, the technical structure on the chart is starting to tell a bigger story, hinting that SAND may be setting up for a bullish continuation move.
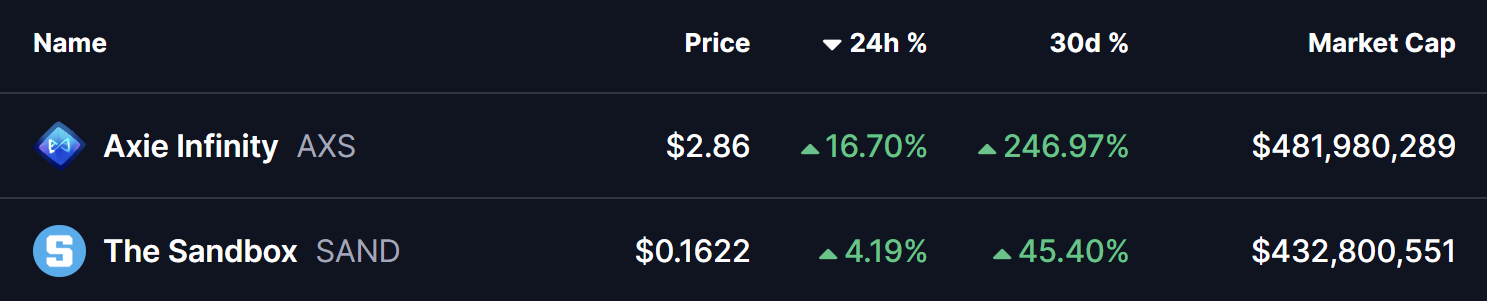
Source: Coinmarketcap
Descending Broadening Wedge Pattern in Play
On the daily timeframe, SAND is trading within a descending broadening wedge — a bullish reversal pattern that often develops during corrective phases before a trend shift. This structure reflects increasing volatility, with price gradually compressing while buyers quietly regain control.
During the latest pullback, SAND successfully retested the lower boundary of the wedge near the $0.11 zone, an area that has repeatedly acted as strong demand. Buyers stepped in aggressively at this level, triggering a rebound that pushed price toward $0.1711, placing SAND right near the wedge’s upper resistance trendline.
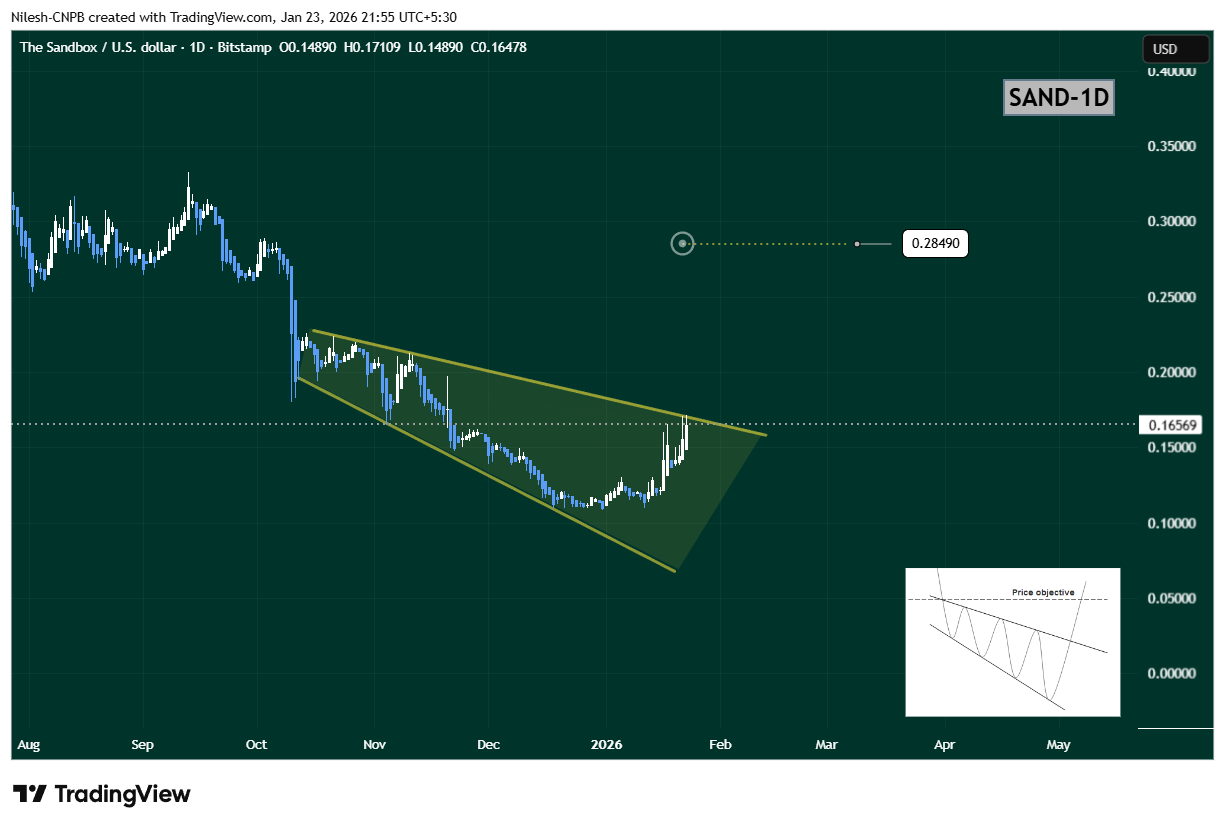
Sandbox (SAND) Daily Chart/Coinsprobe (Source: Tradingview)
The steady rise toward this upper boundary suggests growing bullish momentum and increasing breakout pressure.
What’s Next for SAND?
If buyers manage to push SAND above the upper wedge resistance near $0.1711, it would confirm a bullish breakout from the pattern. In that scenario, the chart opens the door for a move toward the $0.2849 target, which aligns with the measured move of the wedge and represents roughly 73% upside from current levels.
However, if price faces rejection at resistance, SAND could continue consolidating within the wedge structure. In that case, the $0.13–$0.14 region will act as an important short-term support zone to watch.
Bottom Line
SAND’s overall technical structure remains constructive. With a bullish descending broadening wedge in play, buyers defending key support, and gaming tokens gaining renewed attention, Sandbox appears to be positioning for a potential breakout. A confirmed move above resistance could mark the beginning of a stronger upside phase in the sessions ahead.
Disclaimer: The views and analysis presented in this article are for informational purposes only and reflect the author’s perspective, not financial advice. Technical patterns and indicators discussed are subject to market volatility and may or may not yield the anticipated results. Investors are advised to exercise caution, conduct independent research, and make decisions aligned with their individual risk tolerance.
About Author: Nilesh Hembade is the Founder and Lead Author of Coinsprobe, with over 5 years of experience in the cryptocurrency and blockchain industry. Since launching Coinsprobe in 2023, he has been providing daily, research-driven insights through in-depth market analysis, on-chain data, and technical research.
Disclaimer: The information on this page may come from third parties and does not represent the views or opinions of Gate. The content displayed on this page is for reference only and does not constitute any financial, investment, or legal advice. Gate does not guarantee the accuracy or completeness of the information and shall not be liable for any losses arising from the use of this information. Virtual asset investments carry high risks and are subject to significant price volatility. You may lose all of your invested principal. Please fully understand the relevant risks and make prudent decisions based on your own financial situation and risk tolerance. For details, please refer to
Disclaimer.
Related Articles
Where Could Kaspa (KAS) Price Go This Week?
Kaspa (KAS) is showing serious resilience even as its price remains near lows. Kaspa’s hash rate is holding near all-time highs, showing miners aren’t stepping back and the network’s backbone is rock solid.
A major hardfork is coming on May 5, bringing native tokens and more programmability.
CaptainAltcoin5m ago
19.81% Surge for DUSK: What It Means for Traders
DUSK's price surged 19.81% to $0.09667 amid increased market activity and a broader altcoin shift. Analysts highlight its rising relevance and key resistance at $0.10, suggesting significant future trading interest.
Coinfomania20m ago
Bitcoin Briefly Falls Below $70,000 Mark During Asian Session as Fed Hawkishness and Macro Uncertainty Weigh on Market Volatility
Bitcoin dipped below $70,000 on March 19th, touching a low of approximately $69,537, reflecting the market's reassessment of the Federal Reserve's interest rate decision and inflation outlook. Although it later rebounded to around $70,180, the $70,000 level remains a key support in the near term. With weakening market sentiment, coupled with energy prices and macro risks, capital is turning more conservative, and Bitcoin may consolidate around the $70,000 level going forward.
区块客1h ago
XRP Enjoying 'Strong Retail Demand,' Report Says - U.Today
The essay explores the contrasting dynamics between retail and institutional demand in the cryptocurrency market. It highlights XRP's strong retail base and growing adoption, while institutional interest remains cautious, especially compared to assets like Bitcoin and Ethereum, amid recent ETF flows.
UToday1h ago
Fractal model predicts Bitcoin will hit bottom in October 2026
Bitcoin shows positive recovery signals, improving market sentiment after a long phase of volatility. However, experts believe the current uptrend is short-term, with deeper correction risks ahead. According to Crypto Rover's fractal model, Bitcoin's price follows a four-year cycle influenced by halving events. The current cycle likely peaked in late 2025, with further declines expected before a potential bottom around 2026. Short-term price fluctuations can mislead investors, emphasizing the importance of understanding these cycles for long-term trends.
TapChiBitcoin2h ago
Bittensor Holds Strength but Faces Resistance Near $285 Level
Key Insights:
Bittensor maintains strong short-term momentum above key averages, while ETF developments and high staking levels continue shaping liquidity and investor demand dynamics.
Overbought technical indicators signal stretched conditions, even as bullish momentum persists,
CryptoFrontNews2h ago
