
Key Takeaways
-
Hyperliquid (HYPE) surged over 8%, reclaiming the $23.30 level amid rising market interest.
-
DefiLlama data shows Hyperliquid leading perpetual futures volume over the last 30 days, topping $160 billion.
-
Strong derivatives activity suggests sustained trader demand and growing ecosystem traction.
-
The daily chart highlights a Bearish Shark harmonic pattern, allowing room for short-term upside.
Hyperliquid’s native token, HYPE, is back in the spotlight today after posting a 8%+ price jump, pushing above the $23.30 level. While the price move itself has caught traders’ attention, a deeper look at on-chain metrics and the daily chart suggests there may be more developing beneath the surface.
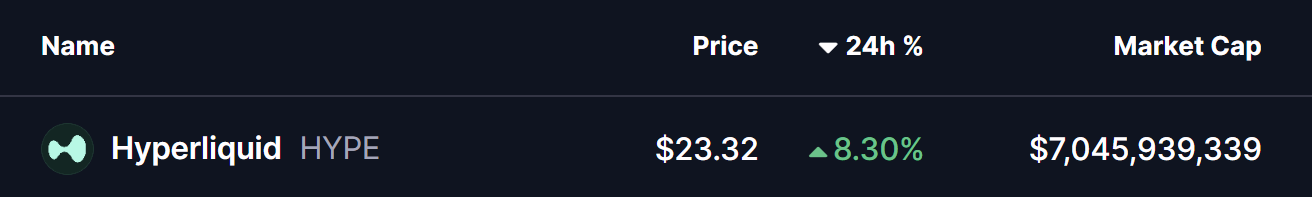
Source: Coinmarketcap
Hyperliquid (HYPE) Leads Perp Volume
According to DefiLlama data, **Hyperliquid **has emerged as the **top perpetual futures **platform by trading volume over the last 30 days, significantly outperforming its closest competitors. The protocol recorded approximately $160.4 billion in perpetual volume, comfortably ahead of Aster and Lighter, which logged around $124.7 billion and $112.5 billion, respectively.
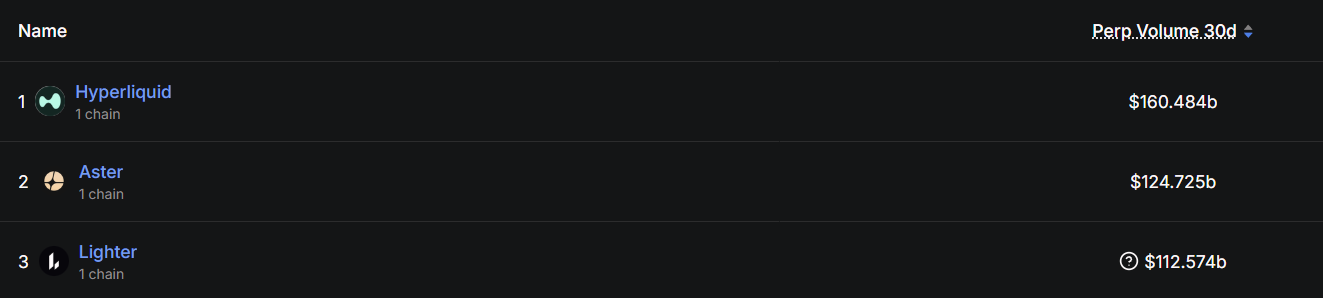
Source: Defillama
This surge in activity highlights growing trader preference for Hyperliquid’s ecosystem, signaling strong demand, deep liquidity, and sustained engagement. Historically, rising derivatives volume often acts as a leading indicator for increased interest in a project’s native token — something that appears to be playing out in HYPE’s recent price action.
Is More Upside Ahead?
From a technical perspective, HYPE’s daily chart reveals the development of a Bearish Shark harmonic pattern, a well-known formation in technical analysis. While this pattern ultimately suggests a potential reversal once fully completed, it often allows for short-term bullish continuation as price moves toward the “C” point.
Following the completion of the O-X-A-B structure, HYPE is currently trading around $23.26, holding above its recent lows. The next key challenge for bulls lies at the 50-day moving average near $25.72, which has acted as a dynamic resistance zone.
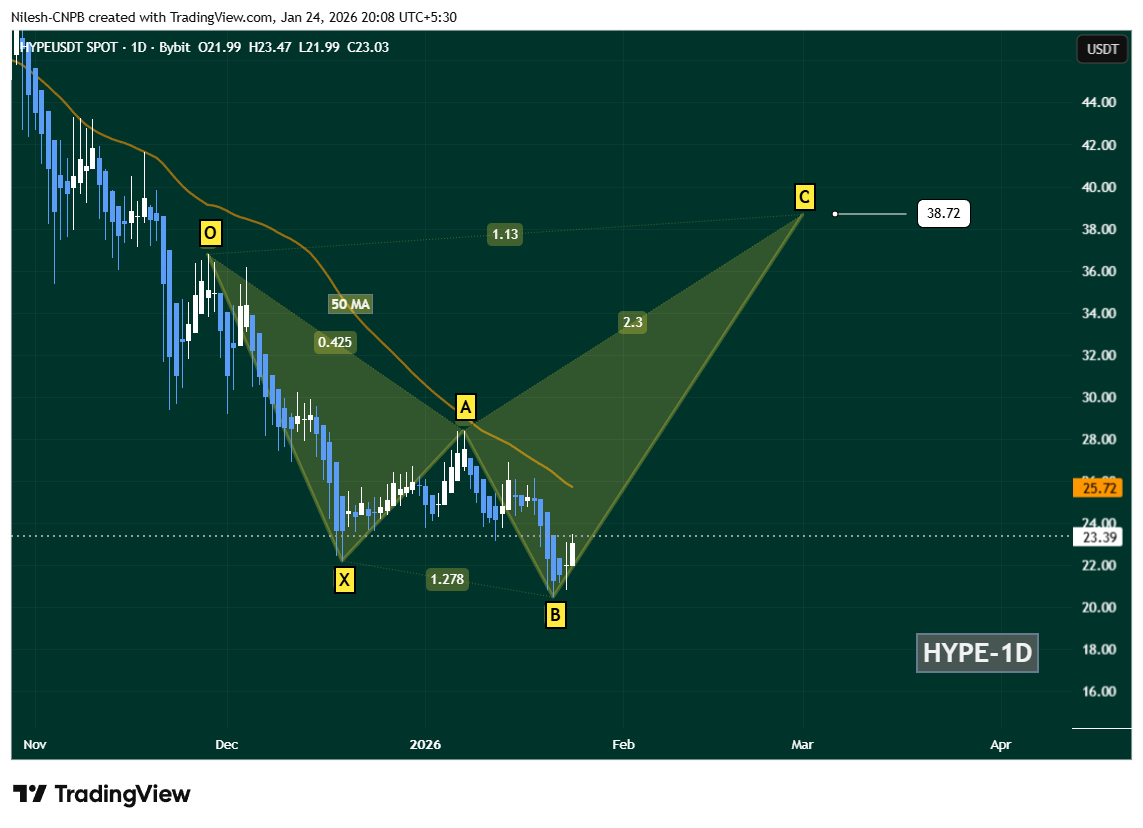
Hyperliquid (HYPE) Daily Chart/Coinsprobe (Source: Tradingview)
A decisive daily close above the 50-day MA ($25.72) would strengthen the recovery narrative and could open the door for a broader upside move. If momentum continues to build, the chart projects a potential advance toward the C-point near $38.72, aligning with the Shark pattern’s 1.13 Fibonacci extension.
However, downside risks remain. A failure to hold the B-point support zone would invalidate the bullish continuation setup and could expose HYPE to extended consolidation or further downside pressure in the near term.
Bottom Line
HYPE’s price rebound is being backed by strong on-chain fundamentals, with Hyperliquid clearly dominating the perpetual trading landscape. While the broader harmonic structure suggests caution in the longer term, short-term technicals still favor a recovery move as long as key support levels remain intact. All eyes now remain on the $25.72 reclaim, which could act as the trigger for the next leg higher.
Disclaimer: The views and analysis presented in this article are for informational purposes only and reflect the author’s perspective, not financial advice. Technical patterns and indicators discussed are subject to market volatility and may or may not yield the anticipated results. Investors are advised to exercise caution, conduct independent research, and make decisions aligned with their individual risk tolerance.
About Author: Nilesh Hembade is the Founder and Lead Author of Coinsprobe, with over 5 years of experience in the cryptocurrency and blockchain industry. Since launching Coinsprobe in 2023, he has been providing daily, research-driven insights through in-depth market analysis, on-chain data, and technical research.
Disclaimer: The information on this page may come from third parties and does not represent the views or opinions of Gate. The content displayed on this page is for reference only and does not constitute any financial, investment, or legal advice. Gate does not guarantee the accuracy or completeness of the information and shall not be liable for any losses arising from the use of this information. Virtual asset investments carry high risks and are subject to significant price volatility. You may lose all of your invested principal. Please fully understand the relevant risks and make prudent decisions based on your own financial situation and risk tolerance. For details, please refer to
Disclaimer.
Related Articles
Bitcoin Uptrend Likely by Late 2026, Says Scaramucci
The latest downturn in Bitcoin has sparked fresh debate across the crypto market. However, according to Anthony Scaramucci, the explanation may be far less surprising than many expect. The SkyBridge Capital managing partner believes the current pullback is simply part of Bitcoin’s long-standing
Coinfomania10m ago
Panic sentiment surges, "hedging costs" reach new highs! VanEck: Bitcoin may be approaching a reversal point
VanEck's research shows that the Bitcoin market is currently in a state of extreme anxiety. Despite rising hedging costs, traders are actively seeking downside protection. The report points out that while leverage and volatility have decreased, the options market is displaying panic signals, with put premiums reaching new highs. However, historical data suggests that extreme panic often precedes a rebound, and significant market turning points may emerge in the future.
区块客14m ago
TRUMP Token May Test Historical Lows Again? $70 Million Sell Pressure Incoming, $3 Level in Jeopardy
Trump token TRUMP has continued to decline recently, with the current price at $3.21, down 1.32% intraday and approaching its historical low of $2.705. On-chain data shows selling pressure has not been fully released, with significant major capital outflows. Technical analysis indicates that if the trend continues, the price could decline to $2.71, with $3.00 serving as psychological support. Market sentiment has turned cautious.
GateNews16m ago
MICA Daily | Why Have Stocks Fallen While Crypto Has Risen Recently? Analyzing the Truth Behind the Decoupling
Since October 2025, the positive correlation between Bitcoin and the S&P 500 Index has significantly weakened, entering a decoupling phase. This change stems from large-scale liquidation events, depressed market liquidity, and reduced risk appetite among traders. Meanwhile, ETF outflows and geopolitical tensions have also impacted Bitcoin's performance, demonstrating that its potential as a safe-haven asset is gradually increasing as deleveraging comes to an end.
区块客17m ago
Bitcoin Rebound Timeline Exposed: Scaramucci Says Q4 May Launch New Bull Market, $1 Million Target Unchanged
Under geopolitical risks and macroeconomic pressures, Bitcoin's price has broken below $68,000. Anthony Scaramucci, founder of SkyBridge Capital, believes this represents a typical cyclical pullback and anticipates Bitcoin may rally again in 2026. Despite short-term market risks, long-term bullish sentiment remains solid.
GateNews18m ago
Bitcoin Potentially Dips to $62,000? Mega Whales Counter-Trend Accumulation Hits One-Year High, Long-Short Battle Intensifies
Bitcoin broke below the head and shoulders neckline on March 23rd, with prices sliding to around $68,100. The downside target is expected at $62,200. Despite coin holders increasing positions and RSI forming a divergence signal, the market is still facing selling pressure. $69,500 serves as a key support level, and future trends will depend on the battle over key price levels.
GateNews22m ago
