
Key Takeaways
-
Hyperliquid (HYPE) surged over 8%, reclaiming the $23.30 level amid rising market interest.
-
DefiLlama data shows Hyperliquid leading perpetual futures volume over the last 30 days, topping $160 billion.
-
Strong derivatives activity suggests sustained trader demand and growing ecosystem traction.
-
The daily chart highlights a Bearish Shark harmonic pattern, allowing room for short-term upside.
Hyperliquid’s native token, HYPE, is back in the spotlight today after posting a 8%+ price jump, pushing above the $23.30 level. While the price move itself has caught traders’ attention, a deeper look at on-chain metrics and the daily chart suggests there may be more developing beneath the surface.
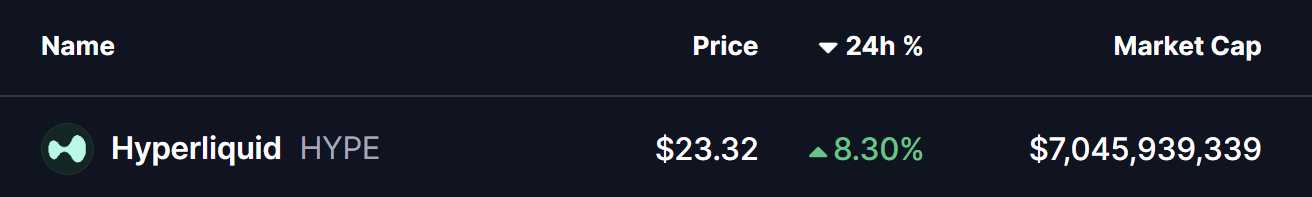
Source: Coinmarketcap
Hyperliquid (HYPE) Leads Perp Volume
According to DefiLlama data, **Hyperliquid **has emerged as the **top perpetual futures **platform by trading volume over the last 30 days, significantly outperforming its closest competitors. The protocol recorded approximately $160.4 billion in perpetual volume, comfortably ahead of Aster and Lighter, which logged around $124.7 billion and $112.5 billion, respectively.
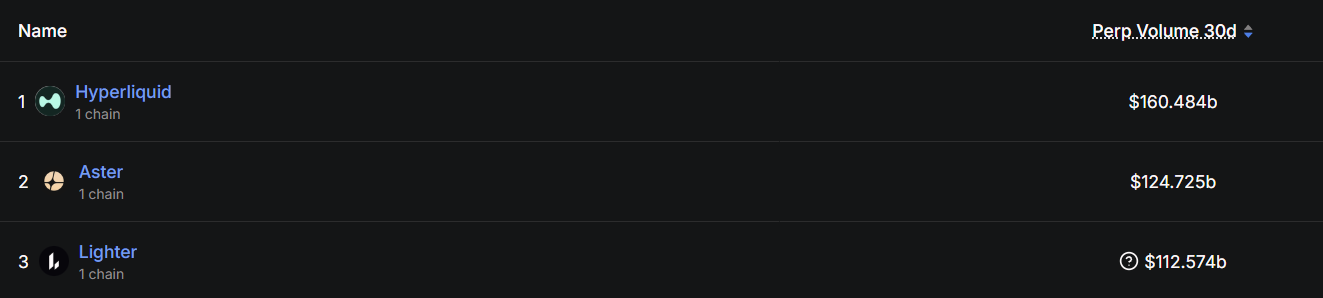
Source: Defillama
This surge in activity highlights growing trader preference for Hyperliquid’s ecosystem, signaling strong demand, deep liquidity, and sustained engagement. Historically, rising derivatives volume often acts as a leading indicator for increased interest in a project’s native token — something that appears to be playing out in HYPE’s recent price action.
Is More Upside Ahead?
From a technical perspective, HYPE’s daily chart reveals the development of a Bearish Shark harmonic pattern, a well-known formation in technical analysis. While this pattern ultimately suggests a potential reversal once fully completed, it often allows for short-term bullish continuation as price moves toward the “C” point.
Following the completion of the O-X-A-B structure, HYPE is currently trading around $23.26, holding above its recent lows. The next key challenge for bulls lies at the 50-day moving average near $25.72, which has acted as a dynamic resistance zone.
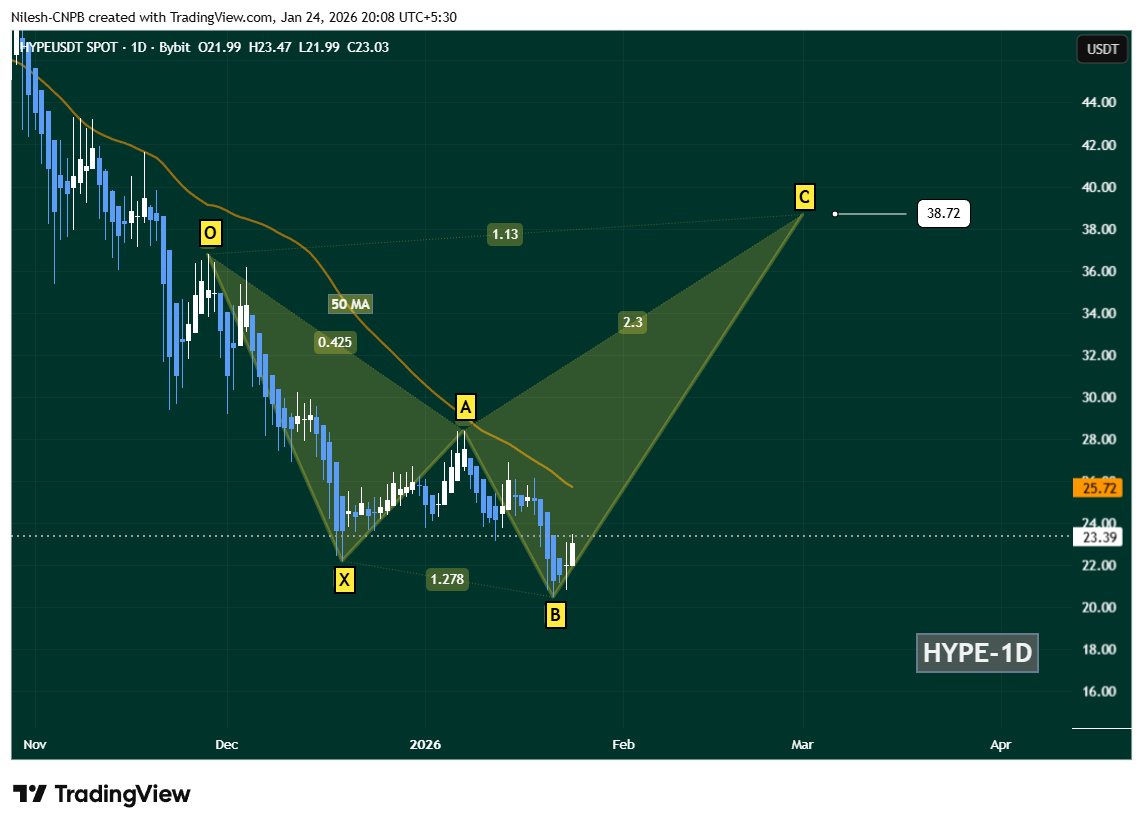
Hyperliquid (HYPE) Daily Chart/Coinsprobe (Source: Tradingview)
A decisive daily close above the 50-day MA ($25.72) would strengthen the recovery narrative and could open the door for a broader upside move. If momentum continues to build, the chart projects a potential advance toward the C-point near $38.72, aligning with the Shark pattern’s 1.13 Fibonacci extension.
However, downside risks remain. A failure to hold the B-point support zone would invalidate the bullish continuation setup and could expose HYPE to extended consolidation or further downside pressure in the near term.
Bottom Line
HYPE’s price rebound is being backed by strong on-chain fundamentals, with Hyperliquid clearly dominating the perpetual trading landscape. While the broader harmonic structure suggests caution in the longer term, short-term technicals still favor a recovery move as long as key support levels remain intact. All eyes now remain on the $25.72 reclaim, which could act as the trigger for the next leg higher.
Disclaimer: The views and analysis presented in this article are for informational purposes only and reflect the author’s perspective, not financial advice. Technical patterns and indicators discussed are subject to market volatility and may or may not yield the anticipated results. Investors are advised to exercise caution, conduct independent research, and make decisions aligned with their individual risk tolerance.
About Author: Nilesh Hembade is the Founder and Lead Author of Coinsprobe, with over 5 years of experience in the cryptocurrency and blockchain industry. Since launching Coinsprobe in 2023, he has been providing daily, research-driven insights through in-depth market analysis, on-chain data, and technical research.
Disclaimer: The information on this page may come from third parties and does not represent the views or opinions of Gate. The content displayed on this page is for reference only and does not constitute any financial, investment, or legal advice. Gate does not guarantee the accuracy or completeness of the information and shall not be liable for any losses arising from the use of this information. Virtual asset investments carry high risks and are subject to significant price volatility. You may lose all of your invested principal. Please fully understand the relevant risks and make prudent decisions based on your own financial situation and risk tolerance. For details, please refer to
Disclaimer.
Related Articles
Bitcoin Rebounds to $74K on U.S.-Iran Framework Deal, But Market Skepticism Remains
Bitcoin's recent rise to mid-$74,000 followed a risk asset rally linked to a U.S.-Iran nuclear framework, but skepticism remains due to flat Treasury yields and unchanged gold prices. The core issue of uranium enrichment persists, and while on-chain data shows BTC's gradual advance, options markets reflect doubts about a sustained breakout. Overall, analysts see the rally as temporary, with macro conditions still tight and potential downside risks.
GateNews8h ago
Cardano Traders Watch $0.243 Support Level as ADA Price Faces Critical Decision
Cardano (ADA) is at a crucial support level of $0.243, with potential gains to $0.30 if it holds. A daily close below this could lead to declines toward $0.10. Currently, trading volume is around $500 million, with ADA notably below its all-time high.
GateNews9h ago
ETH/BTC Price Ratio Rebounds to 0.0313 in Q1 2026 as Ethereum User Base Surges 82%
In Q1 2026, the Ethereum-to-Bitcoin price ratio reached a three-month high at 0.0313. Ethereum added 284,000 users and surpassed $180 billion in stablecoin supply. Bitcoin remained strong above $74,000, driven by significant ETF inflows.
GateNews14h ago
Why is Bitcoin up today? Trump says Iran is seeking a truce, and risk assets move higher across the board
On April 15, Bitcoin rebounded about 6% after Trump said Iran is seeking to reach an agreement, breaking above $75,000. Expectations for the resumption of U.S.-Iran negotiations warmed up, lifting Asian stock markets. Technically, roughly $6 billion worth of short positions were forced to close, accelerating the rebound. Analysts said that if the U.S.-Iran situation continues to ease, Bitcoin could break through $80,000, and they predicted it may reach $150,000 by year-end.
MarketWhisper18h ago
Bitmine is promoted to the NYSE main board! Tom Lee: US stocks may be at a bottom, and selling pressure on Ether could ease
Bitmine officially transferred from the NYSE American market to the main board, marking a significant milestone for the company. Despite a sharp drop in its share price, it still increased the share repurchase program to $4 billion. The company holds a large amount of Ether, and expects that a rebound in the crypto market will help improve its assets and share price performance.
CryptoCity18h ago
ETH 15-minute up 0.66%: On-chain large transfers in sync drove a net inflow of funds, boosting spot buying pressure
2026-04-15 00:00 to 00:15 (UTC), ETH shows a local anomaly. The 15-minute return rate is +0.66%. The trading price range is 2321.93–2343.2 USDT, with a range of 0.92%. During this period, market attention increased, volatility slightly intensified, buy pressure in the order book shifted upward in the short term, and quickly pushed spot prices up into a key resistance area.
The main drivers of this anomaly are large on-chain transfers and inflows of capital in combination. At the beginning of the window, multiple large ETH transfers appeared, including 8,676 ETH and 6,551 ETH, respectively, transferring from a large source to the
GateNews19h ago
