Quant (QNT) has recorded an impressive 12.33% growth over the past 36 hours, while the daily trading volume has tripled since Friday, January 16. This strong upward momentum occurs amid Bitcoin (BTC) maintaining a solid local support zone at $94,500, which previously served as resistance in December and until recently.
The potential for Bitcoin to reach the $100,000 mark has motivated altcoins, opening up significant short-term upside opportunities.
Long-term trend of QNT remains positive
On the weekly chart, QNT is establishing a solid bullish structure. The strong growth in November 2024 helped QNT surpass its previous high at $149.6. Moving into 2025, the weekly chart shows QNT forming a higher low at $58.60, reinforcing the long-term bullish outlook.
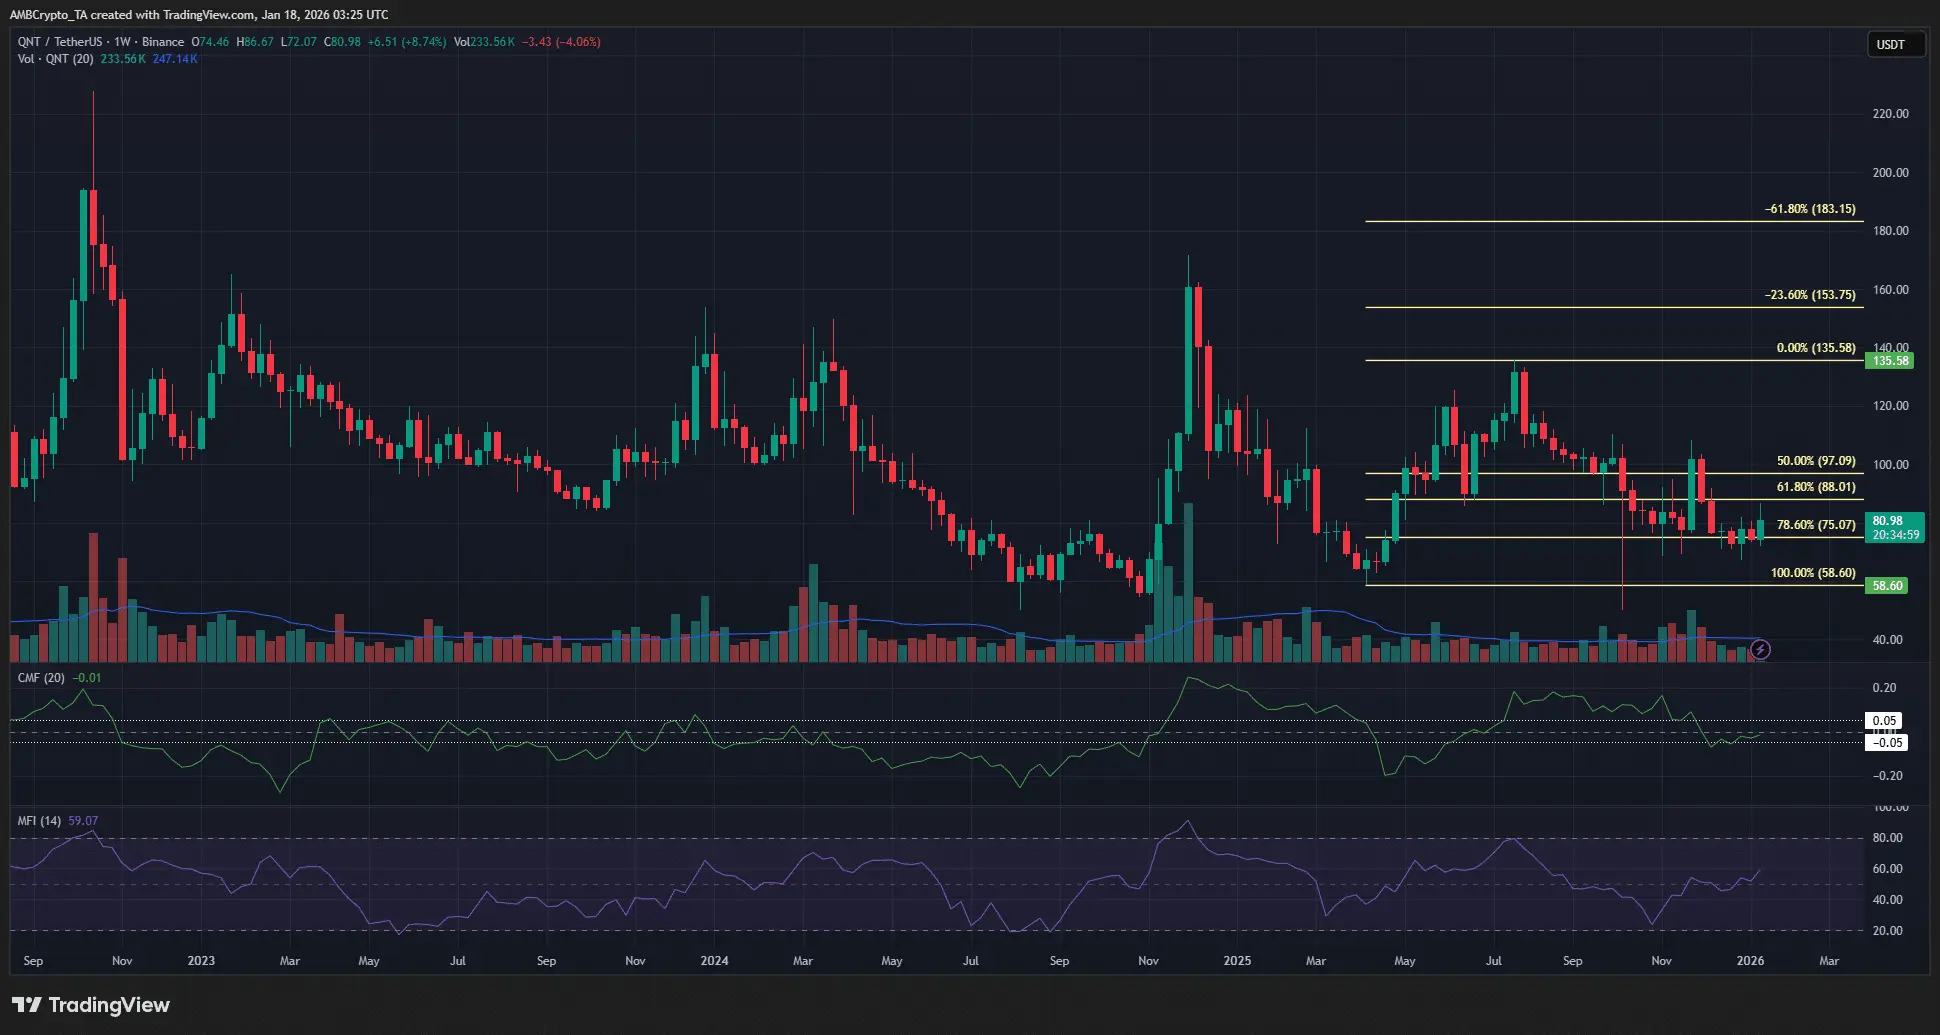 Source: TradingView In recent months, QNT has retraced to the 78.6% Fibonacci level at $75. The buying side has successfully defended this support zone since November, indicating strong demand.
Last week, QNT continued to rise by 8.03%, which could be an early signal of a long-term bullish reversal cycle.
The end of QNT’s correction phase will open up attractive investment opportunities, though certain risks remain. Currently, BTC itself still maintains a bearish structure on the weekly chart, with supply zones at $101,000 and $108,000 potentially exerting selling pressure and hindering BTC’s upward momentum.
Potential risks for long-term investors
Long-term holders should be cautious of the risk of QNT’s price falling further, driven by BTC’s volatility and the overall market sentiment, which is currently oscillating from neutral to cautious. Therefore, the ideal timing for long-term investment has not yet arrived.
Short-term trading strategy – Opportunity to establish positions
On the 4-hour timeframe, QNT maintains an upward structure, creating favorable conditions for traders to open buy positions. The capital rotation trend into altcoins is expected to continue over the next few weeks, providing profit opportunities for Quant holders.
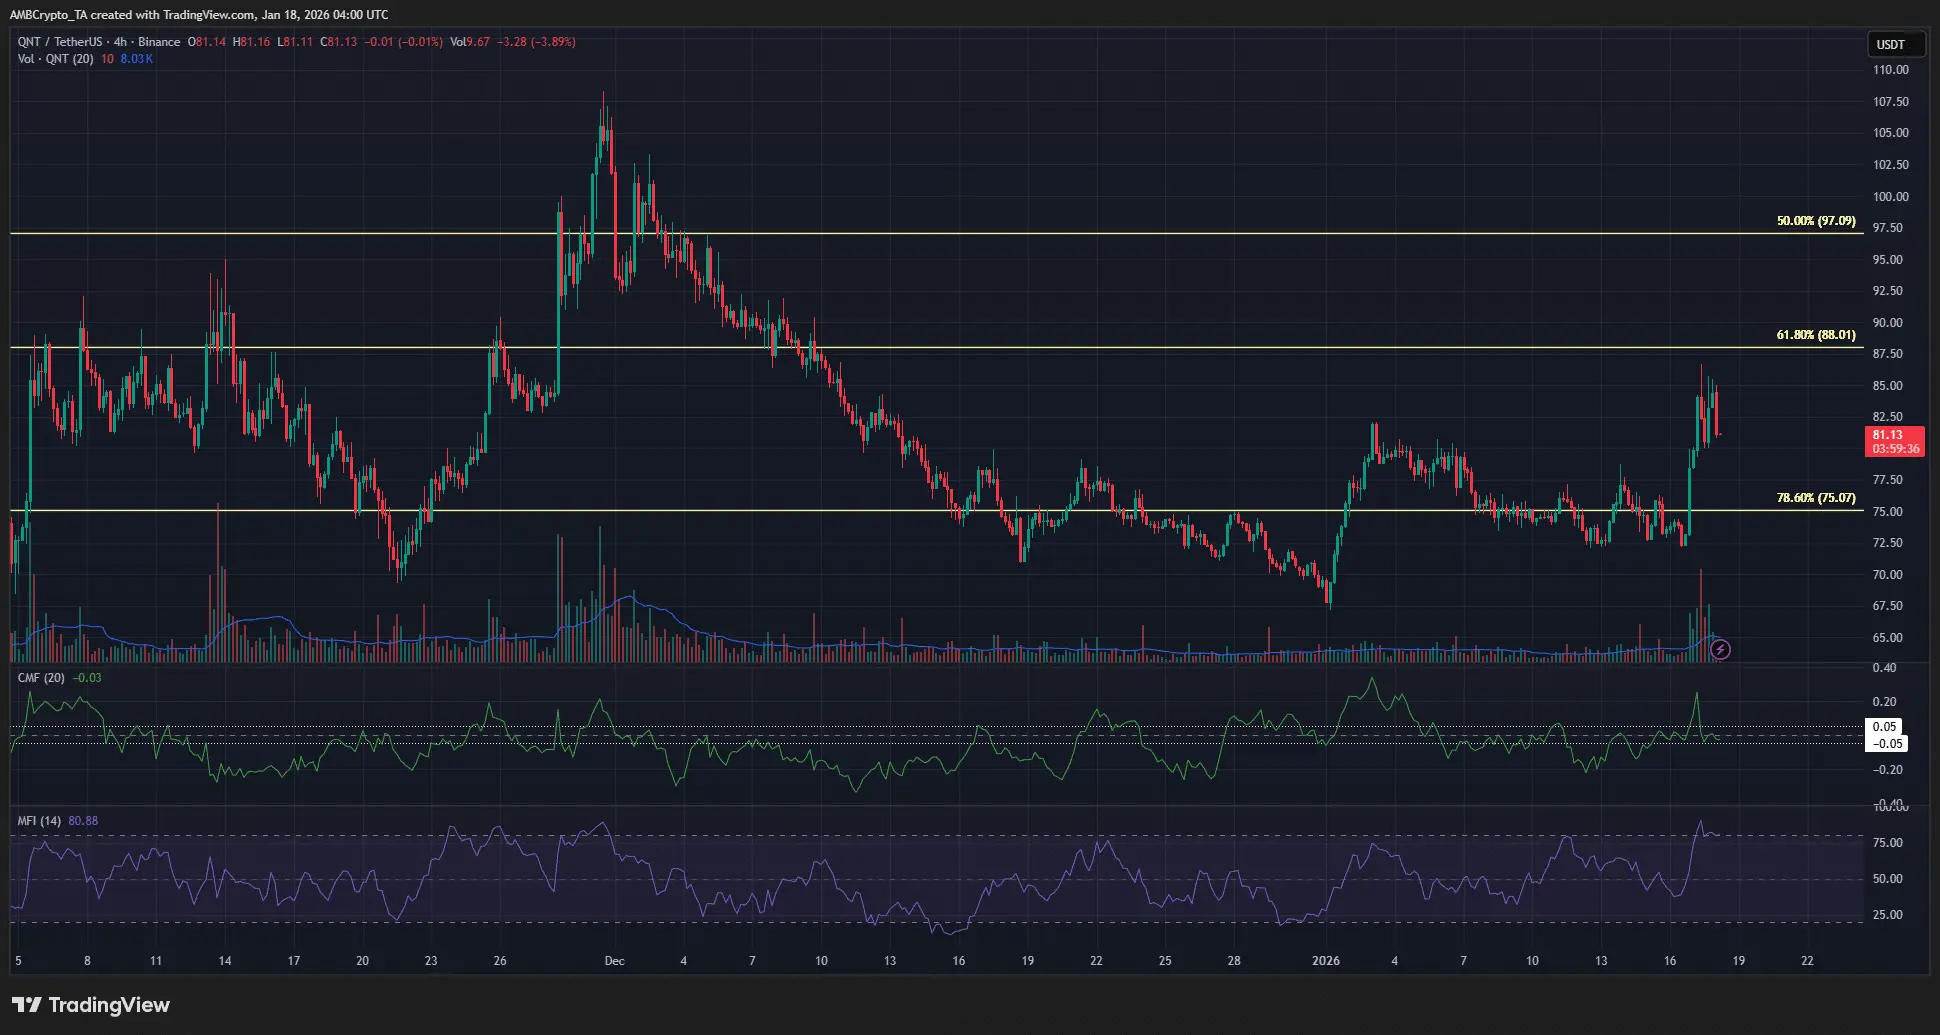 Source: TradingView However, if the 4-hour closing price falls below $72.5, the bullish scenario will be invalidated. Important supply zones above at $90 and $110 are levels where buyers might consider taking profits.
Notably, the net outflow on QNT trading platforms over the past three days has been consistently negative, reflecting strong accumulation trends from investors.
Disclaimer: The information on this page may come from third parties and does not represent the views or opinions of Gate. The content displayed on this page is for reference only and does not constitute any financial, investment, or legal advice. Gate does not guarantee the accuracy or completeness of the information and shall not be liable for any losses arising from the use of this information. Virtual asset investments carry high risks and are subject to significant price volatility. You may lose all of your invested principal. Please fully understand the relevant risks and make prudent decisions based on your own financial situation and risk tolerance. For details, please refer to
Disclaimer.
Related Articles
Analyst: April could be a key observation period for Bitcoin; the RSI is in the neutral range, and volatility may rise
April is typically a stronger month for Bitcoin’s performance, with a historical average monthly gain of about 11.3%. But since 2020, this pattern has become less stable. Bitcoin’s relative strength indicator is currently 47%, and market sentiment is being influenced by geopolitical and inflation concerns. This suggests that April’s volatility may rise, so it’s important to watch whether the market can form a clear direction.
GateNews9m ago
The Old Token Playbook Is Dead: Why Most Crypto Launches Failed in 2025
The old “token playbook” is over, according to 21Shares researcher Darius Moukhtarzade, who said that launching at high FDV, low float with a governance “meme coin” does not work anymore.
Moukhtarzade explained that there is a widening “sentiment-fundamentals gap” as the core reason behind
CryptoPotato17m ago
ETH 15-minute up 0.62%: Driven by ETF net inflows and a liquidity squeeze, short-term strength builds
2026-04-01 03:00 to 03:15 (UTC), the ETH price saw unusual movement, with a range return of +0.62%. The lowest point of the candlestick was 2088.43 USDT, and the highest point was 2106.93 USDT, with a swing of 0.89%. Against the backdrop of heightened volatility across crypto assets, ETH’s short-term trading activity was active, on-chain interest increased, and market attention rose significantly.
The main driver behind this unusual move is that net inflows into U.S. spot ETFs have continued to be amplified. ETF net inflows in early April continued the strong momentum from late March, driving a significant increase in spot demand for ETH.
GateNews1h ago
Is Bitcoin Approaching a Key “Buy Zone”? On-Chain Data Reveals That the Real BTC Bottom Signal Still Has Not Appeared
Bitcoin’s price is nearing the “buy zone” the market is watching, but the bottom signals have not fully formed yet. The current price is above the cost range, suggesting the market hasn’t undergone a major cleanup. The premium continues to narrow, reflecting that the bubble is being worked off. Although the market may face pressure in the short term, funds are positioning early, indicating optimism about future prospects.
GateNews1h ago
Analyst: Bitcoin supply structure is “changing hands”; whales and corporate trading are decoupling
XWIN Research’s analysis indicates that Bitcoin underwent a structural supply shift in the first quarter of 2026, with an increase in the exchange whale ratio. This suggests that large holders are selling Bitcoin, while publicly listed companies such as MicroStrategy have net-bought 62,000 Bitcoins. The market shows a dual trend of exchange whales and corporate accumulation: supply has shifted from early investors to companies’ balance sheets, and market liquidity has not improved significantly.
MarketWhisper1h ago
Bitcoin’s Most Dangerous Pattern Just Triggered: Will BTC Dump to $26K Next?
Although bitcoin has already dumped by over 50% from its all-time high of over $126,000 marked in October to a multi-year low of $60,000, the asset’s troubles might not be over, warned Merlijn The Trader.
The popular analyst indicated that the “most dangerous bitcoin pattern just completed phase
CryptoPotato2h ago
